A TLAS-CONF-2017-015 31 Mar ch 2017
ATLAS NOTE
ATLAS-CONF-2017-015
22nd March 2017
Search for pair production of vector-like top quarks in events with one lepton and an invisibly decaying Z boson in √
s = 13 TeV pp collisions at the ATLAS detector
The ATLAS Collaboration
Abstract
The results of a search for vector-like top quarks in the Zt + X channel using final states with exactly one lepton, at least four jets, and large missing transverse momentum are reported.
LHC pp collision data at a centre-of-mass energy of
√ s = 13 TeV recorded by the ATLAS detector in 2015 and 2016 are used, corresponding to an integrated luminosity of 36.1 fb
−1. No significant excess over the Standard Model expectation is seen and upper limits on the production cross-section of the pair production of a vector-like T quark as a function of its mass are derived. The observed (expected) 95 % CL lower limits on the T mass are 870 GeV (890 GeV) for the weak-isospin singlet model, 1.05 TeV (1.06 TeV) for the weak- isospin doublet model and 1.16 TeV (1.17 TeV) for the pure Zt decay mode. Limits are also set on the mass as a function of the decay branching ratios, excluding large parts of the parameter space for masses below 1 TeV.
© 2017 CERN for the benefit of the ATLAS Collaboration.
Reproduction of this article or parts of it is allowed as specified in the CC-BY-4.0 license.
1 Introduction
Several theories beyond the Standard Model (SM) of particle physics try to address the naturalness problem [1] and offer mechanisms through which the quadratic divergences, that arise from the radiative corrections to the Higgs boson mass, are resolved. One of the most straightforward extensions of the SM is the inclusion of a heavy fourth quark generation. However, fourth generation quarks with SM-like chiral couplings are excluded as they contribute through loops to the couplings of the Higgs boson, altering the cross sections of the Higgs to values incompatible with observation [2, 3]. These constraints on chiral quarks can be evaded by vector-like quarks [4, 5], hypothetical spin-1/2 colored particles, where the left-handed and right-handed states have the same coupling. Vector-like quarks could dampen the unnaturally large quadratic corrections to the Higgs mass by contributing to strong loop corrections. They appear mainly in the “Little Higgs” [6, 7] and “Composite Higgs” [8] class of models.
In this analysis, a vector-like top partner ( T ) with a charge of Q = +
2/
3|e| is searched for. The three possible decay modes are: T → Zt, T → Ht, T → W b , when assuming couplings to only the third generation of quarks [9], as favoured by their large masses [10]. For masses above about 0.8 TeV the branching ratios converge to BR (T → W b) ' 50 % and BR (T → Zt) ' BR (T → Ht) ' 25 % for a weak-isospin singlet model and to BR (T → Zt) ' BR (T → Ht) ' 50 % for a weak-isospin doublet model. The doublet prediction is valid for a ( X
5/3, T ) doublet, where the superscript refers to the charge of the particle, as well as for a (T, B) doublet, as long as the generalised CKM matrix elements fulfil |V
T b| |V
Bt| [9, 11]. In addition to these two models, the case of arbitrary branching ratios of the three possible decay modes is considered.
T
T ¯ g
g
Z, H, W t, t, b
Z, H, W
¯ t, ¯ t, ¯ b
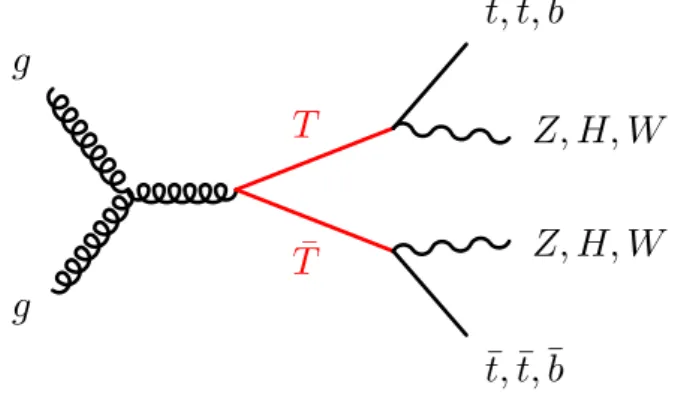
Figure 1: Representative diagram of the production and decay of a vector-like top quark pair.
Vector-like top (VLT) quarks could be produced singly or in pairs at the LHC. This analysis targets the pair production pp → T T ¯ channel, as shown in figure 1. The production cross-section is predicted to be 0 . 044 ± 0 . 005 pb for a T mass of 1 TeV, calculated at next-to-next-to-leading order (NNLO) in QCD including next-to-next-to-leading logarithmic (NNLL) soft-gluon resummation using Top++ 2.0 [12–17].
Previous searches for pair-produced vector-like T quarks by ATLAS and CMS at centre-of-mass energies of 8 TeV [18–21] and 13 TeV [22] set lower limits on the VLQ mass in the range of 550-900 GeV, depending on the branching ratio considered.
This analysis focuses on the channel T T ¯ → Zt + X , where the Z boson decays into a neutrino pair and exactly one charged lepton is produced in either the top quark decay or from the other leg of the VLQ pair decay. This channel gives rise to a final state with one lepton, multiple jets and a high missing transverse momentum ( E
missT
) mainly due to the invisibly decaying Z boson. A single-bin signal region
2
(SR) is defined by an event selection that maximises the sensitivity to this particular channel. Control regions (CRs) and validation regions (VRs) are defined that are enriched in the various background processes. They are orthogonal to the SR and orthogonal to each other. The statistical interpretation is based on a simultaneous fit to the CRs and the SR, in which the background normalisations and a possible signal contribution are determined, while taking into account the experimental and theoretical systematic uncertainties. The analysis strategy closely follows that of a search for a supersymmetric partner of the top quark in a similar final state [22].
2 ATLAS detector
The ATLAS detector [23] is a multi-purpose particle detector at the CERN Large Hadron Collider (LHC) [24] with nearly 4 π coverage around the collision point.1 Closest to the beam is the inner detector (ID) which provides charged-particle tracking in the range |η | < 2 . 5. During the LHC shutdown between Run 1 and Run 2, a new innermost layer of silicon pixels was added, which improves the track impact parameter resolution and vertex position resolution performance [25, 26]. The inner tracking detector is surrounded by a superconducting solenoid providing a 2 T axial magnetic field, followed by an electromagnetic lead/liquid-argon (LAr) sampling calorimeter and a hadronic (steel/scintillator- tile) calorimeter. The endcap and forward regions are instrumented with LAr calorimeters for both the electromagnetic and hadronic energy measurements up to |η | = 4 . 9. The outer part of the detector consists of a muon spectrometer (MS) with high-precision tracking chambers for a coverage up to |η | = 2 . 7, fast detectors for triggering over |η| < 2 . 4, and three large superconducting toroid magnets with eight coils each. Events are selected by a two-level trigger system consisting of a hardware-based trigger on the first level and a software-based system for the second level [27].
The data used in this analysis were recorded in 2015 and 2016, corresponding to an integrated luminosity of 36.1 fb
−1in total, with an uncertainty of 3.2%, derived following a similar methodology as in Refs. [28, 29].
The data were collected using triggers that select events with high missing transverse momentum, with online thresholds of 70 GeV for 2015 and 90 GeV to 110 GeV for 2016. The triggers have an efficiency greater than 99% for an offline E
missT
requirement of at least 300 GeV.
3 Signal modelling and Monte Carlo simulations
Monte Carlo (MC) simulated events are used for the description of the backgrounds and to model the VLQ signals. Signal samples are generated at leading order (LO) with Protos v2.2 [9, 11], interfaced with Pythia 8 [30] for the parton shower (PS) and hadronisation. The VLQ particles are forced to decay with a branching ratio of
1/
3into each of the three decay modes ( Zt , Ht , W b ) and desired branching ratios are obtained by reweighting the samples. The samples are produced assuming that the vector-like T quark is a weak-isospin singlet. To test potential kinematic biases from this assumption, a comparison to a sample in which the T quark is in a weak-isospin doublet was carried out. A slightly higher acceptance is observed
1
ATLAS uses a right-handed coordinate system with its origin at the nominal interaction point (IP) in the centre of the detector and the z -axis along the beam pipe. The x -axis points from the IP to the centre of the LHC ring, and the y -axis points upward. Cylindrical coordinates (r,φ) are used in the transverse plane, φ being the azimuthal angle around the beam pipe.
The pseudorapidity is defined in terms of the polar angle θ as η = − ln tan (θ/ 2 ) . Angular distance is measured in units of
∆R = q
(∆η)
2+ (∆φ)
2.
3
in the doublet case. This effect is neglected in the analysis and results in slightly conservative limits for the doublet model.
For the background samples, several matrix element (ME) generators are combined with parton shower and hadronisation generators. Powheg-Box v2 [31–34] interfaced to Pythia 6.428 [35] is used to simulate t t ¯ production as well as single-top production in association with a W boson, while electroweak t -channel single-top quark production events are generated using the Powheg-Box v1 generator. Events containing W bosons with associated jets ( W +jets) are simulated using the Sherpa v2.2.0 generator [36–38], while for diboson events Sherpa v2.1.1 is used. For the simulation of t t ¯ events with additional vector bosons the MadGraph5_aMC@NLO v2.2 [39] generator interfaced with Pythia 8 is used.
All MC samples are normalised to the highest order inclusive cross-section available at
√ s = 13 TeV.
The parton distribution function (PDF) sets used are CT10 [40] for the Powheg-Box and Sherpa 2.1.1 generators, NNPDF 3.0 NNLO [41] for Sherpa 2.2.0, and NNPDF 2.3 LO [42] for Protos and Mad- Graph5_aMC@NLO. The samples produced with Protos, MadGraph5_aMC@NLO and Powheg-Box use EvtGen v1.2.0 [43] for the modelling of b -hadron decays. All simulated samples are processed with the full simulation of the ATLAS detector [44] using Geant 4 [45], and with varying numbers of simulated minimum-bias interactions generated with Pythia 8 overlaid on the hard-scattering event to account for pile-up from multiple pp interactions in the same or nearby bunch crossings. The average number of interactions per bunch crossing in simulation matches the distribution in data. Additional details for the simulation setup can be found in Refs. [46–49].
4 Event reconstruction and object selection
Two sets of quality and kinematic requirements are imposed for physics objects in this analysis, labelled baseline and signal requirements, where the latter label describes a tighter selection than the former.
Electron candidates are reconstructed from cell clusters in the electromagnetic calorimeter that are matched to ID tracks. Baseline electrons are required to have p
T> 7 GeV, |η | < 2 . 47, and satisfy ‘VeryLoose’
likelihood identification criteria, defined following the methodology described in Ref. [50]. Signal electrons must pass all baseline requirements, have p
T> 28 GeV, and satisfy the ‘Tight’ likelihood identification criteria [50]. Their impact parameters, defined as the distance of closest approach with respect to the reconstructed primary vertex along the beam direction ( z
0) and in the transverse plane ( d
0), are required to satisfy | z
0sin θ | < 0 . 5 mm and | d
0|/σ
d0< 5, where σ
d0is the uncertainty of d
0. Furthermore, signal electrons are required to be isolated, imposing that the p
Tsum of all tracks in a cone around the electron momentum with R < 10 GeV /p
eT
, with a maximum cone radius of 0.2, is lower than 6% of the electron p
T.
Muon candidates are reconstructed from combined tracks that are formed from ID and MS tracks, ID tracks matched to MS track segments, standalone MS tracks, or ID tracks matched to an energy deposit in the calorimeter compatible with a minimum-ionizing particle (referred to as calo-tagged muon) [51]. Baseline muons are required to have p
T> 6 GeV, |η | < 2 . 7, and satisfy the ‘Loose’ identification criteria [51].
Signal muons must satisfy the ‘Medium’ identification criteria, are required to have p
T> 28 GeV, and impact parameters |z
0sin θ | < 0 . 5 mm and |d
0|/σ
d0< 3. In addition, they must be isolated, requiring that the p
Tsum of all tracks in a cone around the muon momentum with R < 10 GeV /p
µT
, with a maximum cone radius of 0.3, is lower than 6% of the muon p
T.
4
Jet candidates are reconstructed from topological clusters [52, 53] built from energy deposits in the calorimeters calibrated to the electromagnetic scale, using the anti- k
talgorithm with radius parameter R = 0 . 4 [54]. Baseline (signal) jets are required to have p
T> 20 GeV ( p
T> 25 GeV) and |η | < 4 . 4 ( |η | < 2 . 5 ) . To reject jets originating from pile-up events, signal jets with p
T< 60 GeV and |η| < 2 . 4 are required to pass jet vertex tagger criteria [55]. If a baseline jet in an event does not pass the ‘Loose’ jet quality requirements of Ref. [56], the event is vetoed in order to suppress detector noise and non-collision backgrounds [56, 57]. A b -tagging algorithm based on multivariate techniques is used to identify jets containing b -hadrons, so-called b -jets [58–60]. The working point used provides an average tagging efficiency of 77 % for b -jets in simulated t¯ t events, as well as a rejection factor of about 130 for light-quark flavours (u,d,s) and gluons and about six for charm jets.
Jets and associated tracks are also used to identify hadronically decaying τ leptons using the ‘Loose’
identification criteria described in Refs. [61, 62]. The τ candidates are required to have one or three associated tracks, with total electric charge opposite to that of the selected electron or muon, p
T> 20 GeV, and |η | < 2 . 5.
The missing transverse momentum is reconstructed from the negative vector sum of the transverse momenta of baseline electrons, muons, jets, and a soft-term built from high-quality tracks that are associated with the primary vertex but not with the baseline physics objects [63, 64].
Energy deposits reconstructed as two different particle candidates are resolved by removing one of the candidates according to the following procedure:
1. Electron/Jet: if a baseline electron and a baseline jet are found within ∆R < 0 . 2 the overlapping jet is removed.
2. Muon/Jet: if a baseline muon overlaps with a baseline jet within ∆R < 0 . 4 the overlapping jet is removed if the jet has fewer than 3 tracks with p
T> 500 MeV.
3. Jet/Lepton:
• If a jet that passes the previous steps overlaps with a muon in a cone with radius R = 0 . 04 + 10 GeV /p
T, up to a maximum radius of 0.4, the muon is removed.
• If a jet that passes the previous steps overlaps with an electron in a cone with radius R = 0 . 4, the electron is removed.
4. Electron/Tau: if an electron that passes the previous steps overlaps with a tau candidate in a cone with radius R = 0 . 1, the tau is removed.
Large-radius jets are constructed from signal jets using the anti- k
talgorithm with R = 1 . 0. Constituent small-radius jets with p
Tless than 5 % of the large-radius jet p
Tare removed, mainly in order to reduce the impact of soft radiation.
5 Event selection and background estimation
Events are required to have exactly one signal lepton ( L = e, µ ), at least four signal jets and E
missT
> 300 GeV.
A veto on events with a second lepton, fulfilling the baseline requirements, is used to suppress dileptonic t t ¯ events. Further event selection is performed using objects fulfilling the signal requirements described in the previous section. The azimuthal angle between the missing transverse momentum vector E ~
missT
and
5
both the leading ( j
1) and sub-leading ( j
2) jet, ordered in p
T, must satisfy the condition |∆φ( j
i, E ~
missT
)| > 0 . 4 with i ∈ { 1 , 2 } , which rejects events with E
missT
arising from mis-measured jets. In addition, at least one b -tagged jet is required.
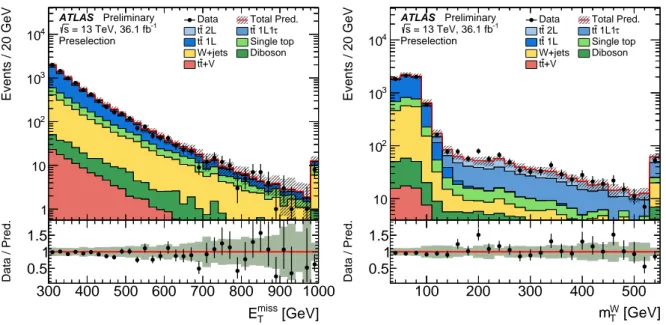
After applying these requirements, the dominant backgrounds are single lepton plus jets (1 L ) t¯ t events, where the lepton comes either directly from the W decay or from the subsequent τ decay, and W +jets production. This can be seen in figure 2, which shows a comparison of data and SM expectation as a function of E
missT
and m
WT
at the so-called preselection level as defined in table 1. Here m
WT
is defined as the transverse mass2 of the signal lepton and the missing transverse momentum. Requiring m
WT
to be well above the W boson mass strongly reduces 1 L t t ¯ events and W +jets production as can be seen from the right panel of figure 2. The remaining events at large m
WT
are dominated by t¯ t production where both W bosons decay leptonically. The two cases of two leptons (2 L ) and one lepton and a hadronically decaying τ (1 L 1 τ ) are shown separately, distinguished based on MC generator information.
[GeV]
miss
E
T300 400 500 600 700 800 900 1000
Data / Pred.
0.5 1 1.5
[GeV]
miss
ET
Events / 20 GeV
1 10 102
103
104
Data Total Pred.
2L t
t tt 1L1τ 1L
t
t Single top
W+jets Diboson +V
t t ATLAS Preliminary
= 13 TeV, 36.1 fb-1
s Preselection
[GeV]
W
m
T100 200 300 400 500
Data / Pred.
0.5 1 1.5
[GeV]
W
mT
Events / 20 GeV
10 102
103
104
Data Total Pred.
2L t
t tt 1L1τ 1L
t
t Single top
W+jets Diboson +V
t t ATLAS Preliminary
= 13 TeV, 36.1 fb-1
s Preselection
Figure 2: Comparison of data and prediction in the E
missT
distribution (left) and the m
WT
distribution (right) after the preselection. The lower panels show the ratio of the data to the prediction. The error bands include statistical and systematic uncertainties. The last bin contains the overflow.
Additional variables are used to reduce these dileptonic t¯ t backgrounds. The m
T2variable [65] is a generalisation of the transverse mass applied to signatures where two particles are not directly detected [66, 67], defined as
m
T2≡ min
~
qTa+~qTb=~pmiss T
{ max (m
Ta, m
Tb)} .
In this formula, m
Taand m
Tbare transverse masses calculated using the visible particles a and b , respectively, and all possible combinations of missing transverse momenta q ~
Taand ~ q
Tb, with ~ q
Ta+ ~ q
Tb=
~ p
missT
. This analysis uses two specific choices for the visible particles a and b , and the corresponding variables are referred to as am
T2and m
τT2
. The am
T2variable can be used to suppress dileptonic t¯ t
2
The transverse mass m
WT
is defined as m
WT
= q 2p
lepT
E
missT
[1 − cos (∆φ) ], where ∆φ is the azimuthal angle between the lepton and the missing transverse momentum direction and p
lepT
is the transverse momentum of the charged lepton.
6
events where one lepton goes undetected. Thus, the visible particles for the am
T2are combinations of the identified lepton and the two jets with the highest b -tagging weights, where the lepton is combined with either jet and the combination with the lowest resulting am
T2is taken. For dileptonic t¯ t events am
T2has a kinematic endpoint at the top mass but is expected to extend much higher for processes with additional sources of E
missT
. The m
τT2
variable targets t¯ t events where one of the W bosons decays via a hadronically decaying τ . It is only constructed in events where a hadronically decaying τ candidate is found. The τ candidate and the signal lepton are used as the two visible particles. For these events, m
τT2
is required to be greater than 80 GeV as it has a kinematic endpoint at the W mass for t t ¯ events. If fulfilled, the τ candidate is no longer used and instead the jet candidate, from which the τ is identified, is considered for the rest of the computations.
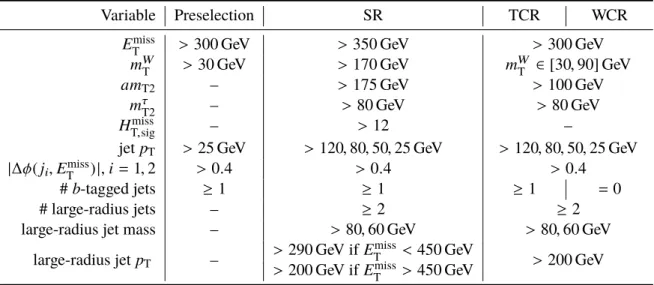
Table 1: Overview of the event selections for the signal region (SR) and the background control regions for t t ¯ (TCR) and W +jets (WCR) processes.
Variable Preselection SR TCR WCR
E
missT
> 300 GeV > 350 GeV > 300 GeV
m
WT
> 30 GeV > 170 GeV m
WT
∈ [30 , 90] GeV
am
T2– > 175 GeV > 100 GeV
m
τT2
– > 80 GeV > 80 GeV
H
missT,sig
– > 12 –
jet p
T> 25 GeV > 120 , 80 , 50 , 25 GeV > 120 , 80 , 50 , 25 GeV
|∆φ( j
i, E
missT
) | , i = 1 , 2 > 0 . 4 > 0 . 4 > 0 . 4
# b -tagged jets ≥ 1 ≥ 1 ≥ 1 = 0
# large-radius jets – ≥ 2 ≥ 2
large-radius jet mass – > 80 , 60 GeV > 80 , 60 GeV
large-radius jet p
T– > 290 GeV if E
missT
< 450 GeV > 200 GeV
> 200 GeV if E
missT
> 450 GeV The H
missT,sig
[68] variable is used to reduce events with mis-reconstructed E
missT
. It is defined as H
missT,sig
≡ ( H
missT
− 100 GeV)/σ
HmissT
, where the exact value of the constant has no impact on this analysis and was optimised for the search mentioned above [69]. Here H
missT
is the magnitude of the vectorial sum of the lepton and jets transverse momenta and σ
HmissT
is the approximate resolution of H
missT
, computed using the per-event jet energy resolution [70].
5.1 Signal region selection
The signal region selection is optimised targeting a benchmark signal with a T quark mass of 1 TeV, a branching ratio for the T → Zt decay of 80 %, and equal branching ratios for the other two decay modes ( T → Ht , T → W b ). This benchmark signal was chosen due to its mass being at the expected sensitivity reach of this analysis, and its high branching ratio into the required Zt decay mode, while at the same time allowing for decays into other final states. A summary of the SR selection is given in table 1. Due to the invisible decay of the Z boson, a high E
missT
requirement of at least 350 GeV is set. As discussed above, the m
WT
and am
T2variables are used to reduce the t¯ t and W +jets backgrounds. The properties of large radius jets are used to exploit the structure of the high mass VLT decay. At least two large-radius jets with high p
Tand large mass are required. These target the hadronically decaying top quark, or the hadronic W boson
7
decay, as well as a second, hadronically decaying massive boson from the VLT decay. At very high E
missT
the backgrounds are sufficiently reduced to allow for looser requirements on the large-radius jet p
T. For the benchmark signal 13 . 4 ± 0 . 5 events are expected in the SR, with 95% of them containing an invisibly decaying Z boson. This number decreases to 75% for the singlet model with a T quark mass of 1 TeV, where the BR (T → Zt) is only about 25 %. The efficiency of the full event selection for the benchmark signal is 1 %, taking all decay modes into account. For events with Z → ν ν ¯ and one leptonically decaying W boson from a top quark decay, the selection efficiency is about 10 %.
5.2 Background estimation
The dominant background in the SR is t¯ t production, followed by about equal contributions from W +jets and single-top production. In order to derive the normalisation of the t t ¯ and W +jets processes from data, dedicated control regions are defined and referred to as TCR and WCR, respectively. The background normalisation and a possible signal contribution are determined simultaneously in a binned maximum likelihood fit to the signal and the control regions.
The CRs are defined by modifying the requirement on m
WT
to a window around the W boson mass, ensuring orthogonality between the CRs and the SR. Requirements on E
missT
, am
T2and H
missT,sig
are loosened in order to increase the statistics in the CRs. In the W +jets control region, a veto on b -tagged jets is used to enrich the W +jets contribution and make the selection orthogonal to the t¯ t control region. Table 1 gives the CR selection in comparison to the SR requirements. The normalisation factors obtained for t¯ t and W +jets are µ
tt¯= 1 . 05 ± 0 . 17 and µ
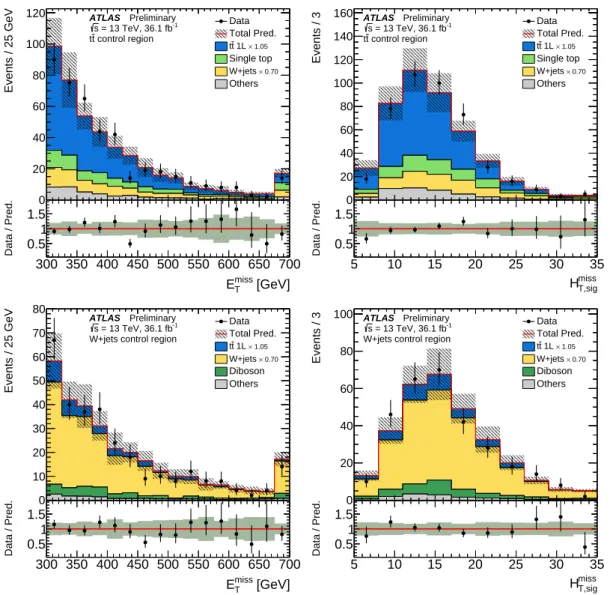
W+jets= 0 . 70 ± 0 . 10, respectively, where the error includes both statistical and systematic uncertainties. Applying these normalisation factors, a comparison of data and simulation in the E
missT
and H
T,sigmissdistributions is shown in both CRs in figure 3. The normalisation factors, in particular the one for W +jets, are tested further as described in section 5.3 and section 6.
The single-top background is taken from simulation. Additional backgrounds considered in the analysis are diboson production as well as t¯ t production in association with a vector boson. These backgrounds have a small contribution to the SR and are taken also from simulation. Rare backgrounds, like the associated production of t¯ t with a Higgs boson, contribute less than 1% to the total expected background in the SR and are not considered further. The contribution of QCD multi-jet events is negligible after the requirements on E
missT
and |∆φ( j
i, E ~
missT
)| . 5.3 Background validation
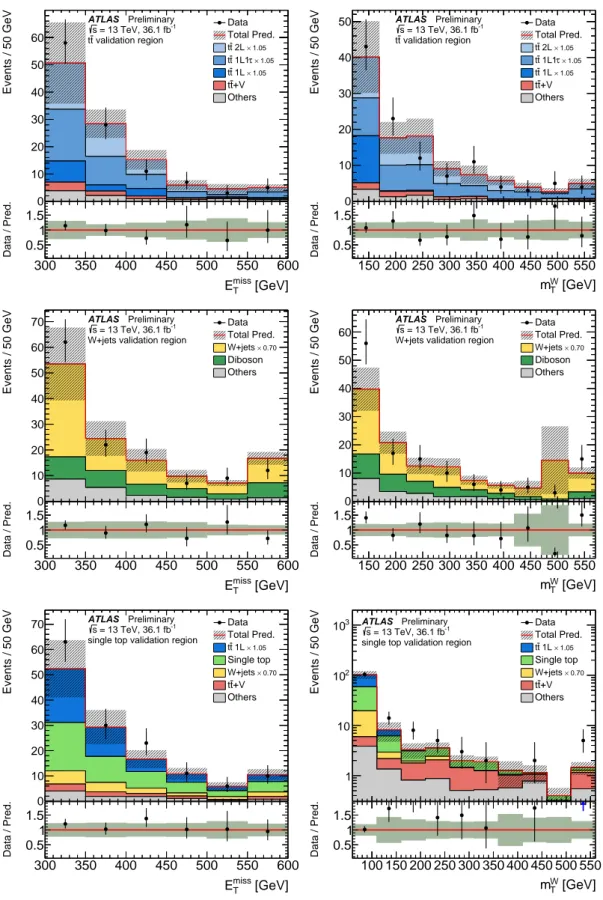
The background estimates are tested in validation regions, that are not included in the maximum likelihood fit. The background normalisation factors determined in the CRs are applied in the VRs. All VRs are defined by requiring exactly one large-radius jet, to ensure orthogonality with the event selection defining the signal and control regions. Furthermore, some SR cuts are relaxed in order to increase the statistics.
Three VRs are defined, for the t t ¯ , single-top and W +jets processes. The exact definitions are summarised in table 2. No indication of mismodelling is observed in any of the VRs, as shown for the example of E
missT
and m
WT
in figure 4.
8
[GeV]
miss
E
T300 350 400 450 500 550 600 650 700
Data / Pred.
0.5 1 1.5
[GeV]
miss
ET
Events / 25 GeV
0 20 40 60 80 100
120 Data
Total Pred.
1.05
× 1L t t Single top
0.70
× W+jets Others ATLAS Preliminary
= 13 TeV, 36.1 fb-1
s
control region t
t
miss T,sig
H
5 10 15 20 25 30 35
Data / Pred.
0.5 1 1.5
miss T,sig
H
Events / 3
0 20 40 60 80 100 120 140
160 Data
Total Pred.
1.05
× 1L t t Single top
0.70
× W+jets Others ATLAS Preliminary
= 13 TeV, 36.1 fb-1
s
control region t
t
[GeV]
miss
E
T300 350 400 450 500 550 600 650 700
Data / Pred.
0.5 1 1.5
[GeV]
miss
ET
Events / 25 GeV
0 10 20 30 40 50 60 70 80
Data Total Pred.
1.05
× 1L t t
0.70
× W+jets Diboson Others ATLAS Preliminary
= 13 TeV, 36.1 fb-1
s
W+jets control region
miss T,sig
H
5 10 15 20 25 30 35
Data / Pred.
0.5 1 1.5
miss T,sig
H
Events / 3
0 20 40 60 80
100 Data
Total Pred.
1.05
× 1L t t
0.70
× W+jets Diboson Others ATLAS Preliminary
= 13 TeV, 36.1 fb-1
s
W+jets control region
Figure 3: Comparison of data and prediction in the E
missT
distribution (left) and the H
T,sigmissdistribution (right) in the TCR (top) and the WCR (bottom). The t t ¯ and W +jets normalisations are derived from the simultaneous fit, as indicated in the legend. The lower panels show the ratio of the data to the prediction. The error bands include statistical and systematic uncertainties. The last bin contains the overflow.
6 Systematic uncertainties
Systematic uncertainties from experimental sources and from the theoretical predictions affect the signal and background estimates. They are included as nuisance parameters with Gaussian constraints and are profiled in the likelihood fits that determine the background normalisation factors and the possible signal contribution. The uncertainties are not constrained further in the fits as the analysis has as many bins as free parameters. In general the systematic uncertainties are smaller than the statistical ones.
Dominant experimental uncertainties come from the imperfect knowledge of the jet mass and jet energy scale and resolution, as well as the modelling of the b -tagging efficiency for b , c and light flavour jets.
The relative uncertainty on the estimated background yields in the SR from these sources is 1%–5%. In
9
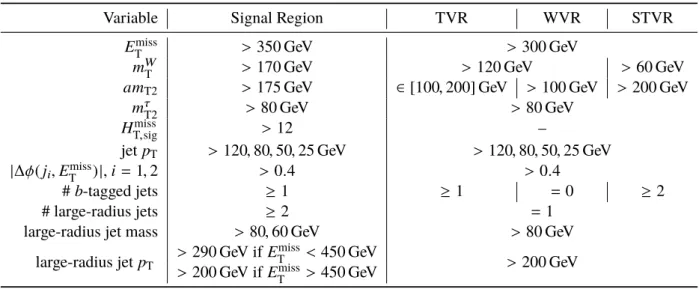
Table 2: Selection of the t¯ t (TVR), the W +jets (WVR) and the single-top (STVR) validation regions, compared to the signal region (SR).
Variable Signal Region TVR WVR STVR
E
missT
> 350 GeV > 300 GeV
m
WT
> 170 GeV > 120 GeV > 60 GeV
am
T2> 175 GeV ∈ [100 , 200] GeV > 100 GeV > 200 GeV m
τT2
> 80 GeV > 80 GeV
H
missT,sig
> 12 –
jet p
T> 120 , 80 , 50 , 25 GeV > 120 , 80 , 50 , 25 GeV
|∆φ( j
i, E
missT
) | , i = 1 , 2 > 0 . 4 > 0 . 4
# b -tagged jets ≥ 1 ≥ 1 = 0 ≥ 2
# large-radius jets ≥ 2 = 1
large-radius jet mass > 80 , 60 GeV > 80 GeV
large-radius jet p
T> 290 GeV if E
missT
< 450 GeV > 200 GeV
> 200 GeV if E
missT
> 450 GeV
addition, the uncertainty on the scale and the resolution of the small-radius jet masses is considered. It has a small effect on the background, but affects the signal as hadronically decaying Z and W bosons can be reconstructed as a single small-radius jet. Additional small experimental uncertainties are due to the scale and the resolution of the E
missT
soft-term, which captures all tracks not associated with calibrated objects in the event, the modelling of lepton related quantities, the trigger efficiency, as well as the uncertainty on the integrated luminosity and the pile-up profile.
The uncertainties in the modelling of the t t ¯ background come from the choice of the MC event generator, the hadronisation and fragmentation modelling, and the amount of initial- and final-state radiation. The MC generator uncertainty is estimated by comparing events produced with Powheg-Box and with Mad- Graph5_aMC@NLO, both in conjunction with Herwig++ [71], and is the dominant uncertainty on the t¯ t modelling, amounting to an uncertainty of 17% on the total background yield in the SR. The hadronisation and fragmentation uncertainty is about 13%, assessed by comparing events generated with Powheg-Box and hadronised with either Pythia or Herwig++. Powheg-Box-Pythia samples with different parton shower radiation settings, different settings of QCD radiation at NLO accuracy, and modified factorisation and renormalisation scales yield an uncertainty of 11%.
The uncertainty on the modelling of the W +jets process is estimated by comparing the nominal simulation to a MadGraph5_aMC@NLO simulation. In addition, the effects of independently varying the scales for the renormalisation, factorisation, and resummation by factors of 0.5 and 2 are taken into account.
Also the scale of the matching scheme related to the merging of matrix elements and parton showers is varied between 15 GeV and 30 GeV. Since the W +jets background is normalised in a CR with a veto on b -tagged jets, additional uncertainties of about 30% on the flavour composition of the W +jets events are applied in all regions requiring at least one b -tagged jet. These uncertainties are based on the measurement reported in Ref. [72], extrapolated to higher jet multiplicities. As a further check, a region with at least one b -tagged jet is defined, which is enriched though not dominated by the W +jets contribution. Good agreement between data and SM expectation is found when applying the normalisation factors obtained in the CRs. The total uncertainty on the W +jets modelling in the SR is about 40%, resulting in a 6%
uncertainty on the total background estimate.
10
[GeV]
miss
E
T300 350 400 450 500 550 600
Data / Pred.
0.5 1 1.5
[GeV]
miss
ET
Events / 50 GeV
0 10 20 30 40 50 60
Data Total Pred.
1.05
× 2L t t
1.05 τ× 1L1 t t
1.05
× 1L t t
+V t t Others ATLAS Preliminary
= 13 TeV, 36.1 fb-1
s
validation region t
t
[GeV]
W
m
T150 200 250 300 350 400 450 500 550
Data / Pred.
0.5 1 1.5
[GeV]
W
mT
Events / 50 GeV
0 10 20 30 40
50 Data
Total Pred.
1.05
× 2L t t
1.05 τ× 1L1 t t
1.05
× 1L t t
+V t t Others ATLAS Preliminary
= 13 TeV, 36.1 fb-1
s
validation region t
t
[GeV]
miss
E
T300 350 400 450 500 550 600
Data / Pred.
0.5 1 1.5
[GeV]
miss
ET
Events / 50 GeV
0 10 20 30 40 50 60
70 Data
Total Pred.
0.70
× W+jets Diboson Others ATLAS Preliminary
= 13 TeV, 36.1 fb-1
s
W+jets validation region
[GeV]
W
m
T150 200 250 300 350 400 450 500 550
Data / Pred.
0.5 1 1.5
[GeV]
W
mT
Events / 50 GeV
0 10 20 30 40 50
60 DataTotal Pred.
0.70
× W+jets Diboson Others ATLAS Preliminary
= 13 TeV, 36.1 fb-1
s
W+jets validation region
[GeV]
miss
E
T300 350 400 450 500 550 600
Data / Pred.
0.5 1 1.5
[GeV]
miss
ET
Events / 50 GeV
0 10 20 30 40 50 60
70 Data
Total Pred.
1.05
× 1L t t Single top
0.70
× W+jets
+V t t Others ATLAS Preliminary
= 13 TeV, 36.1 fb-1
s
single top validation region
[GeV]
W
m
T100 150 200 250 300 350 400 450 500 550
Data / Pred.
0.5 1 1.5
[GeV]
W
mT
Events / 50 GeV
1 10 102
103 Data
Total Pred.
1.05
× 1L t t Single top
0.70
× W+jets
+V t t Others ATLAS Preliminary
= 13 TeV, 36.1 fb-1
s
single top validation region
Figure 4: Comparison of data and prediction in the E
missT
distribution (left) and the m
WT
distribution (right) in the TVR (top), WVR (middle) and STVR (bottom). The t t ¯ and W +jets normalisations are derived from the simultaneous fit, as indicated in the legend. The lower panels show the ratio of the data to the prediction. The error bands include statistical and systematic uncertainties. The last bin contains the overflow.
11
The dominant uncertainty on the single-top processes stems from the modelling of the interference between the t¯ t and W t processes at NLO, leading to an uncertainty of 11% on the total background yield in the SR.
The uncertainty is estimated using inclusive W W bb events, generated using MadGraph at LO, which are compared with the sum of the t¯ t and W t processes. To account for the different orders in α
s, the number of events of the inclusive W W bb sample is scaled to the sum of the t t ¯ and W t events after an event selection requiring only E
missT
> 200 GeV, four jets and exactly one lepton. Uncertainties from the MC event generator, the hadronisation and fragmentation modelling, and the amount of initial- and final-state radiation are calculated in the same way as for t t ¯ . Additionally, the uncertainty on the single-top cross-section is taken into account.
Since the diboson and t¯ t + V backgrounds are not normalised in control regions, the analysis is sensitive to their respective cross-section uncertainties. Additionally, the effects of varying the renormalisation, factorisation and resummation scales are taken into account. These uncertainties have a negligible impact on the final results.
The effect of PDF uncertainties on the acceptance for the signal and the t t ¯ background is included but found to be negligible.
7 Results
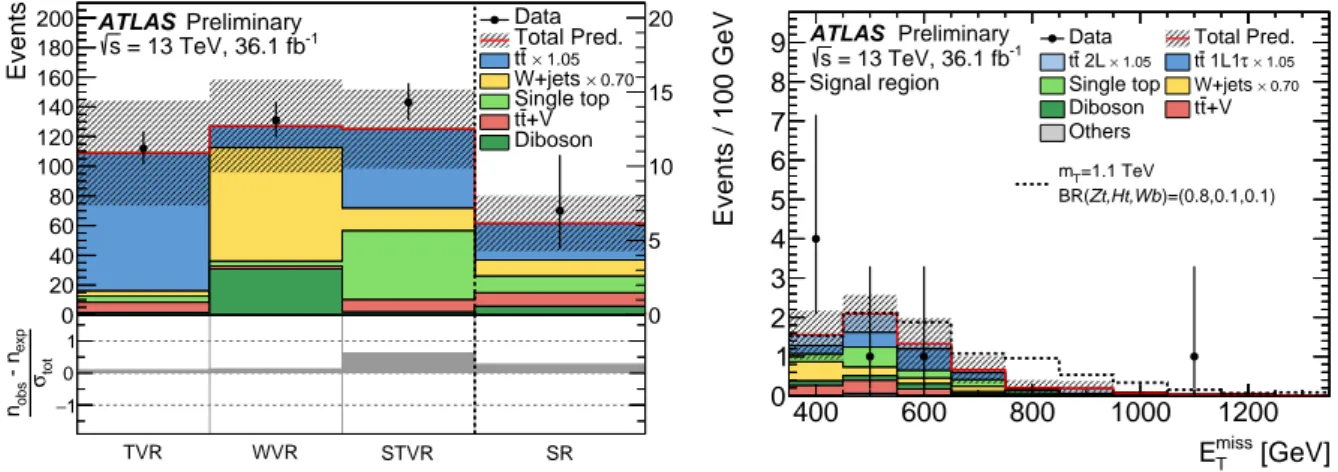
The number of events observed in data in the SR, CRs and the VRs is shown in table 3, together with the backgrounds estimated in the simultaneous fit. The results are also summarised in the left panel of figure 5. Good agreement of data and simulation is observed in the VRs. No significant excess above the SM background is found in the SR. The E
missT
distribution in the SR for data and SM expectation is shown in the right panel of figure 5. Here also a hypothetical signal for a T quark mass of 1 . 1 TeV is overlaid.
The largest signal contribution is expected at about half the T mass.
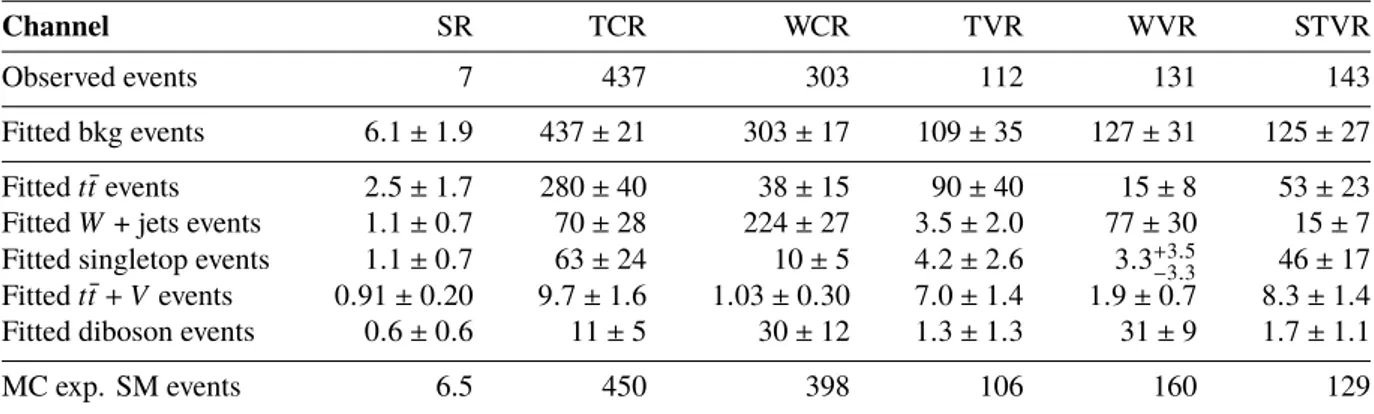
Table 3: Number of events observed in data in the signal, control and validation regions, together with the estimated SM backgrounds. The normalisation factors determined in the simultaneous fit are applied. The uncertainties include all statistical and systematic sources. Note that the individual uncertainties are correlated, and do not necessarily add up quadratically to the total background uncertainty.
Channel SR TCR WCR TVR WVR STVR
Observed events 7 437 303 112 131 143
Fitted bkg events 6 . 1 ± 1 . 9 437 ± 21 303 ± 17 109 ± 35 127 ± 31 125 ± 27 Fitted t t ¯ events 2 . 5 ± 1 . 7 280 ± 40 38 ± 15 90 ± 40 15 ± 8 53 ± 23 Fitted W + jets events 1 . 1 ± 0 . 7 70 ± 28 224 ± 27 3 . 5 ± 2 . 0 77 ± 30 15 ± 7 Fitted singletop events 1 . 1 ± 0 . 7 63 ± 24 10 ± 5 4 . 2 ± 2 . 6 3 . 3
+3.5−3.346 ± 17 Fitted t t ¯ + V events 0 . 91 ± 0 . 20 9 . 7 ± 1 . 6 1 . 03 ± 0 . 30 7 . 0 ± 1 . 4 1 . 9 ± 0 . 7 8 . 3 ± 1 . 4 Fitted diboson events 0 . 6 ± 0 . 6 11 ± 5 30 ± 12 1 . 3 ± 1 . 3 31 ± 9 1 . 7 ± 1 . 1
MC exp. SM events 6.5 450 398 106 160 129
Upper limits on the signal cross-section as a function of the VLT mass are derived at 95 % CL using profile-likelihood tests following the CL
sprescription [73]. They are calculated for the weak-isospin singlet and doublet models, which feature mass dependent branching ratios [4], as well as for pure T → Zt
12
TVR WVR STVR SR
totσ
exp - nobsn 1−
0 1
Events
0 20 40 60 80 100 120 140 160 180
200 Data
Total Pred.
1.05
× t t
0.70
× W+jets Single top
+V t t Diboson
0 5 10 15 ATLAS Preliminary 20
= 13 TeV, 36.1 fb-1
s
[GeV]
miss
E
T400 600 800 1000 1200
Events / 100 GeV
0 1 2 3 4 5 6 7 8
9
Data Total Pred.1.05
× 2L t
t tt 1L1τ× 1.05
Single top W+jets× 0.70
Diboson tt+V
Others
)=(0.8,0.1,0.1) Zt,Ht,Wb
BR(
=1.1 TeV mT
ATLAS Preliminary = 13 TeV, 36.1 fb-1
s
Signal region
Figure 5: Left panel: Comparison of the observed data (n
obs) with the predicted background (n
exp) in the VRs and SR. The bottom panel shows the significance of the difference between data and predicted background, where the significance is based on the total uncertainty ( σ
tot). Right panel: Comparison of data and prediction in the E
missT
distribution in the SR. The error bands include statistical and systematic uncertainties. The expected shape for a signal with m
T= 1 . 1 TeV and BR ( T → Zt ) = 80% is overlaid.
decays, using MC samples generated for 15 different VLT masses between 500 GeV and 1.4 TeV. The contribution from additional vector-like quarks, in particular from the X or B quark in the (X
5/3, T ) or (T, B) doublets, is neglected. This results in conservative limits in the case of the doublet model, where the X or B quarks are expected to always decay to a W t final state [9], leading to about 50% more events in the SR for the case of a T quark mass of 1 TeV and a second X or B quark with the same mass. The additional contribution in the TCR is less than 10%.
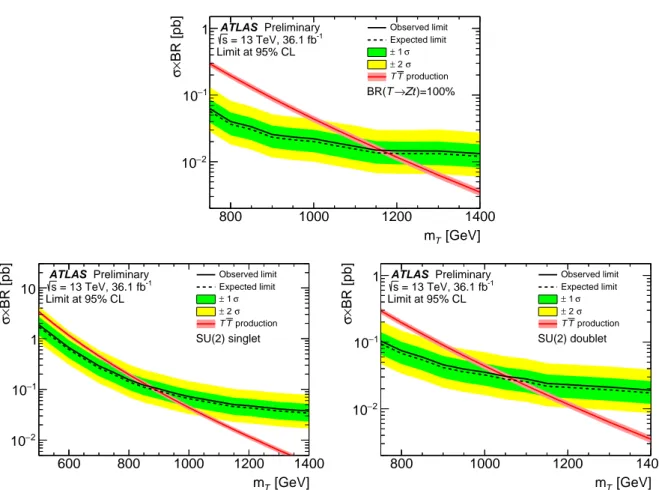
The cross-section times branching ratio limits as a function of mass are shown in figure 6 for the pure T → Zt decay, as well as for the singlet and doublet cases. Comparing the cross-section limits to the theoretical expectation, lower limits on the T quark mass can be derived. The limits are summarised in table 4. The sensitivity to the singlet model is lower due to the low BR ( T → Zt ), which approaches 25%
in the high-mass limit.
Table 4: Expected and observed 95 % CL lower mass limits for the pure T → Zt , the singlet model and the doublet model. Contributions from the X or B quark in the (X
5/3, T ) or (T, B) doublet models are neglected, leading to very conservative limits.
Signal obs. 95 % CL exp. 95 % CL lower mass limit lower mass limit
T → Zt 1.16 TeV 1.17 TeV
Singlet 0.87 TeV 0.89 TeV
Doublet 1.05 TeV 1.06 TeV
Figure 7 shows the 95 % CL observed and expected lower limits on the signal mass as a function of the decay branching ratios. As expected, the highest sensitivity is found in the region of BR (T → Zt) ' 100 %.
The sensitivity to the mixed Zt Ht decay mode is larger than to the ZtW b one. As an example, masses of m
T< 1 TeV can be excluded for BR (T → Ht ) < 65 % (70 % expected) in the former decay mode and for BR (T → W b) < 45 % (50 % expected) in the latter.
13
[GeV]
m
T800 1000 1200 1400
BR [pb] ×σ
−2
10
−1
10
1
Observed limitExpected limit σ
± 1 σ
± 2 production T T ATLAS Preliminary
= 13 TeV, 36.1 fb-1
s
Limit at 95% CL
)=100%
→Zt T BR(
[GeV]
m
T600 800 1000 1200 1400
BR [pb] ×σ
−2
10
−1
10 1 10
Observed limit Expected limit
σ
± 1 σ
± 2 production T T ATLAS Preliminary
= 13 TeV, 36.1 fb-1
s
Limit at 95% CL
SU(2) singlet
[GeV]
m
T800 1000 1200 1400
BR [pb] ×σ
−2
10
−1
10
1
Observed limitExpected limit σ
± 1 σ
± 2 production T T ATLAS Preliminary
= 13 TeV, 36.1 fb-1
s
Limit at 95% CL
SU(2) doublet
Figure 6: Expected and observed 95 % CL upper limit on the cross-section times branching ratio for VLQ T pair production as a function of the T mass for BR (T → Zt) = 100 % (top) and for branching ratios according to the singlet model (bottom left) and the doublet model (bottom right). Contributions from the X or B quark in the (X
5/3, T ) or (T, B) doublet models are neglected, leading to very conservative limits. The thickness of the theory curve represents the theoretical uncertainty from PDFs, scale and the strong coupling constant α
S.
→ Wb)
BR(T 0 0.10.2 0.3 0.4 0.5 0.6 0.7 0.8 0.9 1
Ht) → BR(T
0 0.1 0.2 0.3 0.4 0.5 0.6 0.7 0.8 0.9 1
Expected 95% CL mass limit [GeV]
500 600 700 800 900 1000 1100 1200
900800 1000 1100
SU(2) singlet SU(2) doublet ATLAS Preliminary
= 13 TeV, 36.1 fb-1
s
miss
Zt+X 1l+ET
→ Wb)
BR(T 0 0.10.2 0.3 0.4 0.5 0.6 0.7 0.8 0.9 1
Ht) → BR(T
0 0.1 0.2 0.3 0.4 0.5 0.6 0.7 0.8 0.9 1
Observed 95% CL mass limit [GeV]
500 600 700 800 900 1000 1100 1200
900800 1000 1100
SU(2) singlet SU(2) doublet ATLAS Preliminary
= 13 TeV, 36.1 fb-1
s
miss
Zt+X 1l+ET
Figure 7: Expected (left) and observed (right) 95 % CL lower limit on the VLQ T mass as a function of the decay branching ratios into W b and Ht . The markers indicate the branching ratios in the singlet and doublet models for masses above about 0.8 TeV, where they are approximately independent of the VLQ T mass.
14
8 Conclusion
A search for the pair production of vector-like top quarks in final states with exactly one lepton, at least four jets and high missing transverse momentum is presented. The search is based on 36.1 fb
−1of
√ s = 13 TeV LHC pp collision data recorded by ATLAS in 2015 and 2016. No significant excess above the SM background is observed in the signal region and 95 % CL limits are set on the vector-like top quark mass.
For the singlet and doublet models, masses below 870 GeV (890 GeV expected) and 1.05 TeV (1.06 TeV expected), respectively, are excluded. For the pure Zt decay, lower limits are set on the mass at 1.16 TeV (1.17 TeV expected). Limits are also set on the mass as a function of the decay branching ratios, excluding large parts of the parameter space for masses below 1 TeV.
15
Appendix
decay T T
WbWb HtHt ZtZt WbHt WbZt ZtHt
Event fraction
0 0.05 0.1 0.15 0.2 0.25 0.3 0.35
0.4
ATLAS Simulation Preliminary = 13 TeVs
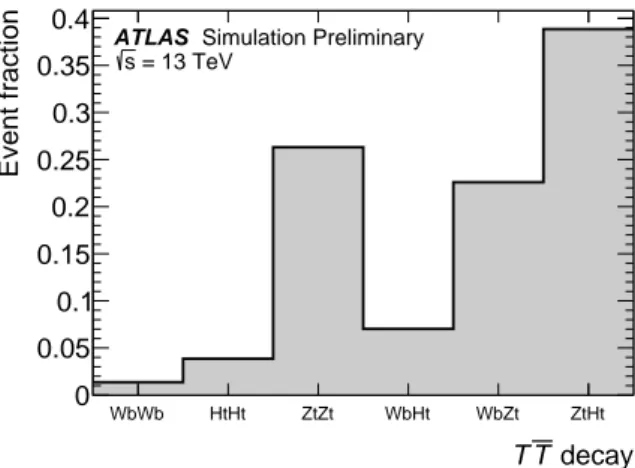
Figure 8: Relative fraction of events in the signal region for the different decay modes of a vector-like top pair with m
T= 1 TeV and equal decay branching ratios of BR (T → Zt ) = BR (T → Ht) = BR (T → W b) = 1 / 3.
16
[GeV]
am
T2100 150 200 250 300 350 400 450 500 550
Data / Pred.
0.5 1 1.5
[GeV]
amT2
Events / 25 GeV
0 200 400 600 800 1000 1200 1400 1600
1800 Data Total Pred.
τ 1L1 t
t tt 1L
Single top W+jets Others
ATLAS Preliminary = 13 TeV, 36.1 fb-1
s Preselection
[GeV]
τ
m
T20 20 40 60 80 100 120
Data / Pred.
0.5 1 1.5
[GeV]
τ
mT2
Events / 10 GeV
1 10 102
103
104
105 Data Total Pred.
τ 1L1 t
t tt 1L
Single top W+jets Others
ATLAS Preliminary = 13 TeV, 36.1 fb-1
s Preselection
miss T,sig
H
0 5 10 15 20 25 30 35
Data / Pred.
0.5 1 1.5
miss T,sig
H
Events
0 200 400 600 800
1000 Data Total Pred.
τ 1L1 t
t tt 1L
Single top W+jets Others
ATLAS Preliminary = 13 TeV, 36.1 fb-1
s Preselection
leading large-R jet mass [GeV]
50 100 150 200 250 300 350 400 450
Data / Pred.
0.5 1 1.5
leading large-R jet mass [GeV]
Events / 10 GeV
0 100 200 300 400 500 600
700 Data Total Pred.
τ 1L1 t
t tt 1L
Single top W+jets Others
ATLAS Preliminary = 13 TeV, 36.1 fb-1
s Preselection
Figure 9: Comparison of data and prediction in the distributions of the am
T2(top left), the m
τT2
(top right), the H
T,sigmiss(bottom left) and the mass of the leading large- R jet (bottom right) after preselection. The lower panels shows the ratio of the data to the prediction. The error bands include statistical and systematic uncertainties. The last bin contains the overflow.
17
[GeV]
W
m
T200 300 400 500 600
Events / 100 GeV
0 1 2 3 4 5 6 7 8
9
Data Total Pred.1.05
× 2L t
t tt 1L1τ× 1.05
Single top W+jets× 0.70
Diboson tt+V
Others
)=(0.8,0.1,0.1) Zt,Ht,Wb
BR(
=1.1 TeV mT
ATLAS Preliminary = 13 TeV, 36.1 fb-1
s
Signal region
b-jet multiplicity
1 2 3 4 5
Events
0 1 2 3 4 5 6 7 8
9
Data Total Pred.1.05
× 2L t
t tt 1L1τ× 1.05
Single top W+jets× 0.70
Diboson tt+V
Others
)=(0.8,0.1,0.1) Zt,Ht,Wb
BR(
=1.1 TeV mT
ATLAS Preliminary = 13 TeV, 36.1 fb-1
s
Signal region
Figure 10: Comparison of data and prediction in the distributions of the m
WT