A TLAS-CONF-2017-020 03 April 2017
ATLAS NOTE
ATLAS-CONF-2017-020
22nd March 2017
Search for a Scalar Partner of the Top Quark in the Jets + E miss
T
Final State at √
s = 13 TeV with the ATLAS detector
The ATLAS Collaboration
Abstract
A search for direct pair production of a scalar partner to the top quark in events with four or more jets plus missing transverse momentum is presented. An analysis of 36 fb
−1of
√ s = 13 TeV proton–proton collisions collected using the ATLAS detector at the LHC yielded no significant excess over the Standard Model background expectation. To interpret the results a supersymmetric model is used where the top squark is assumed to decay via t ˜ → t
(∗)χ ˜
01
, where ˜ χ
01
denotes the lightest neutralino. Exclusion limits are placed in terms of the top squark and neutralino masses. Assuming branching fractions of 100% to t χ ˜
01
, top squark masses in the range 450 − 950 GeV are excluded for ˜ χ
01
masses below 160 GeV. In the case where m
t˜∼ m
t+ m
χ˜0
top squark masses between 235 − 590 GeV are excluded.
© 2017 CERN for the benefit of the ATLAS Collaboration.
Reproduction of this article or parts of it is allowed as specified in the CC-BY-4.0 license.
1 Introduction
Supersymmetry (SUSY) [1–6] is an extension of the Standard Model (SM) that can resolve for example the gauge hierarchy problem [7–10] by introducing supersymmetric partners of the known bosons and fermions. The SUSY partner to the top quark, the top squark1 (˜ t ), plays an important role in canceling potentially large top-quark loop corrections in the Higgs-boson mass.
In R -parity conserving SUSY models [11], the supersymmetric partners are produced in pairs. Top squarks are produced by strong interactions through quark-antiquark ( q q ¯ ) annihilation or gluon-gluon fusion, and the production cross section of direct top squark pairs is largely decoupled from the specific choice of SUSY model parameters [12–15]. The decay of the top squark depends on the masses, the mixing of the superpartners of left- and right-handed top quarks, and the mixing parameters of the fermionic partners of the electroweak and Higgs bosons, which are collectively known as charginos, ˜ χ
±i, i = 1 , 2, and neutralinos, ˜ χ
0i, i = 1 , ..., 4, where ˜ χ
01
is the lightest supersymmetric particle (LSP) and χ ˜
02
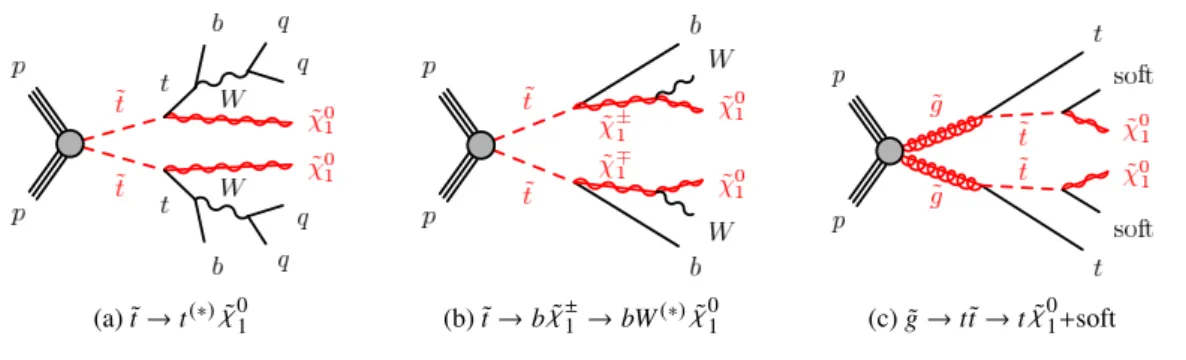
is the next lightest supersymmetric particle (NLSP). Two different decay scenarios are considered in this search: (a) both top squarks decay via ˜ t → t
(∗)χ ˜
01
and (b) at least one of the top squarks decay via ˜ t → b χ ˜
±1
→ bW
(∗)χ ˜
01
, with various hypotheses for m
χ˜0
and m
χ˜±1
, as illustrated in Fig. 1(a) − (b), respectively. The lightest neutralino, ˜ χ
01
, is stable and a dark matter candidate [16, 17]. Interpretations for scenario (a) are provided in this note using simplified models where only one decay step is allowed. A grid of signal samples are generated across the plane of the top squark and ˜ χ
01
masses with a grid spacing of 50 GeV across most of the plane assuming the chirality of the top squark resulting from maximal mixing between left and right-handed top squarks.
In addition to direct pair production, top squarks can be produced indirectly through gluino decays, as shown in Fig. 1(c). This search considers models where the mass difference between the top squark and the neutralino is small, i.e., ∆m( t, ˜ χ ˜
01
) = 5 GeV. In this scenario, the jets originating from the ˜ t decays have low momenta compared to experimental acceptance resulting in a nearly identical signature to ˜ t → t χ ˜
01
signal models.
(a) ˜
t→t(∗)χ˜
01
(b) ˜
t→bχ˜
±1 →bW(∗)χ
˜
01
(c) ˜
g→t˜t→tχ˜
01+soft
Figure 1: The decay topologies of the signal models considered with experimental signatures of four or more jets plus missing transverse momentum.
This note presents a search for top-squark pair production using a time-integrated luminosity of
R L dt = (36 . 1 ± 1 . 2) fb
−1of pp collisions data provided by the Large Hadron Collider (LHC) at a center-of-mass
1
The superpartners of the left- and right- handed top quarks, ˜
tLand ˜
tR, mix to form the two mass eigenstates ˜
t1and ˜
t2, where
t˜
1is the lighter one. Throughout this note ˜
t1is noted as ˜
t.
energy of
√ s = 13 TeV. The data were collected by the ATLAS detector in 2015 and 2016. All-hadronic final states with at least four jets and large missing transverse momentum ( p
missT
, whose magnitude is referred to as E
missT
) are considered, and the results are interpreted according to a variety of signal models as described above. Signal regions are defined to maximize the experimental sensitivity over a large range of kinematic phase space. Sensitivity to high top-squark masses ∼ 1000 GeV (as in Fig. 1(a)) and top squarks produced through gluino decays (as in Fig. 1(c)) are achieved by exploiting techniques designed to reconstruct top quarks that are Lorentz-boosted in the lab frame. The dominant SM background process for this kinematic region is Z → ν ν ¯ produced in association with jets initiated by heavy-flavor quarks.
Sensitivity to the region where m
t˜− m
χ˜0 1
∼ m
t, which typically has relatively low- p
Tfinal state objects and low E
missT
, is achieved by exploiting events in which high- p
Tjets from initial-state radiation (ISR) boosts the di-top-squark system in the transverse plane. For this regime, t¯ t production makes up the dominant background contribution. Similar searches based on
√ s = 8 TeV and
√ s = 13 TeV data collected at the LHC have been performed by both the ATLAS [18, 19] and CMS [20–24] collaborations.
2 ATLAS detector
The ATLAS experiment [25] at the LHC is a multi-purpose particle detector with a cylindrical forward- backward symmetric geometry2 and an approximate 4 π coverage in solid angle. It consists of an inner tracking detector surrounded by a thin superconducting solenoid providing a 2 T axial magnetic field, electromagnetic and hadron calorimeters, and a muon spectrometer. The inner tracking detector covers the pseudorapidity range |η | < 2 . 5. It consists of silicon pixel, silicon micro-strip, and transition radiation tracking detectors. The newly installed innermost layer of pixel sensors [26] was operational for the first time during the 2015 data taking. Lead/liquid-argon (LAr) sampling calorimeters provide electromagnetic (EM) energy measurements with high granularity. A hadron (steel/scintillator-tile) calorimeter covers the central pseudorapidity range ( |η | < 1 . 7). The end-cap and forward regions are instrumented with LAr calorimeters for both EM and hadronic energy measurements up to |η | = 4 . 9. The muon spectrometer surrounds the calorimeters and is based on three large air-core toroid superconducting magnets with eight coils each. The average toroid field strength is approximately 0.5 T in the central region and 1 T in the end-cap regions. It includes a system of precision tracking chambers and fast detectors for triggering.
3 Trigger and data collection
The data were collected from August to November 2015 and April to October 2016 at a pp centre-of-mass energy of 13 TeV with 25 ns bunch spacing. A two-level trigger system [27] is used to select events. The first-level trigger is implemented in hardware and uses a subset of the detector information to reduce the accepted rate to at most 100 kHz. This is followed by a software-based trigger that reduces the accepted event rate to 1 kHz for offline storage.
2
ATLAS uses a right-handed coordinate system with its origin at the nominal interaction point (IP) in the centre of the detector and the
z-axis along the beam pipe. The
x-axis points from the IP to the centre of the LHC ring, and the
y-axis points upwards. Cylindrical coordinates
(r, φ)are used in the transverse plane,
φbeing the azimuthal angle around the
z-axis.
The pseudorapidity is defined in terms of the polar angle
θas
η =−ln tan
(θ/2
). Angular distance is measured in units of
∆R≡ q
(∆η)2+(∆φ)2
.
In all search regions, a missing transverse momentum trigger, which is fully efficient for offline calibrated E
missT
> 250 GeV in signal events, was used to collect data events. The luminosity uncertainty of 2 . 1%
(3 . 4%) for data taken in 2015 (2016) is derived following the same methodology as that detailed in Refs. [28], from a preliminary calibration of the luminosity scale obtained from beam-separation scans performed in August 2015 (May 2016).
Data samples enriched in the major sources of background were collected with electron or muon triggers.
The electron trigger selects events based on the presence of clusters of energy in the electromagnetic calorimeter, with a shower shape consistent with that expected for an electron, and a matching track in the tracking system. The muon trigger selects events containing one or more muon candidates based on tracks identified in the muon spectrometer and inner detector. The electron and muon triggers used are
> 99% efficient for isolated electrons and muons with p
Tof 28 GeVand above.
Triggers based on the presence of high- p
Tjets are used to collect data samples for the estimation of the multijet and all-hadronic t¯ t background. The jet p
Tthresholds ranged from 20 to 400 GeV. In order to stay within the bandwidth limits of the trigger system, only a fraction of events passing these triggers were recorded to permanent storage.
4 Simulated event samples and signal modelling
Simulated events are used to model the SUSY signal and to aid in the description of the background processes. Signal models are all generated with MG5_aMC@NLO [29] interfaced to PYTHIA8 [30] for the parton showering (PS) and hadronisation and with EvtGen v1.2.0 program [31] as an afterburner for b -hadron decays. The matrix element (ME) calculation is performed at tree-level and includes the emission of up to two additional partons for all signal samples. The parton distribution function (PDF) set used for the generation of the signal samples is NNPDF2.3LO [32] with A14 set [33] for the underlying-event and shower parameters (UE tune). The ME-PS matching is performed with the CKKW-L [34] prescription, with a matching scale set to one quarter of the mass of the ˜ t , or ˜ g for the gluino pair production model.
Signal cross sections are calculated to next-to-leading order in the strong coupling constant, adding the resummation of soft-gluon emission at next-to-leading-logarithmic accuracy (NLO+NLL) [12–14]. The nominal cross section and the uncertainty are taken from an envelope of cross-section predictions using different PDF sets and factorization and renormalization scales, as described in Ref. [15].
SM background samples are generated with different MC generators depending on the process. The background sources of Z + jets and W + jets events are generated with SHERPAv2.2.1 [35] using the NNPDF3.0NNLO [32] PDF set and the UE tune provided by SHERPA. Top-quark pair production where at least one of the top quarks decays to a lepton and single-top production are simulated with Powheg- Boxv.2 [36] and interfaced to PYTHIA6 [37] for PS and hadronisation, with the CT10 [38] PDF set and using the Perugia2012 [39] set of tuned parameters. MG5_aMC@NLO interfaced to PYTHIA8 for PS and hadronisation is used to generate the t¯ t +V (where V is W or Z ) and t¯ t + γ samples at NLO with the NNPDF3.0NLO PDF set. The underlying-event tune used is A14 with the NNPDF2.3LO PDF set.
Diboson production is generated with SHERPAv2.2.1 using the CT10 PDF set. Finally, V γ processes are generated with SHERPAv2.1 using the CT10 PDF set. Additional information can be found in Refs. [40–
44].
The detector simulation [45] is performed using either GEANT4 [46] or a fast simulation framework
where the showers in the electromagnetic and hadronic calorimeters are simulated with a parameterized
description [47] and the rest of the detector is simulated with GEANT4. The fast simulation was validated against full GEANT4 simulation for several selected signal samples and subsequently used for all signal samples due to the large number of signal grid points needed for various interpretations. All standard model background samples used the GEANT4 setup. All MC samples are produced with a varying number of simulated minimum-bias interactions overlaid on the hard-scattering event to account for multiple pp interactions in the same or nearby bunch crossing (pileup). These events are produced using PYTHIA8 with the A2 tune [48] and MSTW 2008 PDF set [49]. The simulated events are reweighted to match the distribution of number of interaction in data. Corrections are applied to the simulated events to correct for differences between data and simulation for the lepton-trigger and reconstruction efficiencies, momentum scale, energy resolution, isolation, and for the efficiency of identifying jets containing b -hadrons, together with the probability for mis-tagging jets containing light-flavor and charm hadrons.
5 Event and physics object reconstruction
Events are required to have a primary vertex [50] reconstructed from at least two associated tracks with p
T> 400 MeV. Among the vertices found, the vertex with the largest summed p
2T
of the associated tracks is chosen.
Jets are reconstructed from three-dimensional topological clusters of noise-suppressed calorimeter cells [51]
using the anti- k
tjet algorithm [52, 53] with a distance parameter R = 0 . 4. An area-based correction is applied to account for energy from additional pp collisions based on an estimate of the pileup activity in a given event [54]. Calibrated [55] jet candidates are required to have p
T> 20 GeV and |η | < 2 . 8.
Events containing jets arising from non-collision sources or detector noise [56] are removed. Additional selections are applied to jets with p
T< 60 GeV and |η | < 2 . 4 to reject events that originate from pileup interactions [57].
Jets containing b -hadrons (“b-jets”) and which are within the inner detector acceptance ( |η | < 2 . 5) are identified ( b -tagged) with a multivariate algorithm that exploits the impact parameters of the charged- particle tracks, the presence of secondary vertices and the reconstructed flight paths of b - and c -hadrons inside the jet [58–60]. The output of the multivariate algorithm is a single b -tagging weight which signifies the likelihood of a jet containing b -hadrons. The average identification efficiency of jets containing b - hadrons is 77% as measured with simulated t¯ t events. A rejection factor of approximately 134 is reached for light-quark and gluon jets and 6.2 for charm jets (depending on the p
Tof the jet).
Electron candidates are reconstructed from energy clusters in the electromagnetic calorimeter that are matched to a track in the inner detector. They are required to have |η | < 2 . 47, p
T> 7 GeV and must pass a variant of the “very loose” likelihood-based selection [61]. The electromagnetic shower of an electron can also form a jet such that a procedure is required to resolve this ambiguity. In the case where the separation between an electron candidate and a non- b -tagged ( b -tagged) jet is ∆R < 0 . 23, the object is considered to be an electron ( b -tagged jet). If the separation between an electron candidate and any jet satisfies 0 . 2 < ∆R < 0 . 4, the object is considered to be a jet, and the electron candidate is removed.
Muons are reconstructed from matching tracks in the inner detector and in the muon spectrometer and are required to have |η | < 2 . 7, p
T> 6 GeV. If the separation between a muon and any jet is ∆R < 0 . 4, the muon is omitted.
3
For the overlap removal, rapidity is used instead of pseudorapidity in the
∆Rdefinition.
The p
missT
is the negative vector sum of the p
Tof all selected and calibrated physics objects in the event.
An extra term is added to account for small energy depositions in the event that are not associated to any of the selected objects. This “soft” term is calculated from inner detector tracks with p
T> 400 MeV matched to the primary vertex, to make it resilient to pileup contamination, not associated with physics objects [62]. The missing transverse momentum from the tracking system (denoted as p
miss,trackT
, with
magnitude E
miss,trackT
) is computed from the vector sum of the reconstructed inner detector tracks with p
T> 500 MeV, |η | < 2 . 5, that are associated with the primary vertex in the event.
The requirements on electrons and muons are tightened for the selection of events in background control regions (described in section 7) containing leptons. Electron and muon candidates are required to have p
T> 20 GeV ( p
T> 28 GeV) for regions using the E
missT
(lepton) triggers and to satisfy p
T-dependent track- and calorimeter-based isolation criteria. Electron candidates are required to pass a “tight” likelihood-based selection. The impact parameter of the electron in the transverse plane with respect to the reconstructed event primary vertex ( | d
0| ) is required to be less than five times the impact parameter uncertainty ( σ
d0).
The impact parameter along the beam direction, | z
0× sin θ | , is required to be less than 0 . 5 mm. Further selection criteria on reconstructed muons are also imposed: muon candidates are required to pass a
“medium" quality selection [63]. In addition, the requirements |d
0| < 3 σ
d0and | z
0× sin θ | < 0 . 5 mm are imposed for muon candidates.
6 Signal region definitions
The main experimental signature for all signal topologies is the presence of multiple jets (two of which contain b -hadrons), no muons or electrons, and significant missing transverse momentum.
Five sets of signal regions (SRA-E) are defined to target each topology and kinematic regime. SRA (SRB) is sensitive to production of high-mass ˜ t pairs with large (intermediate) ∆m( t, ˜ χ ˜
01
) . Both SRA and SRB employ top-mass reconstruction techniques to reject background. SRC is designed for the highly compressed region with ∆m(˜ t, χ ˜
01
) ∼ m
t. In this signal region, initial-state radiation (ISR) is used to improve sensitivity to these decays. SRD is targeted at ˜ t → b χ ˜
±1
decays, where no top-quark candidates are reconstructed. SRE is optimized for scenarios with highly-boosted top quarks that can occur in gluino-mediated top-squark production.
A common preselection is defined for all signal regions. At least four jets are required, at least one of which must be b -tagged. The leading four jets (ordered in p
T) must satisfy p
0T
, p
1T
, p
2T
, p
3T
> 80 , 80 , 40 , 40 GeV due to the tendency for signal events to have more energetic jets than background. Events containing reconstructed electrons or muons are vetoed. The E
missT
trigger threshold motivates the requirement E
missT
> 250 GeV and rejects the majority of background from multijet and all-hadronic t¯ t events. In order to reject events with mis-measured E
missT
originating from multijet and hadronic t¯ t decays, an angular separation between the azimuthal angle of the two highest- p
Tjets and the E
missT
is required:
∆φ
jet
0,1, p
missT
> 0 . 4. Further reduction of such events is achieved by requiring the E
miss,trackT
to be
aligned in φ with respect to the E
missT
calculated from the calorimeter system: E
miss,trackT
> 30 GeV and
∆φ p
missT
, p
miss,trackT
< π/ 3 radians.
Events / 20 GeV
0 1000 2000 3000
Data SM Total
t t Single Top
+V t t W Z Diboson
)=(600,300) GeV 1 0 χ∼ 1,
~t 20 x (
)=(1000,1) GeV 1 0 χ∼ 1,
~t 100 x (
ATLAS Preliminary
=13 TeV, 36.1 fb-1
s
>50 GeV
,min b
mT
preselection +
[GeV]
0
=1.2 jet, R
m
0 100 200 300 400
Data / SM
0.0 0.5 1.0 1.5 2.0
(a)
Events / 50 GeV
0 2000 4000
6000 Data
SM Total t t Single Top
+V t t W Z Diboson
)=(600,300) GeV 1 0 χ∼ 1,
~t 20 x (
)=(1000,1) GeV 1 0 χ∼ 1,
~t 100 x (
ATLAS Preliminary
=13 TeV, 36.1 fb-1
s
>50 GeV
,min b
mT
preselection +
[GeV]
,min b
mT
0 200 400 600
Data / SM
0.0 0.5 1.0 1.5 2.0
(b) Figure 2: Distributions of the discriminating variables (a) m
0jet,R=1.2and (b) m
b,minT
after the common preselection and an additional m
b,minT
> 50 GeV requirement. The stacked histograms show the SM expectation before being normalized using scale factors derived from the simultaneous fit to all backgrounds. The “Data/SM" plots show the ratio of data events to the total SM expectation. The hatched uncertainty band around the SM expectation and in the ratio plots illustrates the combination of statistical and detector-related systematic uncertainties. The rightmost bin includes all overflows.
Signal Regions A and B
SRA and SRB are targeted at direct top-squark pair production where the top squarks decay via ˜ t → t χ ˜
01
with ∆m( t, ˜ χ ˜
01
) > m
t. SRA is optimized for m
t˜= 1000 GeV , m
χ˜0
= 1 GeV while SRB is optimized for m
t˜= 600 GeV , m
χ˜0
= 300 GeV. Two b -tagged jets ( N
b−jet) are required and an additional requirement on the ∆ φ of the three leading jets and the E
missT
of
∆ φ
jet
0,1,2, p
missT
> 0 . 4 is made in SRA and SRB.
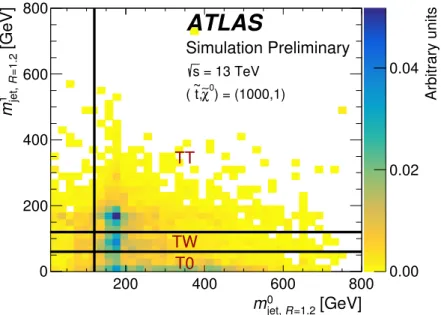
The decay products of the t t ¯ system in the all-hadronic decay mode can often be reconstructed as six distinct R = 0 . 4 jets. The transverse shape of these jets is typically circular with a radius equal to this distance parameter, but when two of the jets are less than 2 R apart in η − φ space, the one-to-one correspondence of a jet with a top daughter may no longer hold. Thus, the two hadronic top candidates are reconstructed by applying the anti- k
tclustering algorithm [52] to the R = 0 . 4 jets, using reclustered distance parameters of R = 0 . 8 and R = 1 . 2. Two R = 1 . 2 reclustered jets are required; the mass of the highest- p
TR = 1 . 2 reclustered jet is shown in Fig. 2 (a). The events are divided into three categories based on the resulting R = 1 . 2 reclustered jet masses ordered in p
T, as illustrated in Fig. 3: the “TT” category includes events with two top candidates i.e. with masses m
0jet,R=1.2
> 120 GeV and m
1jet,R=1.2
> 120 GeV, the “TW”
category contains events with one top candidate and a W candidate i.e. where m
0jet,R=1.2
> 120 GeV and 60 < m
1jet,R=1.2
< 120 GeV, and the “T0" category represents events with only one top candidate, i.e. where m
0jet,R=1.2
> 120 GeV and m
1jet,R=1.2
< 60 GeV. Since the signal-to-background ratio is quite different in each of these categories, they are optimized individually for both SRA and SRB.
The most powerful discriminating variable against SM t¯ t production is the E
missT
resulting from the undetected ˜ χ
01
s. Substantial t¯ t background rejection is provided by additional requirements to reject
[GeV]
0 R=1.2 jet,
m
200 400 600 800
[GeV]
1 =1.2Rjet,m
0 200 400 600 800
Arbitrary units
0.00 0.02 0.04
ATLAS
Simulation Preliminary
= 13 TeV s
) = (1000,1) χ0
,∼
~t (
TT
TW T0
Figure 3: Illustration of signal-region categories (TT, TW, and T0) based on the R = 1 . 2 reclustered top-candidate masses for simulated direct top-squark pair production with (m
t˜, m
χ˜0 1
) = ( 1000 , 1 ) GeV after the loose preselection requirement described in the text. The black lines represent the requirements on the reclustered jet masses.
events in which one W decays via a charged lepton plus neutrino. The first requirement is that the transverse mass ( m
T) calculated from the E
missT
and the b -tagged jet with minimum distance in φ to the p
missT
direction is above 200 GeV:
m
b,minT
= q
2 p
bT
E
missT
f
1 − cos ∆ φ p
bT
, p
missT
g > 200 GeV , (1)
which is bounded to be below the top quark mass, as illustrated in Fig. 2 (b). An additional requirement is made on the mass of the leading (in p
T) R =0.8 reclustered jet to be consistent with a W candidate:
m
0jet,R=0.8
> 60 GeV. Additionally, requirements on the stransverse mass ( m
χ2T2
) [64, 65] are made which are especially powerful in the T0 category where a χ
2method is applied to reconstruct top quarks with lower momenta where reclustering was suboptimal. The m
χ2T2
variable is constructed from the direction and magnitude of the E
missT
in the transverse plane as well as the direction of two top quark candidates reconstructed using a χ
2method. The minimization of the method is done in terms of χ
2=
(mcandm−mtrue)2true
, where m
candis the candidate mass and m
trueis set to 80.4 GeV for W candidates and 173.2 GeV for top candidates. Initially pairs of R = 0 . 4 jets form W candidates which are then used to construct top candidates using additional R = 0 . 4 jets in the event. The top candidates selected by the χ
2method are only used for the momenta in m
χ2T2
while the hypothesis masses for the top quarks and the invisible particles are set to 173.2 GeV and 0 GeV, respectively. Finally, a “ τ -veto” requirement is applied to reject hadronic τ -lepton candidates likely to have originated from a W → τν decay. Here, events that contain a non- b -tagged jet within |η | < 2 . 5 with fewer than four associated charged-particle tracks with p
T> 500 MeV, and where the ∆φ between the jet and the p
missT
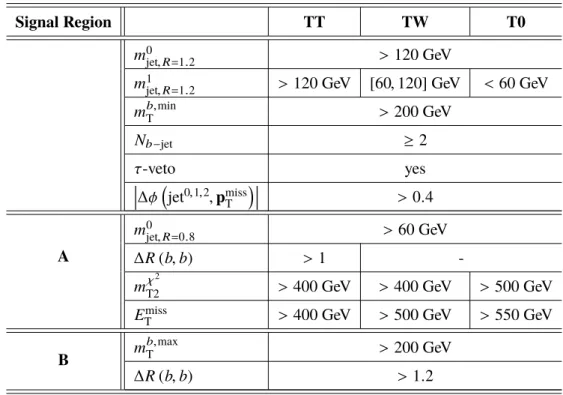
is less than π/ 5 radians, are vetoed. In SRB, additional discrimination is provided by m
b,maxT
and ∆R(b, b) . The former quantity is analogous to m
b,minT
except that the transverse mass is computed with the b -tagged jet that has the largest ∆φ with
respect to the p
missT
direction. The latter quantity provides additional discrimination against background where the two b -tagged jets come from a gluon splitting. Table 1 summarizes the selection criteria that are used in these two signal regions.
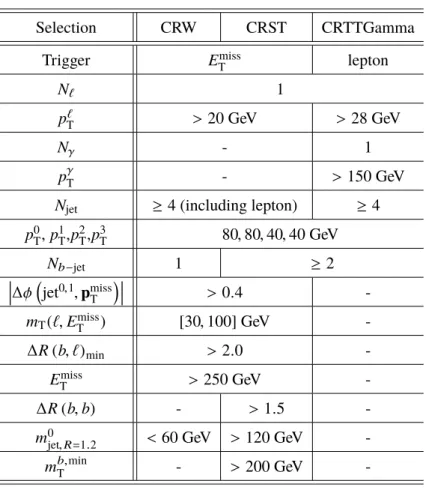
Table 1: Selection criteria for SRA and SRB, in addition to the common preselection requirements described in the text. The signal regions are separated into topological categories based on reconstructed top-candidate masses.
Signal Region TT TW T0
m
0jet,R=1.2
> 120 GeV
m
1jet,R=1.2> 120 GeV [60 , 120] GeV < 60 GeV m
b,minT
> 200 GeV
N
b−jet≥ 2
τ -veto yes
∆φ
jet
0,1,2, p
missT
> 0 . 4
A
m
0jet,R=0.8
> 60 GeV
∆R ( b, b) > 1 -
m
χ2T2
> 400 GeV > 400 GeV > 500 GeV E
missT
> 400 GeV > 500 GeV > 550 GeV B m
b,maxT
> 200 GeV
∆R ( b, b) > 1 . 2
Signal Regions C
SRC is optimized for direct top-squark pair production where ∆m( t, ˜ χ ˜
01
) ≈ m
t, a regime in which the signal topology is very similar to SM t¯ t production. In the presence of high-momentum ISR, which can be reconstructed as multiple jets and form an ISR system, the di-top-squark system is boosted in the transverse plane. The ratio of the E
missT
to the p
Tof the ISR system in the centre-of-mass (CM) frame ( p
ISRT
), defined as R
ISR, is proportional to the ratio of the ˜ χ
01
and ˜ t masses [66, 67]:
R
ISR≡ E
missT
p
ISRT
∼ m
χ˜01
m
˜t. (2)
A recursive jigsaw reconstruction technique, as described in Ref. [68], is used to divide each event into an ISR hemisphere and a sparticle hemisphere, where the latter consists of the pair of candidate top squarks, each of which decays via a top quark and a ˜ χ
01
. Objects are grouped together based on their proximity
in the lab frame’s transverse plane by minimizing the reconstructed transverse masses of the ISR system
and sparticle system simultaneously over all choices of object assignment. Kinematic variables are then
defined based on this assignment of objects to either the ISR system or the sparticle system. This method
is equivalent to dividing the event according to the axis of maximum back-to-back p
Tin the event’s CM frame where the total p
Tof all accepted objects sum to zero. In events with strong ISR, the axis of maximum back-to-back p
T, also known as the thrust axis, should approximate the direction of the ISR and sparticles’ back-to-back recoil.
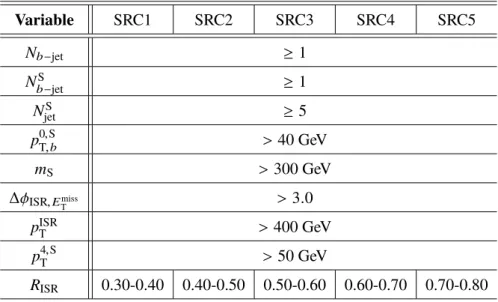
The selection criteria for this signal region are summarized in Table 2. The events are divided into five windows defined by non-overlapping ranges of the reconstructed R
ISR, and target different top squark and ˜ χ
01
masses: e.g., SRC2 is optimized for m
t˜= 300 GeV , m
χ˜0
= 127 GeV and SRC4 is optimized for m
t˜= 500 GeV , m
χ˜0
= 327 GeV. Five jets or more are required to be assigned to the sparticle hemisphere of the event ( N
Sjet
), and at least one of those jets ( N
b−Sjet
) must be b -tagged. Transverse-momentum requirements on p
ISRT
, the highest- p
Tb -jet in the sparticle hemisphere ( p
0,ST,b
), and the fourth-highest- p
Tjet in the sparticle hemisphere ( p
4,ST
) are applied. The transverse mass between the entire sparticle system (include the invisible part) and the E
missT
, defined as m
S, is required to be > 300 GeV. The ISR system is also required to be separated in azimuth from the E
missT
in the CM frame; this variable is defined as
∆φ
ISR,EmissT
.
Table 2: Selection criteria for SRC, in addition to the common preselection requirements described in the text. The signal regions are separated into windows based on ranges of R
ISR.
Variable SRC1 SRC2 SRC3 SRC4 SRC5
N
b−jet≥ 1
N
b−Sjet
≥ 1
N
Sjet
≥ 5
p
0,ST,b
> 40 GeV
m
S> 300 GeV
∆φ
ISR,EmissT
> 3 . 0
p
ISRT
> 400 GeV
p
4,ST
> 50 GeV
R
ISR0.30-0.40 0.40-0.50 0.50-0.60 0.60-0.70 0.70-0.80
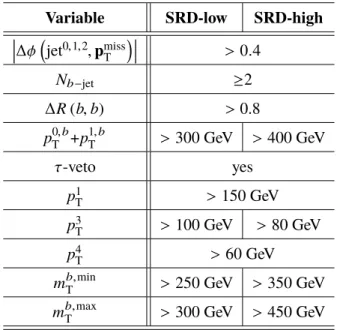
Signal Regions D
SRD is optimized for direct top-squark pair production where both top squarks decay via ˜ t → b χ ˜
±1
where m
χ˜±1
= 2 m
χ˜0
. In this signal region, at least five jets are required, two of which must be b -tagged. The sum of the p
Ts of the two jets with the highest b -tagging weight ( p
0,bT
+ p
1,bT
) as well as the second ( p
1T
), fourth ( p
3T
), and fifth ( p
4T
) jet p
Ts are used for additional background rejection. SRD-low and SRD-high are optimized for m
t˜= 400 GeV , m
χ˜0
= 50 GeV and m
˜t= 700 GeV , m
χ˜0
= 100 GeV, respectively. The models considered for the optimization have m( χ ˜
±1
) = 2 m( χ ˜
01
). Tighter leading and sub-leading jet p
Trequirements are made for SRD-high, as summarized in Table 3.
Table 3: Selection criteria for SRD, in addition to the common preselection requirements described in the text.
Variable SRD-low SRD-high
∆ φ
jet
0,1,2, p
missT
> 0 . 4
N
b−jet≥ 2
∆R (b, b) > 0.8 p
0,bT
+ p
1,bT
> 300 GeV > 400 GeV
τ -veto yes
p
1T
> 150 GeV
p
3T
> 100 GeV > 80 GeV p
4T
> 60 GeV
m
b,minT
> 250 GeV > 350 GeV m
b,maxT
> 300 GeV > 450 GeV
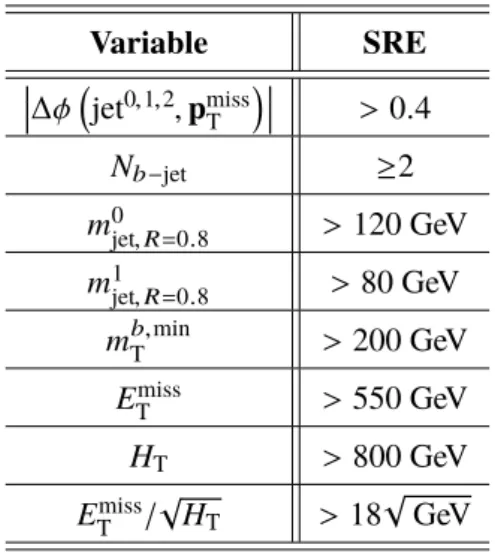
Signal Region E
SRE is designed for models which have highly-boosted top quarks. Such signatures can arise from direct pair production of high-mass top partners, or from the gluino-mediated compressed ˜ t scenario with large
∆m( g, ˜ t) ˜ . In this regime, reclustered jets with R = 0 . 8 are utilized to optimize experimental sensitivity to these highly-boosted top quarks. In this signal region, at least four jets are required, two of which must be b -tagged. Additional discrimination is provided by a measure of the E
missT
significance: E
missT
/ √ H
T, where H
Tis the scalar sum of the p
Tof all reconstructed R = 0 . 4 jets in an event. The selection criteria for SRE, optimized for m
g˜= 1700 GeV , m
t˜= 400 GeV , m
χ˜0
= 395 GeV, are summarized in Table 4.
7 Background estimation
The main SM background process in SRA, SRB, SRD, and SRE is Z → ν ν ¯ production in association with heavy flavor jets. The second most dominant background is t¯ t production where one W decays via a lepton and neutrino and the lepton (particularly a hadronically decaying τ lepton) is either not identified or is reconstructed as a jet. This process is the major background contribution in SRC and an important background in SRB, SRD and SRE as well. Other important background processes are W → `ν plus heavy flavor jets, single top and the irreducible background from t t ¯ + Z , where the Z decays to two neutrinos.
The main background contributions are estimated primarily from comparisons between data and simulation
outside the signal regions. Control regions (CRs) are designed to enhance a particular background process,
and are orthogonal to the SRs while probing a similar event topology. The CRs are used to normalize
the simulation to data, but extrapolation from the CR to the SR are taken from simulation. Sufficient
Table 4: Selection criteria for SRE in addition to the common preselection requirements described in the text.
Variable SRE
∆ φ
jet
0,1,2, p
missT
> 0 . 4 N
b−jet≥ 2 m
0jet,R=0.8
> 120 GeV m
1jet,R=0.8
> 80 GeV m
b,minT
> 200 GeV
E
missT
> 550 GeV
H
T> 800 GeV
E
missT
/ √
H
T> 18
√ GeV
data are needed to avoid large statistical uncertainties in the background estimates, and the CR definitions are chosen to be kinematically as close as possible to all SRs, to minimize the systematic uncertainties associated with extrapolating the background yield from the CR to the SR. Where CR definitions are farther from the SR definition, validation regions are employed to cross-check the extrapolation. In addition, control-region selection criteria are chosen to minimize potential contamination from signal that could shadow contributions in the signal regions. The signal contamination is below 8% in all CRs for all signal points that have not been excluded by previous ATLAS searches. As the CRs are not 100% pure in the process of interest, the cross-contamination between CRs from other processes is estimated. The normalization factors and the cross contamination are determined simultaneously for all regions using a fit described below.
Detailed CR definitions are given in Tables 5, 6, and 7 and are defined by the presence of one or more leptons that make them orthogonal with the signal regions. The
∆ φ
jet
0,1,2, p
missT
and m
T(`, E
missT
) requirements are designed to reduce contamination from SM multijet processes. The number of leptons is indicated by N
`and the transverse momentum of the lepton is indicated by p
`T
. In all one-lepton CRs, once the trigger and minimum p
`T
selection are applied, the lepton is treated as a non- b -tagged jet (to emulate the hadronic τ decays in the SRs) in the computation of all jet-related variables. In the two-lepton CRZs, a lepton- p
Trequirement of at least 28 GeV is made to be fully efficient for the trigger selection.
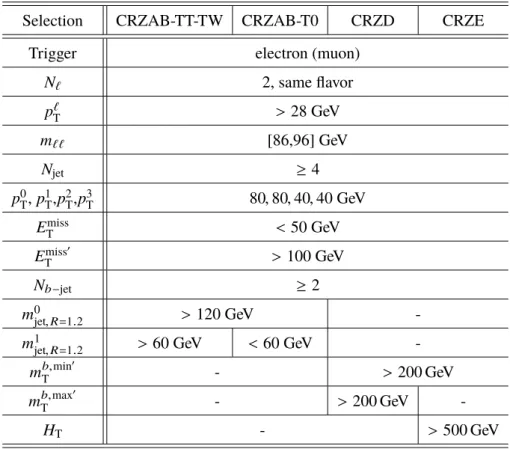
The invariant mass of the two oppositely-charged leptons, indicated by m
``, is selected to be consistent with the leptons having originated from a Z . The transverse momenta of these leptons are then vectorially added to the p
missT
to mimic the Z → ν ν ¯ decays in the SRs, forming the quantity E
miss0T
. Quantities that depend on the E
missT
are recalculated in the CRZs using E
miss0T
and identified by the addition of a prime (e.g.
m
b,min0T
and m
b,max0T
). Requirements such as the maximum m
T(`, E
missT
) and the minimum ∆R between the
two highest-weight b -tagged jets and the lepton, ∆R ( b, `)
min, are used to enforce orthogonality. In CRST,
the requirement on the ∆R between the two highest-weight b -tagged jets, ∆R (b, b), is used to reject t¯ t
contamination from the control region enriched in single-top events. Finally, the normalization of the
t t ¯ + W / Z background in the signal region, which is completely dominated by t t ¯ + Z (→ νν) , is estimated
with a t¯ t + γ control region (CRTTGamma). The same lepton triggers and lepton- p
Trequirements are
made as in the CRZs. Additionally, the presence of a photon with p
T> 150 GeV is required which is
used to model the Z decay in the signal regions due to the similarity between the diagrams for photons and Z production. Similar to the Z control region, the photon is used in the estimation of E
missT
related variables.
To estimate the Z + jets and t t ¯ background in the different kinematic regions of the signal regions, individual control regions are designed for all signal regions where possible. Only if the statistical power of control regions is low, are they merged to form one control region for multiple signal regions. In the case of CRST, CRW, and CRTTGamma this results in the use of one common CR for all signal regions.
Distributions from the Z + jets, t¯ t , W + jets, single top, and t¯ tγ control regions (CRZs, CRTs, CRST, CRW, and CRTTGamma, respectively) are shown in Figure 4.
Table 5: Selection criteria for the Z + jets control regions used to estimate the Z + jets background contributions in the signal regions.
Selection CRZAB-TT-TW CRZAB-T0 CRZD CRZE
Trigger electron (muon)
N
`2, same flavor
p
`T
> 28 GeV
m
``[86,96] GeV
N
jet≥ 4
p
0T
, p
1T
, p
2T
, p
3T
80 , 80 , 40 , 40 GeV
E
missT
< 50 GeV
E
miss0T
> 100 GeV
N
b−jet≥ 2
m
0jet,R=1.2
> 120 GeV -
m
1jet,R=1.2
> 60 GeV < 60 GeV - m
b,min0T
- > 200 GeV
m
b,max0T
- > 200 GeV -
H
T- > 500 GeV
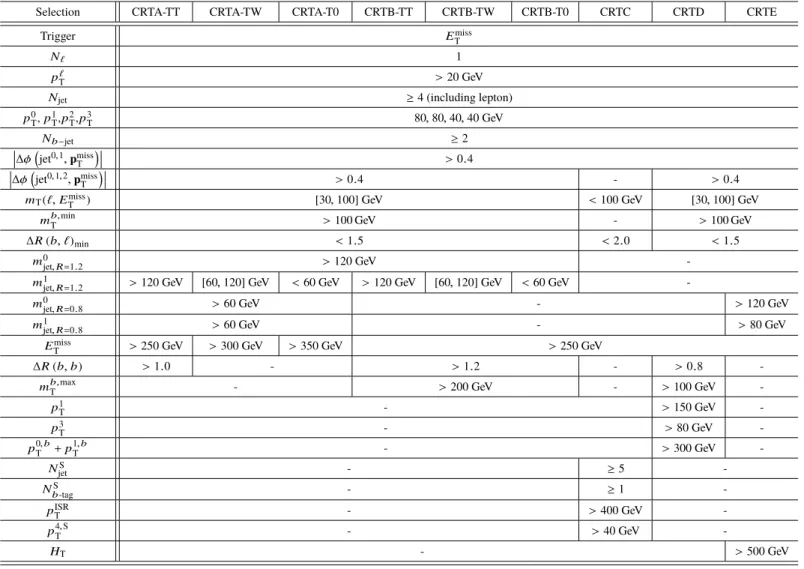
Table 6: Selection criteria for the t t ¯ control regions used to estimate the t t ¯ background contributions in the signal regions.
Selection CRTA-TT CRTA-TW CRTA-T0 CRTB-TT CRTB-TW CRTB-T0 CRTC CRTD CRTE
Trigger Emiss
T
N` 1
p`
T >20 GeV
Njet ≥4 (including lepton)
p0
T,p1T,p2T,p3
T 80,80,40,40 GeV
Nb−jet ≥2
∆φ
jet0,1,pmissT
>0.4
∆φ
jet0,1,2,pmissT
>0.4 - >0.4
mT(`,ETmiss) [30,100] GeV <100 GeV [30,100] GeV
mb,minT >100 GeV - >100 GeV
∆R(b, `)min <1.5 <2.0 <1.5
m0jet,R=1.2 >120 GeV -
m1jet,R=1.2 >120 GeV [60,120] GeV <60 GeV >120 GeV [60,120] GeV <60 GeV -
m0jet,R=0.8 >60 GeV - >120 GeV
m1jet,R=0.8 >60 GeV - >80 GeV
Emiss
T >250 GeV >300 GeV >350 GeV >250 GeV
∆R(b,b) >1.0 - >1.2 - >0.8 -
mb,max
T - >200 GeV - >100 GeV -
pT1 - >150 GeV -
pT3 - >80 GeV -
p0,bT +p1,bT - >300 GeV -
NjetS - ≥5 -
Nb-tagS - ≥1 -
pISRT - >400 GeV -
p4,S
T - >40 GeV -
HT - >500 GeV
14
Table 7: Selection criteria for the common W + jets, single-top, and t t ¯ + γ control-region definitions.
Selection CRW CRST CRTTGamma
Trigger E
missT
lepton
N
`1
p
`T
> 20 GeV > 28 GeV
N
γ- 1
p
γT
- > 150 GeV
N
jet≥ 4 (including lepton) ≥ 4 p
0T
, p
1T
, p
2T
, p
3T
80 , 80 , 40 , 40 GeV
N
b−jet1 ≥ 2
∆φ
jet
0,1, p
missT
> 0 . 4 -
m
T(`, E
missT
) [30 , 100] GeV -
∆R ( b, `)
min> 2 . 0 - E
missT
> 250 GeV -
∆R (b, b) - > 1 . 5 - m
0jet,R=1.2
< 60 GeV > 120 GeV - m
b,minT
- > 200 GeV -
Contributions from all-hadronic t¯ t and multijet production are found to be negligible. These are estimated from data using a procedure described in detail in Ref. [69]. The procedure determines the jet response from simulated dijet events, and then uses this response function to smear the jet response in low- E
missT
seed events. The jet response is cross-checked with data where the E
missT
can be unambiguously attributed to the mis-measurement of one of the jets. Diboson production, which is also sub-dominant, is estimated directly from simulation.
Simultaneous fit to determine SM background
The observed numbers of events in the various control regions are included in a profile likelihood fit [70] to
determine the SM background estimates in each signal region. A likelihood function is built as the product
of Poisson probability functions, describing the observed and expected number of events in the control
regions [71]. This procedure takes common systematic uncertainties (discussed in detail in Section 8)
between the control and signal regions and their correlations into account as they are treated as nuisance
parameters in the fit and are modelled by Gaussian probability density functions. The contributions
from all other background processes are fixed at the values expected from the simulation, using the most
accurate theoretical cross sections available, as described in Section 4, while their uncertainties are used
as nuisance parameters in the fit.
Events / 50 GeV
1 10 102
Data SM Total Z
t t +V t t Diboson ATLAS Preliminary
=13 TeV, 36.1 fb-1
s CRZAB_T0
[GeV]
’ χ2
mT2
200 400 600
Data / SM
0.0 0.5 1.0 1.5 2.0
(a)
Events / 50 GeV
1 10 102
Data SM Total Z
t t +V t t Diboson ATLAS Preliminary
=13 TeV, 36.1 fb-1
s CRZE
[GeV]
miss’
ET
0 200 400 600 800
Data / SM
0.0 0.5 1.0 1.5 2.0
(b)
Events / 0.05
0 50 100 150 200
Data SM Total
t t Single Top
+V t t W Z Diboson ATLAS Preliminary
=13 TeV, 36.1 fb-1
s CRTC
RISR
0 0.2 0.4 0.6 0.8 1
Data / SM
0.0 0.5 1.0 1.5 2.0
(c)
Events / 100 GeV
1 10 102
103 Data
SM Total W
t t Single Top
+V t t Z Diboson ATLAS Preliminary
=13 TeV, 36.1 fb-1
s CRW
[GeV]
,max b
mT
0 500 1000 1500
Data / SM
0.0 0.5 1.0 1.5 2.0
(d)
Events / 50 GeV
1 10 102
Data SM Total Single Top
t t +V t t W Z Diboson ATLAS Preliminary
=13 TeV, 36.1 fb-1
s CRST
[GeV]
1
pT
0 200 400 600
Data / SM
0.0 0.5 1.0 1.5 2.0
(e)
Events / 50 GeV
1 10 102
103
Data SM Total
+γ t t W V+γ t t Single Top
+V t t Z ATLAS Preliminary
=13 TeV, 36.1 fb-1
s CRTTGamma
[GeV]
γ
pT
200 400 600 800
Data / SM
0.0 0.5 1.0 1.5 2.0
(f) Figure 4: (a) m
χ2T2
distribution in CRZAB-T0, (b) E
miss0T
in CRZE , (c) the R
ISRdistribution in CRTC, (d) the m
b,maxT
distribution in CRW, (e) the transverse momentum of the second-leading- p
Tjet in CRST, and (f) the photon p
Tdistribution in CRTTGamma. The stacked histograms show the SM expectation, normalized using scale factors
derived from the simultaneous fit to all backgrounds. The “Data/SM" plots show the ratio of data events to the
total SM expectation. The hatched uncertainty band around the SM expectation and in the ratio plot illustrates
the combination of MC statistical and detector-related systematic uncertainties. The rightmost bin includes all
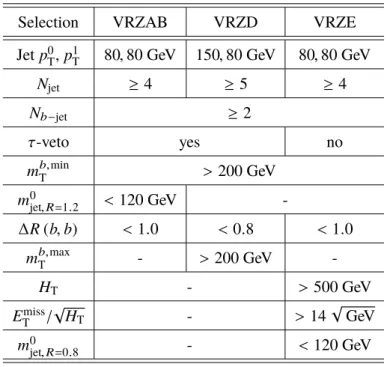
Zero lepton VRs (VRZAB, VRZD, VRZE) are designed to validate the background estimate for Z + jets in the signal regions. No VRZ is designed for SRC due to the negligible contribution of the Z background in this region. The definitions of the VRZs, after the common zero-lepton preselection discussed in Section 6 are applied, are shown in Table 8. To provide orthogonality to the signal regions, the requirement on one or more of the following variables is inverted: ∆R (b, b), m
0jet,R=1.2
, m
0jet,R=0.8
.
To validate the t¯ t background, zero-lepton VRs sharing the same common preselection of the signal regions and which are close to SRA and SRB definitions are designed for each of the categories (VRTA- TT, VRTA-TW, VRTA-T0, VRTB-TT, VRTB-TW, VRTB-T0). To avoid overlap with the signal regions the
m
b,minT
requirement is inverted in all validation regions. In VRTA, SRA requirements remain unchanged except for m
χ2T2
not being applied, 100 < m
b,minT
< 200 GeV, and the E
missT
requirement being reduced by 100 GeV. For VRTB, all requirements in the VRs are the same as in the SRs except for the m
b,minT
which
is 100 < m
b,minT
< 200 GeV for VRTB-TT, 140 < m
b,minT
< 200 GeV for VRTB-TW, and 160 < m
b,minT
<
200 GeV for VRTB-T0. For SRC, the same requirements are used when defining the validation region (VRTC) except for the looser requirements of m
S> 100 GeV, p
4,ST
> 40 GeV and N
Sjet
> 4. The ∆ φ
ISR,EmissTrequirement is inverted and m
V/m
S< 0 . 6, where m
Vis the transverse mass between the visible objects of the sparticle system and the E
missT
, is applied in addition to the existing selection. The validation region to validate the background estimates in SRD (VRTD) is formed by applying the following requirements:
100 < m
b,minT
< 200 GeV, p
0,bT
+ p
1,bT
> 300 GeV, p
3T
> 80 GeV, and m
b,maxT
> 300 GeV. All other requirements are applied exactly as in SRD-low except for the requirement on p
4T
which is dropped.
Finally, the validation region defined for SRE (VRTopE) applies only the same requirements on the number of b-jets, m
0jet,R=0.8
, and m
1jet,R=0.8
, inverting the m
b,minT
requirement to 100 < m
b,minT
< 200 GeV.
No other requirement is applied to VRTE.
One one-lepton validation region for the W + jets background (VRW) is used to test the W background estimates in all SRs. In this case the validation region is designed based on the definition of CRW.
Compared to CRW, the requirement that differs is ∆R( b
0,1, `)
minwhich is greater than 1.8 for the validation region. Two additional requirements are included in the definition of VRW, namely m
b,minT
> 150 GeV and m
0jet,R=1.2
< 70 GeV.
The result of the simultaneous fit procedure for each VR is shown in Figure 5 which displays good agreement between data and MC predictions.
8 Systematic uncertainties
Experimental and theoretical systematic uncertainties in the SM expectations and signal expectations are included in the profile likelihood fit described in Section 7.
The dominant uncertainty to all SRs except for SRB is the statistical uncertainty on the mean estimate of the total background contribution. The main sources of detector-related systematic uncertainties in the SM background estimates originate from the jet energy scale (JES) and jet energy resolution (JER), b -tagging efficiency, E
missT
soft term, and pileup. The effect of the JES and JER uncertainties on the background estimates in the signal regions reaches up to 16%. The uncertainty on the b -tagging efficiency is no more than 9%. All jet- and lepton-related uncertainties are propagated to the calculation of the E
missT
, and additional uncertainties on the energy and resolution of the soft term are also included. The uncertainty on the soft term of the E
missT
is most significant in SRA-T0 at 6%. An uncertainty due to the pileup modeling
Table 8: Selection criteria for the Z validation regions used to validate the Z background estimates in the signal regions.
Selection VRZAB VRZD VRZE
Jet p
0T
, p
1T
80 , 80 GeV 150 , 80 GeV 80 , 80 GeV
N
jet≥ 4 ≥ 5 ≥ 4
N
b−jet≥ 2
τ -veto yes no
m
b,minT
> 200 GeV
m
0jet,R=1.2
< 120 GeV -
∆R (b, b) < 1 . 0 < 0 . 8 < 1 . 0 m
b,maxT
- > 200 GeV -
H
T- > 500 GeV
E
missT
/ √
H
T- > 14
√ GeV m
0jet,R=0.8
- < 120 GeV
is also considered with a contribution up to 14%. Lepton reconstruction and identification uncertainties are also considered but have a small impact.
The preliminary uncertainty on the combined 2015+2016 integrated luminosity is 3.2%. It is derived, following a methodology similar to that detailed in Ref. [28], from a preliminary calibration of the luminosity scale using x-y beam-separation scans performed in August 2015 and May 2016.
Theoretical uncertainties in the modelling of the SM background are evaluated. For the W/Z + jets background processes, the modelling uncertainties are evaluated using SHERPA samples by varying the renormalization and factorization scales, and the merging and resummation scales. The resulting impact on the total background yields from the Z + jets theoretical uncertainties are up to 19% while the uncertainties due to W + jets variations are less than 5%.
For the t t ¯ background, uncertainties are evaluated due to the hard scattering generation, the choice of the parton-showering model (comparing Powheg-BoxPYTHIAvs. HERWIG++ and SHERPA) and the emission of additional partons in the initial and final states [42]. The ISR/FSR modeling of Powheg- BoxPYTHIA was compared to MG5_aMC@NLO and was found to agree within the total uncertainty. The largest impact of the t t ¯ theory systematics on the total background yields arises for SRC and is about 11- 71%. For the t¯ t + W/Z background, the theoretical uncertainty is estimated through variations including the choice of renormalization and factorization scales (each varied up and down by a factor of two), the choice of PDF, as well as a comparison between MC@NLO and OpenLoops+SHERPA generators, resulting in a maximum uncertainty of 6% in SRA-TT. The single-top background is dominated by the W t subprocess.
Uncertainties are evaluated for the choice of the parton-showering model (PYTHIA vs. HERWIG++)
and for the emission of additional partons in the initial- and final-state radiation. A 100% uncertainty is
Events
0 100 200 300
400 Data
SM Total Z
t t
+V t t W Single Top Diboson Multijets
ATLAS Preliminary
=13 TeV, 36.1 fb
-1s
VRTA-TTVRTA-TWVRTA-T0VRTB-TTVRTB-TWVRTB-T0VRTC VRTD VRTE VRW VRZABVRZD VRZE
Data / SM
0.0 0.5 1.0 1.5 2.0
Figure 5: Final yields for all validation regions after the likelihood fit. The stacked histograms show the SM expectation and the hatched uncertainty band around the SM expectation shows total uncertainty which consists of the MC statistical, detector-related systematic uncertainties, and theoretical uncertainties on the extrapolation from CR to VR.
applied to the single top background estimate to account for the effect of interference between single-top quark and t¯ t production. The final single top uncertainty relative to the total background estimate is up to 18%. The detector systematics are also applied to the signal samples used for interpretation. Theoretical uncertainties on the signal cross-section as described in Section 4 are treated separately and the limits are given for the ± 1 σ values as well as the central cross-section. The effect of the ISR/FSR modeling and the scale variations on the acceptance and efficiency are also taken into account when interpreting the results.
9 Results and interpretation
The observed event yields are compared to the total number of expected background events in Tables 9, 10, 11, and Figure 6. The total background estimate is determined from the simultaneous fit based on a procedure described in Section 7. Figure 7 shows the distribution of the E
missT
, m
χ2T2
, m
b,maxT