ATLAS-CONF-2019-041 10August2019
ATLAS CONF Note
ATLAS-CONF-2019-041
4th August 2019
Measurement of the t t ¯ production cross-section and lepton differential distributions in e µ dilepton events from p p
collisions at √
s = 13 TeV with the ATLAS detector
The ATLAS Collaboration
The inclusive top quark pair (tt¯) production cross-sectionσt¯t has been measured in proton–proton collisions at
√s=13 TeV, using 36.1 fb−1of data collected in 2015–16 by the ATLAS experiment at the LHC. Using events with an opposite-chargeeµpair and one or twob-tagged jets, the cross-section is measured to be:
σt¯t=826.4±3.6(stat) ±11.5(syst) ±15.7(lumi) ±1.9(beam)pb,
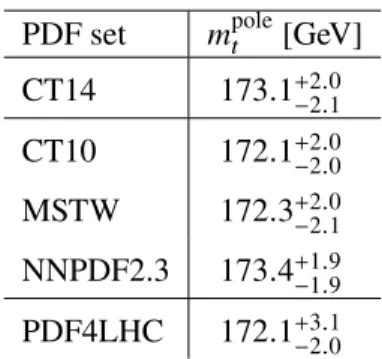
where the four uncertainties are due to data statistics, experimental and theoretical systematic effects, the integrated luminosity, and the LHC beam energy, giving a total uncertainty of 2.4 %. The result is consistent with state-of-the-art theoretical QCD calculations. It is used to determine the top quark pole mass via the dependence of the predicted cross-section onmpolet , giving a result of mtpole=173.1+2.0−2.1GeV. It is also combined with previous measurements at
√s=7 TeV and
√s=8 TeV to derive ratios and double ratios oftt¯andZcross-sections at different energies. The same event sample is also used to measure absolute and normalised differential cross-sections as functions of single lepton and dilepton kinematic variables, and the results are compared to the predictions of various Monte Carlo event generators.
© 2019 CERN for the benefit of the ATLAS Collaboration.
Reproduction of this article or parts of it is allowed as specified in the CC-BY-4.0 license.
1 Introduction
The study of top quark-antiquark (
tt¯ ) production forms a cornerstone of the physics programme of the ATLAS experiment at the CERN Large Hadron Collider (LHC), allowing quantum chromodynamics (QCD) to be probed at some of the highest accessible energy scales. The large mass of the top quark, close to the scale of electroweak symmetry breaking, gives it a unique role in the Standard Model of particle physics and potential extensions, and
t¯tproduction also forms an important background in many searches for physics beyond the Standard Model. Precise measurements of absolute rates and differential distributions in
tt¯ production are therefore a vital tool in fully exploiting the discovery potential of the LHC.
Predictions for the inclusive
t¯tproduction cross-section in
ppcollisions,
σtt¯, are available at next-to- next-to-leading-order (NNLO) accuracy in the strong coupling constant
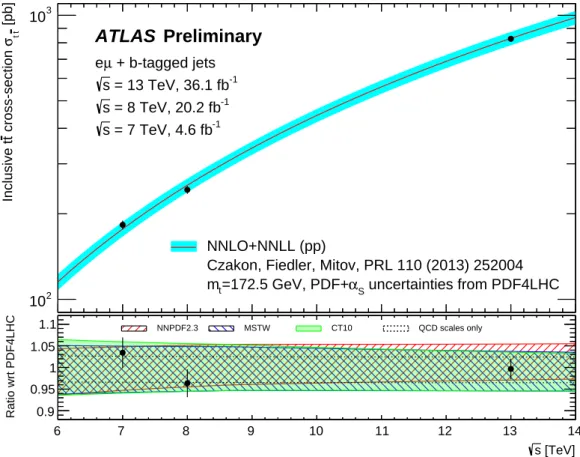
αS, including the resummation of next-to-next-to-leading logarithmic (NNLL) soft gluon terms [1–6], and are in excellent agreement with measurements from ATLAS and CMS at
√s=
7, 8 and 13 TeV [7–14]. At
√s =
13 TeV, and assuming a fixed top quark mass of
mt =172
.5 GeV, the NNLO+NNLL prediction is 832
±35
+20−29pb, as calculated using
top++ 2.0[15]. The first uncertainty corresponds to parton distribution function (PDF) and
αSuncertainties, and the second to QCD scale variations. The former were calculated using the PDF4LHC prescription [16] with the MSTW2008 [17, 18], CT10 NNLO [19, 20] and NNPDF2.3 5f FFN [21] PDF sets. The latter were calculated from the envelope of predictions with the QCD renormalisation and factorisation scales varied independently by factors of two up or down from their defaults of
µF = µR =mt, whilst never letting them differ by more than a factor of two. The total uncertainty corresponds to a relative precision of
+4−5..85%. As well as on choices of PDF,
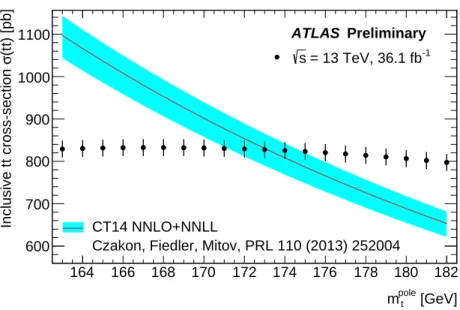
αSand QCD scales, the predicted cross-section also depends strongly on
mt, decreasing by 2.7 % for a 1 GeV increase in the top mass. The top quark mass parameter used in the cross-section prediction is actually the pole mass
mpolet, corresponding to the definition of the mass of a free particle. This allows
σtt¯measurements to be interpreted as measurements of
mpolet, free of the theoretical ambiguities linked to the direct reconstruction of
mtfrom the invariant mass of its decay products [22–25]. Ratios of
tt¯ production cross-sections at different centre-of-mass energies are also of interest, e.g.
Rt¯t13/7 =σtt¯(
13 TeV
)/σtt¯(7 TeV
). Predictions for such ratios benefit from significant cancellations in the QCD scale and top quark mass uncertainties, but are still sensitive to the choice of PDF. The NNLO+NNLL predictions with the same set of assumptions as given for
σt¯tabove, and a
±1 GeV uncertainty on
mt, are
Rtt¯13/7=
4
.69
±0
.16 and
Rtt¯13/8=
3
.28
±0
.08, i.e. relative uncertainties of 3.3 % and 2.5 %. Double ratios of
tt¯ to
Zproduction cross-sections allow the experimental uncertainties to be further reduced, by normalising the
t¯tcross-section at each energy to the corresponding cross-section for
Zboson production [26].
Within the Standard Model, the top quark decays 99.8 % of the time to a
Wboson and
b-quark [27], making the final state topologies in
t¯tproduction dependent on the decay modes of the
Wbosons. The channel with an electron–muon pair with opposite electric charges, i.e.
tt¯
→W+bW−b¯
→e+µ−ννb¯
b¯ , is particularly clean.1 It was exploited to make the most precise ATLAS measurements of
σtt¯at
√s=
7, 8 and 13 TeV [7, 8, 10], based on events with an opposite-sign
eµpair and one or two
b-tagged jets. The
√s =
13 TeV measurement in Ref. [10] was based on the 3.2 fb
−1dataset recorded in 2015. This paper describes a new measurement of
σtt¯at
√s =
13 TeV using the same final state, but applied to the combined 2015–16 ATLAS dataset of 36.1 fb
−1. The cross-section measurement is further used to determine the top quark pole mass via the dependence of the prediction on
mtpole, complementing the analogous measurement with the
√s =
7 and 8 TeV data [7]. This paper also updates the
tt¯ cross-section ratios
Rtt¯13/7
and
Rtt¯13/8
, and
1Charge-conjugate decay modes are implied unless otherwise stated.
double ratios of
t¯tto
Zcross-sections
Rt¯t/Z13/7
and
Rt¯t/Z13/8
, using the new
σtt¯result, superseding those derived from the previous
√s=
13 TeV
σt¯tmeasurement in Ref. [26].
The
eµ+ b-tagged jets sample also allows precise measurements of the differential distributions of the leptons produced in
t¯tevents to be made. ATLAS has previously published [28] measurements at
√s =
8 TeV of the absolute and normalised differential cross-sections as functions of the transverse momentum
p`T
and absolute pseudorapidity
|η`|of the single leptons2 (identical for electrons and muons), the
pT, invariant mass and absolute rapidity of the
eµsystem (
peµT
,
meµand
|yeµ|), the absolute azimuthal angle
|∆φ|between the two leptons in the transverse plane (
∆φeµ), and the scalar sums of the momenta (
peT+pµ
T
) and energies (
Ee+Eµ) of the two leptons. These distributions were found to be generally well described by predictions from a variety of leading order (LO) multileg and next-to-leading order (NLO)
t¯tmatrix-element event generators interfaced to parton showers, and by NLO fixed-order QCD calculations.
The sensitivity of the data to the gluon PDF and to the top quark pole mass was also demonstrated. This paper measures the same distributions at
√s =
13 TeV, using
t¯tsamples which are about six times the size of those available at
√s =
8 TeV. Two-dimensional distributions of
|η`|,
|yeµ|and
∆φeµas functions of
meµare also reported. The data are again compared to the predictions of various NLO
t¯tmatrix-element event generators, but the interpretations in terms of PDF constraints and
mpoletare left for future work.
The event selection, measurement methodology and uncertainty evaluations for both the inclusive
t¯tcross-section and the differential distributions are similar to those used at
√s =
7 and 8 TeV [7, 28], with the exception that the minimum lepton transverse momentum requirement has been lowered from 25 GeV to 20 GeV, whilst still requiring at least one lepton to be above the lepton trigger threshold of 21–27 GeV.
This increases the fraction of
tt¯
→eµννb¯
b¯ events that are selected by 16 %, thus reducing the extrapolation uncertainties in the modelling of
tt¯ production and decay. The data and Monte Carlo simulation samples used in the analyses are described in Section 2, followed by the event reconstruction and selection in Section 3. The measurement methodology for both the inclusive and differential cross-sections is described in Section 4, and the evaluation of systematic uncertainties in Section 5. The inclusive cross-section results are given in Section 6, together with the derivation of the top quark pole mass from
σtt¯, and the corresponding
t¯tand
t¯t/Zcross-section ratios. The differential cross-section results are discussed in Section 7, and compared with the predictions of several
t¯tevent generators. Finally, conclusions are given in Section 8.
2 Data and simulated event samples
The ATLAS detector [29–31] at the LHC covers nearly the entire solid angle around the collision point. It consists of an inner tracking detector surrounded by a thin superconducting solenoid magnet producing a 2T axial magnetic field, electromagnetic and hadronic calorimeters, and an external muon spectrometer incorporating three large toroidal magnet assemblies. The analysis was performed on samples of proton–
proton collision data collected at
√s =
13 TeV in 2015 and 2016, corresponding to total integrated luminosities of 3.2 fb
−1in 2015 and 32.9 fb
−1in 2016 after data quality requirements. Events were required to pass a single-electron or single-muon trigger, with transverse momentum thresholds that were
2 ATLAS uses a right-handed coordinate system with its origin at the nominal interaction point in the centre of the detector, and thezaxis along the beam line. Pseudorapidity is defined in terms of the polar angleθasη=−ln tanθ/2, and transverse momentum and energy are defined relative to the beam line aspT=psinθandET=Esinθ. The azimuthal angle around the beam line is denoted byφ, and distances in(η, φ)space by∆R=p
(∆η)2+(∆φ)2. The rapidity is defined asy=12ln E+p
z E−pz
, wherepzis thez-component of the momentum andEis the energy of the relevant object or system.
progressively raised during the data-taking as the instantaneous luminosity increased. The electron trigger was fully efficient for electrons with reconstructed
pT >25 GeV in 2015 and the first 6 fb
−1of 2016 data, and for
pT >27 GeV for the remainder. The corresponding muon trigger thresholds were
pT >21 GeV for 2015 data,
pT >25 GeV for the first 6 fb
−1and
pT>27 GeV for the rest of 2016 data. Each triggered event also includes the signals from on average 14 (25) additional inelastic
ppcollisions in 2015 (2016) data, referred to as pileup.
Monte Carlo simulated event samples were used to develop the analysis procedures, to evaluate signal and background contributions, and to compare with data. Samples were processed using either the full ATLAS detector simulation [32] based on GEANT4 [33], or with a faster simulation making use of parameterised showers in the calorimeters [34]. The effects of pileup were simulated by generating additional inelastic
ppcollisions with Pythia8 (v8.186) [35] using the A2 parameter set (tune) [36] and overlaying them on the primary simulated events. These combined events were then processed using the same reconstruction and analysis chain as the data. Small corrections were applied to lepton trigger and reconstruction efficiencies to improve the agreement with the response observed in data.
The baseline simulated
t¯tsample was produced using the NLO matrix-element event generator Powheg- Box v2 (referred to hereafter as Powheg) [37–40] with the NNPDF3.0 NLO PDF set [41], interfaced to Pythia8 with the NNPDF2.3 LO PDF set and the A14 tune [42] for the parton shower, hadronisation and underlying event modelling. In the Powheg configuration, the
hdampparameter, which gives a cut-off scale for the first gluon emission, was set to
32mt, and the factorisation and renormalisation scales were set to
µF = µR =q(mt2+pT(t)2)
, where the top quark
pTis evaluated before radiation [43].
Alternative
tt¯ simulation samples used to assess systematic uncertainties were generated with Powheg interfaced to Herwig7 [44] with the H7UE tune, and the MadGraph5_aMC@NLO generator (referred to hereafter as aMC@NLO) [45] with the renormalisation and factorisation scales set in the same way as for Powheg, interfaced to Pythia8 with the A14 tune. Uncertainties related to the amount of initial- and final-state radiation were explored using two alternative Powheg + Pythia8 samples: one with
hdampset to 3
mt,
µFand
µRreduced by a factor of two from their default values, and the A14v3cUp tune variation, giving more parton-shower radiation; and a second sample with
hdamp= 32mt,
µFand
µRincreased by a factor of two and the A14v3cDo tune variation, giving less parton-shower radiation [43]. The top quark mass was set to 172.5 GeV in all these samples, consistent with measurements from ATLAS [46] and CMS [47]. The
W→`νbranching ratio was set to the Standard Model prediction of 0.1082 per lepton flavour [48], and the EvtGen program [49] was used to handle the decays of
b- and
c-flavoured hadrons.
All the samples were normalised using the NNLO+NNLL inclusive cross-section prediction discussed in Section 1 when comparing simulation with data. Additional
t¯tsamples with different event generator configurations were used in comparisons with the measured normalised differential cross-sections as discussed in Section 7.2.
Backgrounds in these measurements are classified into two types: those with two real prompt leptons
(electrons or muons) from
Wor
Zboson decays (including those produced by leptonic decays of
τ-leptons),
and those where at least one of the reconstructed leptons is misidentified, i.e. a non-prompt lepton from the
decay of a bottom or charm hadron, an electron from a photon conversion, a hadronic jet misidentified as
an electron, or a muon produced from the decay in flight of a pion or kaon. The first background category
is dominated by the associated production of a
Wboson and single top quark,
Wt. This process was
simulated using Powheg v1 with the CT10 NLO PDF set [19], interfaced to Pythia6 [50] with the P2012
tune [51]. The ‘diagram removal’ scheme [52] was used to handle the interference between the
t¯tand
Wtfinal states that occurs at NLO. The sample was normalised to a cross-section of 71
.7
±3
.8 pb, based on the
approximate NNLO calculation [53, 54] using the MSTW2008 NNLO PDF set [17, 18], and taking into account both PDF and QCD scale uncertainties. Smaller backgrounds result from
Z →ττ(→eµ)+jets, and from diboson production (
WW,
W Zand
Z Z) in association with jets. These backgrounds were modelled using Sherpa 2.2.1 [55] (
Z+jets) and Sherpa 2.1.1 (dibosons), as discussed in detail in Ref.
[56]. Production of
tt¯ in association with a leptonically-decaying
W,
Zor Higgs boson gives a negligible contribution to the opposite-sign
eµsamples compared to inclusive
tt¯ production, but is significant in the same-sign control samples used to assess the background from misidentified leptons. These processes were simulated using aMC@NLO + Pythia8 (
tt¯
+W/Z) or Powheg + Pythia8 (
tt¯
+H) [56].
Backgrounds with one real and one misidentified lepton arise from
tt¯ events with one hadronically-decaying
W, simulated with Powheg + Pythia8 as for dileptonic
tt¯ ;
W+jets production, modelled with Sherpa 2.2.1 as for
Z+jets; and
t-channel single top-quark production, modelled with Powheg + Pythia6 with the CT10 PDF set and P2012 tune. The contributions of these backgrounds to the opposite-sign samples were determined with the help of the same-sign control samples in data. Other backgrounds, including processes with two misidentified leptons, are negligible after the event selections used in the analysis.
3 Event reconstruction and selection
The analysis makes use of reconstructed electrons, muons and
b-tagged jets. Electron candidates were reconstructed from a localised cluster of energy deposits in the electromagnetic calorimeter matched to a track in the inner detector, passing the ‘Tight’ likelihood-based requirement of Ref. [57]. They were required to have transverse energy
ET >20 GeV and pseudorapidity
|η| <2
.47, excluding the transition region between the barrel and endcap electromagnetic calorimeters, 1
.37
< |η| <1
.52. To ensure they originated from the event primary vertex, electrons were required to satisfy requirements on the transverse impact parameter significance calculated with respect to the beam line of
|d0|/σd0 <5, and on the longitudinal impact parameter calculated with respect to the event primary vertex of
|∆z0sin
θ| <0
.5 mm.
The event primary vertex was defined as the reconstructed vertex with the highest sum of
p2T
of associated tracks. To reduce background from non-prompt electrons, candidates were further required to be isolated, using
pT- and
|η|-dependent requirements on the summed calorimeter energy within a cone of size
∆R=
0
.2 around the electron cluster, and on the sum of track
pTwithin a variable-sized cone of radius
∆R =
min
(0
.2
,10 GeV
/pT(e))around the electron track direction. The selections were tuned to give a 90 % efficiency for electrons of
pT =25 GeV in simulated
Z →eeevents, rising to 99 % at 60 GeV.
Muon candidates were reconstructed by combining matching tracks reconstructed in the inner detector and muon spectrometer, and were required to have
pT >20 GeV,
|η| <2
.5 and to satisfy the ‘Medium’
requirements of Ref. [58]. Muons were also required to be isolated using calorimeter and track information in a similar way as for electrons, except that the track-based isolation was calculated with a cone of size
∆R=
min
(0
.3
,10 GeV
/pT(µ)). The selections were again tuned to give efficiencies varying from 90 % at
pT=25 GeV to 99 % at 60 GeV on simulated
Z →µµevents. No requirements were made on the muon impact parameters with respect to the primary vertex.
Jets were reconstructed using the anti-
ktalgorithm [59, 60] with radius parameter
R=0
.4, starting from
topological clusters in the calorimeters [61]. After calibration using information from both simulation and
data [62], jets were required to have
pT >25 GeV and
|η| <2
.5, and jets with
pT <60 GeV and
|η| <2
.4
were subject to additional pileup rejection criteria using the multivariate jet-vertex tagger (JVT) [63]. To
prevent double counting of electron energy deposits as jets, the closest jet to an electron candidate was
removed if it was within
∆Ry <0
.2 of the electron.3 Furthermore, to reduce the contribution of leptons from heavy-flavour hadron decays inside jets, leptons within
∆Ry <0
.4 of selected jets were discarded, unless the lepton was a muon and the jet had fewer than three associated tracks, in which case the jet was discarded (thus avoiding an efficiency loss for high-energy muons undergoing significant energy loss in the calorimeters).
Jets likely to contain
b-hadrons were
b-tagged using the MV2c10 algorithm [64], a multivariate discriminant making use of track impact parameters and reconstructed secondary vertices. A tagging working point corresponding to 70 % efficiency for tagging
b-quark jets from top quark decays in simulated
t¯tevents was used, corresponding to rejection factors of about 400 against light quark and gluon jets and 12 against jets originating from charm quarks.
Selected events were required to have exactly one electron and exactly one muon passing the requirements detailed above, with at least one of the leptons matched to a corresponding electron or muon trigger. Events where the electron and muon were separated in angle by
|∆θ|<0
.15 and
|∆φ| <0
.15, or where at least one jet with
pT>20 GeV failed quality requirements [65], were rejected. Events with an opposite-sign
eµpair formed the main analysis sample, whilst events with a same-sign
eµpair were used in the estimation of background from misidentified leptons.
4 Cross-section measurement
The same technique, employing the subsets of the opposite-sign
eµsample with exactly one and exactly two
b-tagged jets, was used to measure both the inclusive
tt¯ cross-section and the differential distributions. The measurements are introduced in the following two subsections, followed by a discussion of the background estimate in Section 4.3 and the validation of the differential measurements using studies based on simulation in Section 4.4.
4.1 Inclusive cross-sections
The inclusive
tt¯ cross-section
σtt¯was determined by counting the numbers of opposite-sign
eµevents with exactly one (
N1) and exactly two (
N2)
b-tagged jets. The two event counts satisfy the tagging equations:
N1 = Lσtt¯eµ
2
b(1
−Cbb)+Nbkg1 , N2 = Lσtt¯eµCbb2+Nbkg
2
(1) where
Lis the integrated luminosity of the sample,
eµthe efficiency for a
tt¯ event to pass the opposite-sign selection, and
Cbis a tagging correlation coefficient close to unity. The combined probability for a jet from the quark
qin the
t →W qdecay to fall within the acceptance of the detector, be reconstructed as a jet with transverse momentum above the selection threshold, and be tagged as a
b-jet, is denoted by
b. If the decays of the two top quarks and the reconstruction of the two associated
b-tagged jets are completely independent, the probability
bbto reconstruct and tag both
b-jets is given by
bb = b2. In practice, small correlations are present, and are taken into account via the correlation coefficient
Cb =bb/b2, or equivalently
Cb=4
Neµtt¯Ntt¯2 /(Ntt¯
1 +
2
Ntt¯2 )2
, where
Neµtt¯is the number of selected
eµtt¯ events and
Nt¯t1
and
Nt¯t2
are the numbers of such events with one and two
b-tagged jets. In the baseline
t¯tsimulation sample,
3∆Ry=p
(∆y)2+(∆φ)2is the angular distance in(y, φ)space.
eµ≈
0
.9 %, including the branching ratio for a
tt¯ pair to produce an
eµfinal state. The corresponding value of
Cbis 1
.007
±0
.001 (the uncertainty coming from the limited size of the simulation sample), indicating a small positive correlation between the reconstruction and
b-tagging of the two quarks produced in the top quark decays. Background from sources other than
t¯tevents with two prompt leptons also contributes to
N1and
N2and is given by the terms
Nbkg1
and
Nbkg2
, evaluated using a combination of simulation and data control samples as discussed in Section 4.3 below. The values of
eµand
Cbwere taken from
t¯tevent simulation, allowing the tagging equations Eqs. (1) to be solved to determine
σt¯tand
b.
The selection efficiency
eµcan be written as the product of two terms:
eµ = AeµGeµ. Here, the acceptance
Aeµ ≈1
.7 % represents the fraction of
t¯tevents which have a true opposite-sign
eµpair from
t →W → e/µdecays, with each lepton having
pT >20 GeV and
|η| <2
.5, and the contributions via leptonic
τdecays (
t →W →τ→e/µ) are included. The lepton four-momenta were taken after final-state radiation, and ‘dressed’ by including the four-momenta of any photons within a cone of size
∆R=0
.1 around the lepton direction, excluding photons produced from hadron decays or interactions with the detector material. The reconstruction efficiency
Geµrepresents the probability that the two leptons are reconstructed and pass all the identification and isolation requirements. A fiducial cross-section
σtfidt¯
, for the production of
t¯tevents with an electron and a muon satisfying the requirements on
pTand
η, can then be defined as
σtfidt¯ = Aeµσtt¯
, and measured by replacing
σtt¯eµwith
σtfidt¯Geµ
in Eqs. (1). The fiducial cross-section definition makes no requirements on the possible presence of jets, as the tagging formalism of Eqs. (1) allows the number of
t¯tevents with no reconstructed and
b-tagged jets to be inferred from the event counts
N1and
N2. Measurement of the fiducial cross-section avoids the systematic uncertainties associated with the evaluation of the acceptance, in particular estimation of the fraction of
t¯t→eµννb¯
b¯ events where at least one lepton has
pT <20 GeV or
|η| >2
.5.
A total of 399 344 data events passed the opposite-sign
eµselection in the combined 2015–16 data sample, and were subdivided according to the number of
b-tagged jets, irrespective of the number of untagged jets. The numbers of events with one and two
b-tagged jets selected in the separate 2015 and 2016 data samples are shown in Table 1, together with the expected non-
t¯tcontributions from
Wtand dibosons evaluated from simulation, and
Z(→ττ→eµ)+jets and misidentified leptons evaluated using both data and simulation. The one
b-tag sample is expected to be about 88 % pure and the two
b-tag sample 96 % pure in
tt¯ events, with the largest backgrounds coming from
Wtproduction. The distribution of the number of
b-tagged jets is shown in Figure 1(a), and compared to the expectations from simulation, broken down into contributions from
tt¯ events (modelled using the baseline Powheg + Pythia8 sample), and various background processes. The predictions using alternative
t¯tgenerator configurations (Powheg + Pythia8 with more or less parton-shower radiation, and aMC@NLO + Pythia8) are also shown. All expected contributions are normalised using the cross-sections discussed in Section 2 and the integrated luminosity of the data sample. The excess of data events over the prediction in the zero
b-tagged jets sample (which is not used in the measurement) was also seen previously [7, 10] and is compatible with the expected uncertainties in modelling diboson and
Z+jets production.
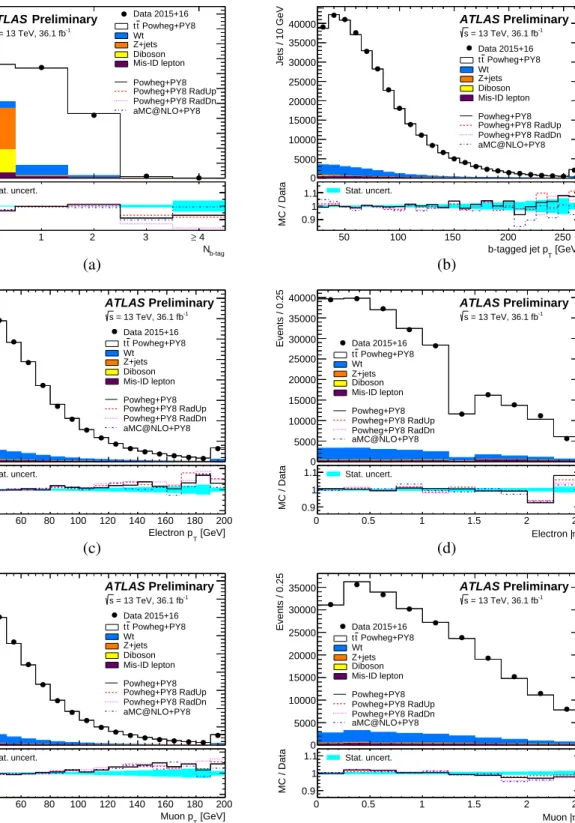
Figures 1(b)–(f) show distributions of the
pTof the
b-tagged jets, and the
pTand
|η|of the electron
and muon, in opposite-sign
eµevents with at least one
b-tagged jet, a sample which is dominated by
t¯tevents. The total simulation prediction is normalised to the same number of events as the data to
facilitate shape comparisons. The
|η|distributions for electrons and muons reflect the differences in
acceptance and efficiency, in particular the reduction in electron acceptance across the calorimeter transition
region. In general, the simulation predictions give a good description of the data, although the baseline
Powheg + Pythia8 simulation predicts a significantly harder lepton
pTdistribution than seen in data.
b-tag
N
0 2 4
Events
0 20 40 60 80 100 120 140 160 180 200 220
103
×
ATLAS Preliminary
= 13 TeV, 36.1 fb-1
s
Data 2015+16 Powheg+PY8 t
t Wt Z+jets Diboson Mis-ID lepton Powheg+PY8 Powheg+PY8 RadUp Powheg+PY8 RadDn aMC@NLO+PY8
b-tag
N
0 1 2 3 ≥ 4
MC / Data 0.8 1
1.2 Stat. uncert.
(a)
[GeV]
T
b-tagged jet p
50 100 150 200 250
Jets / 10 GeV
0 5000 10000 15000 20000 25000 30000 35000
40000 ATLAS Preliminary
= 13 TeV, 36.1 fb-1
s
Data 2015+16 Powheg+PY8 t
t Wt Z+jets Diboson Mis-ID lepton Powheg+PY8 Powheg+PY8 RadUp Powheg+PY8 RadDn aMC@NLO+PY8
[GeV]
b-tagged jet pT
50 100 150 200 250
MC / Data 0.9 1
1.1 Stat. uncert.
(b)
[GeV]
Electron pT
20 40 60 80 100 120 140 160 180 200
Events / 10 GeV
0 5000 10000 15000 20000 25000 30000 35000
40000 ATLAS Preliminary
= 13 TeV, 36.1 fb-1
s
Data 2015+16 Powheg+PY8 t
t Wt Z+jets Diboson Mis-ID lepton Powheg+PY8 Powheg+PY8 RadUp Powheg+PY8 RadDn aMC@NLO+PY8
[GeV]
Electron pT
20 40 60 80 100 120 140 160 180 200
MC / Data 0.8 1
1.2 Stat. uncert.
(c)
η| Electron |
0 0.5 1 1.5 2 2.5
Events / 0.25
0 5000 10000 15000 20000 25000 30000 35000
40000 ATLAS Preliminary
= 13 TeV, 36.1 fb-1
s Data 2015+16
Powheg+PY8 t
t Wt Z+jets Diboson Mis-ID lepton Powheg+PY8 Powheg+PY8 RadUp Powheg+PY8 RadDn aMC@NLO+PY8
η| Electron |
0 0.5 1 1.5 2 2.5
MC / Data 0.9 1
1.1 Stat. uncert.
(d)
[GeV]
T
Muon p
20 40 60 80 100 120 140 160 180 200
Events / 10 GeV
0 5000 10000 15000 20000 25000 30000 35000 40000
45000 ATLAS Preliminary
= 13 TeV, 36.1 fb-1
s
Data 2015+16 Powheg+PY8 t
t Wt Z+jets Diboson Mis-ID lepton Powheg+PY8 Powheg+PY8 RadUp Powheg+PY8 RadDn aMC@NLO+PY8
[GeV]
Muon pT
20 40 60 80 100 120 140 160 180 200
MC / Data 0.8 1
1.2 Stat. uncert.
(e)
η| Muon |
0 0.5 1 1.5 2 2.5
Events / 0.25
0 5000 10000 15000 20000 25000 30000
35000 ATLAS Preliminary
= 13 TeV, 36.1 fb-1
s Data 2015+16
Powheg+PY8 t
t Wt Z+jets Diboson Mis-ID lepton Powheg+PY8 Powheg+PY8 RadUp Powheg+PY8 RadDn aMC@NLO+PY8
η| Muon |
0 0.5 1 1.5 2 2.5
MC / Data 0.9 1
1.1 Stat. uncert.
(f)
Figure 1: Distributions of (a) the number ofb-tagged jets in selected opposite-signeµevents; and (b) the pTof b-tagged jets, (c) thepTof the electron, (d) the|η|of the electron, (e) thepTof the muon and (f) the|η|of the muon, in events with an opposite-signeµpair and at least oneb-tagged jet. The reconstruction-level data are compared to the expectation from simulation, broken down into contributions fromtt¯(Powheg + Pythia8),Wt,Z+jets, dibosons, and events with misidentified electrons or muons. The simulation prediction is normalised to the same integrated luminosity as the data in (a) and to the same number of entries as the data in (b–f). The lower parts of the figure show the ratios of simulation to data, using varioustt¯signal samples and with the cyan band indicating the data statistical uncertainty. The last bin includes the overflow in panels (b), (c) and (e).
Sample 2015 2016
Event counts
N1 N2 N1 N2Data 14239 8351 133977 75853
Wt
single top 1329
±92 261
±86 12490
±870 2430
±810
Z(→ττ→eµ)+jets 123
±15 7
±2 910
±110 37
±9
Diboson 42
±5 1
±0 481
±58 21
±7
Misidentified leptons 164
±54 58
±37 1720
±520 670
±390 Total background 1660
±110 327
±94 15600
±1000 3160
±890
Table 1: Observed numbers of opposite-signeµevents with one (N1) and two (N2)b-tagged jets in 2015 and 2016 data, together with the estimates of backgrounds and associated uncertainties described in Section5. Uncertainties shown as zero are less than 0.5 events.
The inclusive cross-section was determined separately from the 2015 and 2016 datasets, and the results were combined, taking into account correlations in the systematic uncertainties. As the systematic uncertainties are much larger than the statistical uncertainties, and not fully correlated between the two samples (true in particular for the uncertainty in the integrated luminosity), this procedure gives a smaller overall uncertainty than treating the 2015–16 data as a single sample. The selection efficiency
eµis about 10 % lower in the 2016 data with respect to the 2015 data, due to the lower lepton identification efficiencies necessitated by the higher pileup conditions, and the higher-
pTtrigger thresholds.
4.2 Differential cross-sections
The differential cross-sections as functions of the lepton and dilepton variables defined in Section 1 were measured using an extension of Eqs. (1), by counting the number of leptons or events with one (
Ni1
) or two (
Ni2
)
b-tagged jets where the lepton(s) fall in bin
iof a differential distribution at reconstruction level. For the single-lepton distributions
p`T
and
|η`|, there are two counts per event, in the two bins corresponding to the electron and muon. For the dilepton distributions, each event contributes a single count corresponding to the bin in which the appropriate dilepton variable falls. For each bin of each differential distribution, these counts satisfy the tagging equations:
Ni
1 = Lσt¯it Gieµ
2
bi(1
−Cbibi)+Ni,bkg1 ,
Ni
2 = Lσt¯it GieµCib(bi)2+Ni,bkg
2 ,
(2)
where
σtit¯
is the absolute fiducial differential cross-section in bin
i. The reconstruction efficiency
Gieµrepresents the ratio of the number of reconstructed
eµevents (or leptons for
p`T
and
|η`|) in bin
idefined using the reconstructed lepton(s), to the number of true
eµevents (or leptons) in the same bin
iat particle level, evaluated using
t¯tsimulation. The true electron and muon were required to have
pT >20 GeV and
|η| <
2
.5, but no requirements were made on reconstructed or particle-level jets. The efficiency
Gieµcorrects for both the lepton reconstruction efficiency and for the effects of event migration, where events in bin
jat particle level appear in a different bin
i, jat reconstruction level. The integral of any dilepton differential cross-section is equal to the fiducial cross-section
σtfidt¯
defined in Section 4.1, and the integrals of the single-lepton
p`T
and
|η`|distributions are equal to 2
σtfidt¯
. The correlation coefficient
Cbidepends on
the event counts in bin
ianalogously to the inclusive
Cbappearing in Eqs. (1). The values of
Gieµwere
taken from
t¯tsimulation, and are generally around 0.5–0.6. The corresponding values of
Cbiare always
within 1–2 % of unity, even at the edges of the differential distribution. The background term
Ni,bkgvaries
from 11–23 % of the total event count
Ni1
in each bin, and
Ni,bkg2
varies from 3–14 % of
Ni2
. They were determined from simulation and data control samples, allowing the tagging equations Eqs. (2) to be solved and the absolute fiducial differential cross-sections
σt¯itto be determined for each bin
iof each differential distribution.
The bin ranges for each differential distribution were based on those used at
√s =
8 TeV [28], adding an additional bin for 20–25 GeV in the
p`T
distribution and extending the lowest bin down to 40 GeV for
peT+pµ
T
and
Ee+Eµto accommodate the reduced minimum lepton
pTrequirement of 20 GeV. The number and sizes of bins were chosen according to the experimental resolution in order to keep the bin purities (i.e the fractions of events reconstructed in bin
ithat originate from bin
iat particle level) above about 0.9, and to keep a maximum of around ten bins for the angular distributions (
|η`|,
|yeµ|and
∆φeµ).
The variations in the angular distributions predicted by different
t¯tmodels do not motivate a finer binning, even though the experimental resolution would allow it. The chosen bin ranges can be seen in Tables 13–16 in the Appendix. The last bin of the
p`T
,
peµT
,
meµ,
peT+pµ
T
and
Ee+Eµdistributions includes overflow events falling above the last bin boundary.
The normalised fiducial differential cross-sections
ςtit¯
were calculated from the absolute cross-sections
σtit¯
as follows:
ςti
t¯= σti
t¯
Σjσtj
t¯
= σt¯it σtfid
t¯
,
(3)
where
σtfidt¯
is the cross-section summed over all bins of the fiducial region, equal to the fiducial cross-section defined in Section 4.1. The
ςtit¯
values were then divided by the bin widths
Wi, to produce the cross-sections differential in the variable
x(
x = p`T
,
|η`|, etc.):
1
σd
σd
xi
= ςt¯it
Wi .
(4)
The normalised differential cross-sections are correlated between bins because of the normalisation condition in Eq. (3). The absolute dilepton differential cross-sections are not statistically correlated between bins, but kinematic correlations between the electron and muon within one event introduce small correlations within the absolute single lepton
p`T
and
|η`|distributions.
The larger number of selected
tt¯ events compared to the
√s =
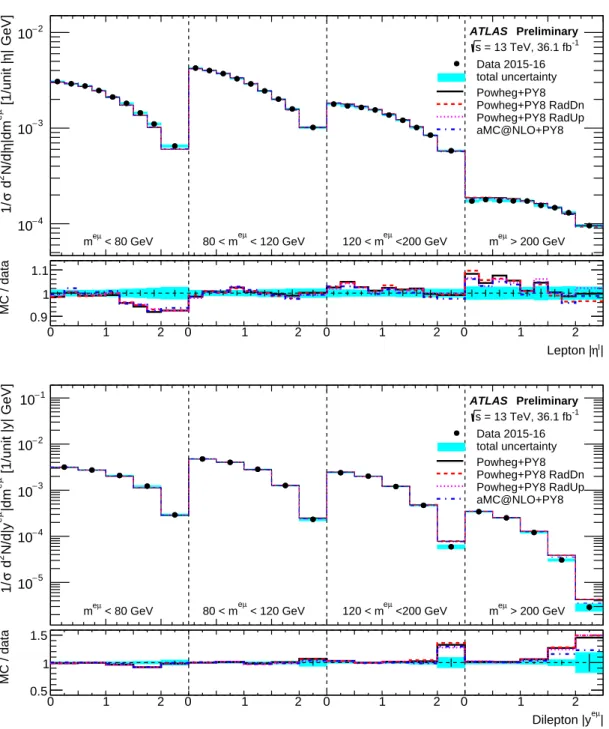
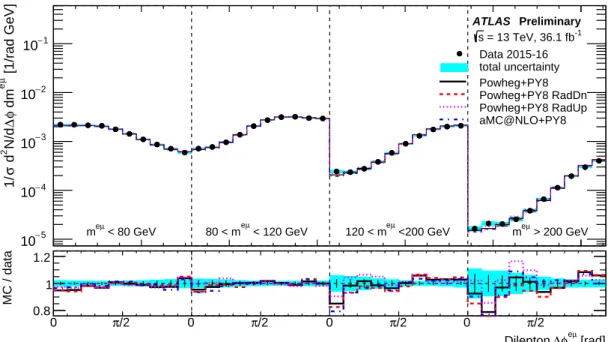
8 TeV analysis allows double-differential cross-sections to be measured, i.e. distributions as functions of two variables simultaneously. Three such distributions were measured, with
|η`|,
|yeµ|or
∆φeµas the first variable, and
meµas the second variable, effectively measuring the
|η`|,
|yeµ|and
∆φeµdistributions in four bins of
meµ, chosen to be
meµ <80 GeV, 80
<meµ <120 GeV, 120
< meµ <200 GeV and
meµ >200 GeV. The excellent resolution in
|η`|,
|yeµ|and
∆φeµresults in migration effects being significant only between
meµbins. The formalism of Eqs. (2) was used, with the index
irunning over the two-dimensional grid of bins in both variables. The normalised double-differential cross-sections were calculated with the sum in the denominator of Eq. (3) running over all bins, making the integral of the normalised double-differential cross-section equal to unity over the entire fiducial region, rather than normalising e.g. the
|η`|distribution to unity in each
meµbin separately.
The measured differential cross-sections include contributions where one or both leptons are produced via leptonic decays of
τ-leptons (
t→W →τ→e/µ). To enable comparisons with theoretical predictions which only include direct
t→W →e/µdecays, a second set of cross-section results were derived with a bin-by-bin multiplicative correction
fino−τ
to remove the
τcontributions:
σti
t¯(
no–
τ)= fino−τσti
t¯,
(5)
and similarly for the normalised cross-sections
ςtit¯(
no-
τ). The corrections
fnoi−τwere evaluated from the baseline Powheg + Pythia8
t¯tsimulation as the fractions of leptons or events in each particle-level bin which do not involve
τ-lepton decays. They are typically in the range 0.8–0.9, the smaller values occurring in bins with a large contribution of low-
pTleptons where the
τcontributions are largest.
Since the uncertainties in most of the differential cross-section bins are dominated by the limited data statistics, and the luminosity uncertainty largely cancels out in the normalised differential cross-sections, the 2015–16 data were treated as a single sample in the differential analysis. The varying lepton trigger thresholds and offline identification efficiencies were taken into account by calculating
Gieµfrom an appropriately-weighted mixture of simulated events. Figure 2 shows the reconstructed dilepton distributions for events with at least one
b-tagged jet, comparing data to predictions using various
tt¯ generator configurations. As in Figure 1(b)–(f), the predictions generally describe the data well, though in some regions there are significant differences between the data and all predictions, which are discussed further in Section 7.2 below.
4.3 Background estimates
The dominant background from
Wtproduction, and the smaller contribution from diboson events (dominated by
WWproduction) were evaluated from simulation, using the samples detailed in Section 2.
The production of a
Zboson accompanied by heavy-flavour jets is subject to large theoretical uncertainties, so the background contributions in the one and two
b-tag samples predicted by Sherpa (normalised to the inclusive
Zcross-section predictions from FEWZ [66]) were further scaled by factors of 1
.10
±0
.12 (one
btag) and 1
.20
±0
.12 (two
b-tags) obtained from data. These scale factors were derived from the ratio of data to simulation event yields for
Z →ee/µµaccompanied by one or by two
b-tagged jets. The
Z →ee/µµyields were obtained by requiring two opposite-sign electrons or muons passing the selections detailed in Section 3, and performing a template fit to the dilepton invariant mass distribution in the range 30
<m`` <150 GeV in order to subtract the contributions from
t¯tevents and misidentified leptons. The uncertainties are dominated by variations in the scale factors as a function of
Zboson
pT. A further uncertainty of 5 % in the one
b-tag and 23 % in the two
b-tag sample was assigned from the change in final background prediction when replacing the Sherpa sample with one generated using MadGraph [67] interfaced to Pythia8, including re-evaluation of the scale factors. Similar procedures were used to evaluate the uncertainty on the
Z+jets background prediction in every bin of the differential distributions, including a comparison of the per-bin predictions from Sherpa and Madgraph after normalising each sample to data in the inclusive
Z →ee/µµcontrol regions.
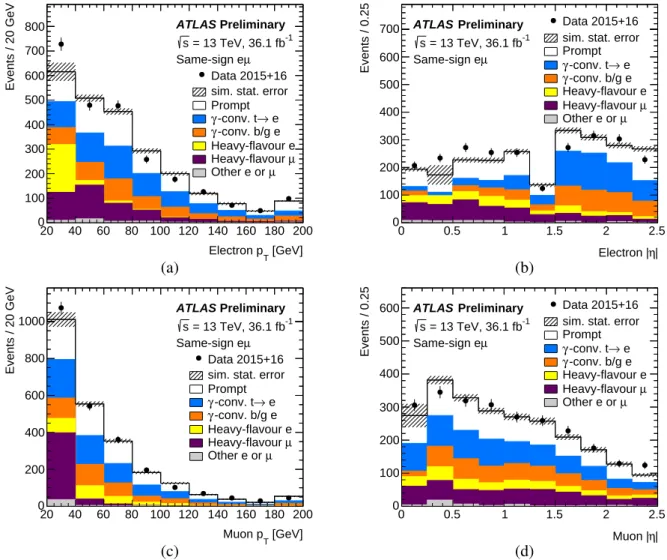
The background from events with one real and one misidentified lepton was evaluated with the help of the same-sign
eµcontrol sample. For the inclusive cross-section analysis, the contributions
Nmisj −idto the total numbers
Njof opposite-sign
eµevents with
j=1
,2
b-tagged jets are given by:
Njmis−id = Rj(Njdata,SS−Nsimj ,prompt,SS),
Rj = Njsim,mis−id,OS
Njsim,mis−id,SS ,
(6)
where
Ndataj ,SSis the number of observed same-sign events,
Njsim,prompt,SSis the estimated number of
same-sign events with two prompt leptons, and
Rjis the ratio in simulation of the number of opposite-sign
(
Nsimj ,mis−id,OS) to same-sign (
Nsimj ,mis−id,SS) events with misidentified leptons, all with
j b-tagged jets. This
[GeV]
µ e
Dilepton pT
0 50 100 150 200 250
Events / 10 GeV
0 5000 10000 15000 20000
25000 ATLAS Preliminary
= 13 TeV, 36.1 fb-1
s
Data 2015+16 Powheg+PY8 t
t Wt Z+jets Diboson Mis-ID lepton Powheg+PY8 Powheg+PY8 RadUp Powheg+PY8 RadDn aMC@NLO+PY8
[GeV]
µ e
Dilepton pT
0 50 100 150 200 250
MC / Data 0.8 1
1.2 Stat. uncert.
(a)
[GeV]
µ
Dilepton me
0 50 100 150 200 250 300 350 400 450
Events / 20 GeV
0 5000 10000 15000 20000 25000 30000
ATLAS Preliminary
= 13 TeV, 36.1 fb-1
s
Data 2015+16 Powheg+PY8 t
t Wt Z+jets Diboson Mis-ID lepton Powheg+PY8 Powheg+PY8 RadUp Powheg+PY8 RadDn aMC@NLO+PY8
[GeV]
µ e
Dilepton m
0 50 100 150 200 250 300 350 400 450
MC / Data 0.8 1
1.2 Stat. uncert.
(b)
µ| Dilepton |ye
0 0.5 1 1.5 2 2.5
Events / 0.25
0 10000 20000 30000 40000 50000 60000 70000
80000 ATLAS Preliminary
= 13 TeV, 36.1 fb-1
s
Data 2015+16 Powheg+PY8 t
t Wt Z+jets Diboson Mis-ID lepton Powheg+PY8 Powheg+PY8 RadUp Powheg+PY8 RadDn aMC@NLO+PY8
µ| Dilepton |ye
0 0.5 1 1.5 2 2.5
MC / Data 0.9 1
1.1 Stat. uncert.
(c)
[rad]
µ
φe
∆ Dilepton
0 0.5 1 1.5 2 2.5 3
/10)πEvents / (
0 5000 10000 15000 20000 25000 30000
35000 ATLAS Preliminary
= 13 TeV, 36.1 fb-1
s
Data 2015+16 Powheg+PY8 t
t Wt Z+jets Diboson Mis-ID lepton Powheg+PY8 Powheg+PY8 RadUp Powheg+PY8 RadDn aMC@NLO+PY8
[rad]
µ
φe
∆ Dilepton
0 0.5 1 1.5 2 2.5 3
MC / Data 0.95 1
1.05 Stat. uncert.
(d)
[GeV]
µ T e+p
T
Dilepton p
50 100 150 200 250 300 350
Events / 20 GeV
0 5000 10000 15000 20000 25000 30000 35000 40000
45000 ATLAS Preliminary
= 13 TeV, 36.1 fb-1
s
Data 2015+16 Powheg+PY8 t
t Wt Z+jets Diboson Mis-ID lepton Powheg+PY8 Powheg+PY8 RadUp Powheg+PY8 RadDn aMC@NLO+PY8
[GeV]
µ
+pT e
Dilepton pT
50 100 150 200 250 300 350
MC / Data 0.8 1
1.2 Stat. uncert.
(e)
[GeV]
+Eµ
Dilepton Ee
100 200 300 400 500 600 700
Events / 20 GeV
0 2000 4000 6000 8000 10000 12000 14000 16000 18000 20000 22000 24000
ATLAS Preliminary
= 13 TeV, 36.1 fb-1
s
Data 2015+16 Powheg+PY8 t
t Wt Z+jets Diboson Mis-ID lepton Powheg+PY8 Powheg+PY8 RadUp Powheg+PY8 RadDn aMC@NLO+PY8
[GeV]
+Eµ
Dilepton Ee
100 200 300 400 500 600 700
MC / Data 0.8 1
1.2 Stat. uncert.
(f)
Figure 2: Distributions of (a) the dilepton peµT , (b) invariant massmeµ, (c) rapidity |yeµ|, (d) azimuthal angle difference∆φeµ, (e) leptonpTsumpe
T+pµ
Tand (f) lepton energy sumEe+Eµ, in events with an opposite-signeµ pair and at least oneb-tagged jet. The reconstruction-level data are compared to the expectation from simulation, broken down into contributions fromtt¯(Powheg + Pythia8),Wt,Z+jets, dibosons, and events with misidentified electrons or muons, normalised to the same number of entries as the data. The lower parts of the figure show the ratios of simulation to data, using varioustt¯signal samples and with the cyan band indicating the data statistical uncertainty. The last bin includes the overflow in panels (a), (b), (e) and (f).