A TLAS-CONF-2014-049 21 July 2014
ATLAS NOTE
ATLAS-CONF-2014-049
July 21, 2014
Search for neutral Higgs bosons of the Minimal Supersymmetric Standard Model in pp collisions at √
s = 8 TeV with the ATLAS detector
The ATLAS Collaboration
Abstract
A search for the neutral Higgs bosons predicted by the Minimal Supersymmetric Stan- dard Model (MSSM) is reported. The analysis is performed on data from proton-proton collisions at a centre-of-mass energy of 8 TeV collected with the ATLAS detector at the Large Hadron Collider (LHC). The sample was collected in 2012 and corresponds to an integrated luminosity of 19.5–20.3 fb
−1. The MSSM Higgs bosons are searched for in the τ
+τ
−final state. No significant excess over the expected background is observed, and exclu- sion limits are derived for the production cross section times branching fraction of a scalar particle as a function of its mass. The results are also interpreted in the MSSM parameter space by quoting exclusion limits on tan β as a function of m
A.
° c Copyright 2014 CERN for the benefit of the ATLAS Collaboration.
Reproduction of this article or parts of it is allowed as specified in the CC-BY-3.0 license.
1 Introduction
The discovery of a scalar particle with a mass of about 125 GeV at the Large Hadron Collider (LHC) [1,2]
has provided important insight into the mechanism of electroweak symmetry breaking. Experimental studies of the new particle [3–7] demonstrate consistency with the Standard Model (SM) Higgs boson [8–13]. However, it remains possible that the discovered particle is part of an extended scalar sector, a scenario that is favoured by a number of theoretical arguments [14, 15].
The Minimal Supersymmetric Standard Model (MSSM) [16–20] is an extension of the SM which provides a framework addressing naturalness, gauge coupling unification and the existence of dark matter. The MSSM is compatible with the recently discovered Higgs boson at the LHC (see, e.g.
Ref. [21–23]). The Higgs sector of the MSSM contains two Higgs doublets, which results in five phys- ical Higgs bosons after electroweak symmetry breaking. Of these bosons, two are neutral and CP-even (h, H),
1one is neutral and CP-odd (A), and the remaining two are charged (H
±). Only two additional parameters are needed with respect to the SM at tree level to describe the MSSM Higgs sector and can be chosen to be the mass of the CP-odd Higgs boson, m
A, and the ratio of the vacuum expectation values of the two Higgs doublets, tan β. The couplings of the MSSM Higgs bosons to down-type fermions are enhanced with respect to the SM, especially for large tan β values, resulting in increased branching fractions to τ leptons and b-quarks, as well as a higher cross section for Higgs boson production in as- sociation with b-quarks. Previous searches for a neutral MSSM Higgs boson have been performed at LEP [24], the Tevatron [25–27] and the LHC [28–30].
This note presents the results of a search for a neutral MSSM Higgs boson in the ττ decay mode using 19.5–20.3 fb
−1of proton–proton collision data collected with the ATLAS detector [31] in 2012 at a centre-of-mass energy of 8 TeV. Higgs boson production through gluon fusion or in association with b-quarks is considered (see Fig. 1), with the latter mode dominating for high tan β values. The results of the search are interpreted in the m
maxhscenario [32, 33] of the MSSM.
The search for the SM Higgs boson in the ττ channel at the LHC [34, 35] is similar to that described here. The important difference between the two searches is that they are optimised for different pro- duction mechanisms and different Higgs boson mass ranges. As a consequence, this search has little sensitivity to the production of a SM Higgs boson with mass around 125 GeV. For consistency the SM Higgs signal is not considered part of the SM background, as the MSSM contains a SM-like Higgs boson for large parts of the parameter space.
g g
h/H/A
g
g ¯b
b h/H/A
g b
b h/H/A
2 The ATLAS detector
The ATLAS experiment [31] at the LHC is a multi-purpose particle detector with a forward-backward symmetric cylindrical geometry and a near 4π coverage in solid angle. It consists of an inner tracking detector surrounded by a thin superconducting solenoid providing a 2 T axial magnetic field, electro- magnetic and hadronic calorimeters, and a muon spectrometer. The inner tracking detector covers the pseudorapidity range
2| η | < 2.5. It consists of silicon pixel, silicon micro-strip, and transition radia- tion tracking detectors. Lead/liquid-argon (LAr) sampling calorimeters provide electromagnetic (EM) energy measurements with high granularity. A hadronic (iron/scintillator-tile) calorimeter covers the central pseudorapidity range ( | η | < 1.7). The end-cap and forward regions are instrumented with LAr calorimeters for both EM and hadronic energy measurements up to | η | = 4.9. The muon spectrome- ter surrounds the calorimeters and is based on three large air-core toroid superconducting magnets with eight coils each. Its bending power is in the range from 2.0 to 7.5 Tm. It includes a system of precision tracking chambers and fast detectors for triggering. A three-level trigger system is used to select events.
The first-level trigger is implemented in hardware and uses a subset of the detector information to reduce the accepted rate to at most 75 kHz. This is followed by two software-based trigger levels that together reduce the accepted event rate to 400 Hz on average depending on the data-taking conditions during 2012.
3 Data and Monte Carlo simulation samples
The data used in this search were recorded by the ATLAS experiment during the 2012 LHC run with proton–proton collisions at a centre-of-mass energy of 8 TeV. They correspond to an integrated luminos- ity of 19.5–20.3 fb
−1, depending on the event topology.
Simulated samples of signal and background events were produced using various event generators.
The presence of multiple interactions occurring in the same or neighbouring bunch crossings (pileup) was accounted for, and the ATLAS detector was modelled using GEANT4 [36, 37].
The Higgs boson production mechanisms considered in this analysis are gluon-fusion and b-associated production. The cross sections for these processes have been calculated using HIGLU [38], ggh@nnlo [39]
and S H [40]. For b-associated production, four-flavour [41, 42] and five-flavour [43] cross section calculations are combined [44]. The masses, couplings and branching ratios of the Higgs bosons are computed with FeynHiggs [45]. Gluon-fusion production is simulated with POWHEG [46], while b- associated production is simulated with SHERPA [47]. Both samples use the CT10 [48] parton distribu- tion function set. The signal samples are generated at discrete values of m
A, with the mass step chosen by taking the ττ mass resolution into account. The signal model is constructed by combining three mass samples, one for each of the h, H and A bosons, with appropriately scaled cross sections and branching ratios. The cross sections, branching ratios, as well as the masses of h and H bosons depend on m
A, tan β and the MSSM scenario under study.
Background samples of W and Z bosons produced in association with jets are produced using ALP- GEN [49], while the high mass Z/γ
∗tail is modelled separately using PYTHIA8 [50, 51] since a higher statistics sample was available and in the high mass range the current analysis is rather insensitive to the modelling of b-jet production. WW production is modelled with ALPGEN and WZ and ZZ production is modeled with HERWIG [52]. Top pair production uses POWHEG and MC@NLO [53], and single-top
2
ATLAS uses a right-handed coordinate system with its origin at the nominal interaction point (IP) in the centre of the detector and the
z-axis along the beam pipe. Thex-axis points from the IP to the centre of the LHC ring, and they-axis pointsupwards. Cylindrical coordinates (r, φ) are used in the transverse plane,
φbeing the azimuthal angle around the beam pipe.
The pseudorapidity is defined in terms of the polar angle
θas
η =−ln tan(θ/2). Angular distance is measured in units of
∆R≡p
∆η2+ ∆φ2
.
processes are generated with AcerMC [54]. All simulated background samples use the CTEQ6L1 [55]
parton distribution function set apart from MC@NLO that uses CT10.
For all the simulated event samples, the parton shower and hadronisation are simulated with HER- WIG, PYTHIA8 or SHERPA. PYTHIA8 is used for POWHEG generated samples, SHERPA for the b-associated signal production and HERWIG for the remaining samples. Decays of τ leptons are gen- erated with TAUOLA [56], SHERPA or PYTHIA8. PHOTOS [57] or SHERPA provides additional radiation from charged leptons.
Z/γ
∗→ ττ events form an irreducible background that is particularly important when considering low mass Higgs bosons (m
A. 200 GeV). It is modelled with Z/γ
∗→ µ
+µ
−events from data, where the muon tracks and the associated calorimeter cells are replaced by the corresponding simulated signature of a τ lepton decay. The two τ leptons are simulated by TAUOLA. The procedure takes into account the effect of τ polarisation and spin correlations. In the resulting sample, the τ lepton decays and their detector response are modelled by the simulation, while the underlying event kinematics and all other properties are obtained from data. Although the µµ event selection in data results in a pure Z/γ
∗→ µ
+µ
−sample, there is still some contributions from t¯ t and diboson production, which is taken into account using simulation. This τ-embedded Z/γ
∗→ µ
+µ
−sample has been validated as described in Refs. [28, 58].
4 Object reconstruction
Electron candidates are formed from energy deposits in the electromagnetic calorimeter associated with a charged particle track measured in the inner detector. Electrons are selected if they have a transverse energy E
T> 15 GeV, lie within | η | < 2.47, but outside the transition region between the barrel and end-cap calorimeters (1.37 < | η | < 1.52), and meet the “medium” identification requirements defined in Ref. [59]. Additional isolation criteria, based on tracking and calorimeter information, are used to suppress backgrounds from misidentified jets or semi-leptonic decays of heavy quarks. In particular, the sum of the calorimeter deposits in cones of sizes ∆R = 0.2 − 0.3 with respect to the electron direction is required to be less than 6–14% of the electron E
Tdepending on the channel. Similarly, the scalar sum of the transverse momentum of tracks with p
T> 1 GeV in cones of sizes ∆R = 0.3 − 0.4 with respect to the electron direction is required to be less than 6–13% of the electron track p
Tdepending on the channel.
Muon candidates are reconstructed by associating an inner detector track with a muon spectrometer track [60]. For this analysis, the reconstructed muons are required to have a transverse momentum p
T> 10 GeV and to lie within | η | < 2.5. Additional track quality and isolation criteria are required to further suppress backgrounds from cosmic rays, hadrons punching through the calorimeter, or muons from semi-leptonic decays of heavy quarks. The muon calorimetric and track isolation criteria use the same cone sizes and the same threshold values with respect to the muon p
Tas in the case of electrons.
Jets are reconstructed using the anti-k
talgorithm [61] with a radius parameter R = 0.4, taking topo- logical clusters [62] in the calorimeter as input. The jet energy is calibrated using a combination of test- beam results, simulation and in situ measurements [63]. Jets must satisfy E
T> 20 GeV and | η | < 4.5. To reduce the effect of pile-up, it is required that, for jets within | η | < 2.4 and E
T< 50 GeV, at least half of the transverse momentum, as measured by the associated charged particles, be from particles matched to
3
Hadronic decays of τ leptons (τ
had) [66] are reconstructed starting from topological clusters in the calorimeter. A τ
hadcandidate must lie within | η | < 2.5, have a transverse momentum greater than 20 GeV, one or three associated tracks and a charge of ± 1. Information on the collimation, isolation, and shower profile is combined into a multivariate discriminant against backgrounds from jets. Dedicated algorithms that reduce the number of electrons and muons misreconstructed as hadronic tau decays are applied. In this analysis, two τ
hadidentification selections are used —“loose” and “medium”— with efficiencies of about 65% and 55%, respectively. The rejection against jets misreconstructed as τ
hadof these criteria depends on τ
hadp
T, η, the number of associated tracks and whether the jet is quark or gluon initiated.
For “loose” identification, it is about 10 and 20 for τ
hadwith one and three associated tracks, respectively, as measured in a sample of multi-jet events in data [66]. The rejection factors become, respectively, 50 and 100 for “medium” identification criterion.
When different objects selected according to the criteria mentioned above overlap with each other geometrically (within ∆R = 0.2) only one of them is considered. The overlap is resolved by selecting muon, electron, τ
hadand jet candidates in this order of priority.
The missing transverse momentum, E
Tmiss, is defined as the magnitude of the negative vectorial sum of muons and energy deposits in the calorimeters [67]. The direction of this vectorial sum defines the E
missTdirection. Clusters of calorimeter-cell energy deposits belonging to jets, τ
hadcandidates, electrons, and photons, as well as cells that are not associated to any object, are treated separately in the E
missTcalculation. Calorimenter cells, which are not matched to any object, are weighted by the fraction of unmatched tracks that are associated to the primary vertex, in order to reduce the effect of pile-up on the E
Tmissresolution. The contributions of muons to E
missTare calculated differently for isolated and non-isolated muons, to account for the energy deposited by muons in the calorimeters.
5 Search Channels
The following ττ decay modes are considered in this search: τ
eτ
µ(6%), τ
eτ
had(23%), τ
µτ
had(23%) and τ
hadτ
had(42%), where τ
eand τ
µrepresent the two leptonic tau decay modes and the percentages in the parentheses denote the corresponding ττ branching ratios. The selections defined for each of the channels and described in Sections 5.1–5.3 are such that there are no common events in any two of these channels.
Events are collected using a number of single and combined object triggers. The single electron and muon triggers require an isolated lepton with a p
Tthreshold of 24 GeV. The single τ
hadtrigger implements a τ
hadwith a p
Tthreshold of 125 GeV. The following combined object triggers are used: an electron-muon trigger with lepton p
Tthresholds of 12 and 8 GeV for electrons and muons, respectively, and a τ
hadτ
hadtrigger with p
Tthresholds of 38 GeV for each hadronically decaying τ lepton.
With two τ leptons in the final state, it is not possible to infer the neutrino momenta from the re- constructed E
Tmissvector to estimate the ττ invariant mass difficult. Two approaches are used. The first method used is the Missing Mass Calculator (MMC) [68]. This algorithm assumes that the missing transverse momentum is due entirely to the neutrinos, and performs a scan over the angles between the neutrinos and the visible τ lepton decay products. The MMC mass, m
MMCττ, is defined as the most likely value chosen by weighting each solution according to probability density functions that are derived from simulated τ lepton decays. As an example, the MMC resolution
4, assuming a Higgs boson with mass m
A= 150 GeV, is about 30% for τ
eτ
µevents. The resolution is about 20% for τ
lepτ
hadevents (τ
lep= τ
eor τ
µ) for Higgs bosons with a mass of either m
A= 150 or 350 GeV. The second method uses the ττ total
4
The resolution of the mass reconstruction is estimated by dividing the root mean square of the mass distribution by its
mean.
transverse mass, defined as:
m
totalT= q
m
2T(τ
1, τ
2) + m
2T(τ
1, E
missT) + m
2T(τ
2, E
Tmiss) ,
where the transverse mass, m
T, between two objects with transverse momenta p
T1and p
T2and relative angle ∆φ is given by
m
T= p
2 p
T1p
T2(1 − cos ∆φ) .
As an example, the m
totalTmass resolution assuming a Higgs boson with mass m
φ= 350 GeV for τ
hadτ
hadevents is approximately 30%. While the MMC exhibits a better ττ mass resolution for signal events, multi-jet background events tend to be reconstructed at lower masses with m
totalT, leading to an overall better signal to background discrimination for topologies dominated by multi-jet background.
5.1 The h/H/A → τ
eτ
µchannel
Events in the h/H/A → τ
eτ
µchannel are selected using either single electron or electron-muon triggers.
The data sample corresponds to an integrated luminosity of 20.3 fb
−1. Exactly one isolated electron and one isolated muon of opposite charge are required, with lepton p
Tthresholds of 15 GeV for electrons and 10 GeV for muons. Electrons with p
Tin the range 15–25 GeV are from events selected by the electron- muon trigger, whereas for p
T> 25 GeV are selected by the single electron trigger. Events containing hadronically decaying τ leptons, passing the “loose” τ
hadidentification criterion, are vetoed.
To increase the sensitivity of this channel, the events are split into two categories based on the pres- ence (“tag category”) or absence (“veto category”) of a b-tagged jet. The tag category requires exactly one jet passing the b-jet identification criterion. In addition, a number of kinematic requirements are imposed to reduce the background from top quark decays. The azimuthal angle between the electron and the muon, ∆φ(e, µ), must be greater than 2. The sum of the cosines of the azimuthal angles between the leptons and the E
missT, Σ cos ∆φ ≡ cos(φ(e) − φ(E
missT)) + cos(φ(µ) − φ(E
missT)), must be greater than − 0.2.
The scalar sum of the p
Tof jets with p
T> 30 GeV must be less than 100 GeV. Finally, the scalar sum of the p
Tof the leptons and the E
Tmissmust be below 125 GeV. The veto category is defined by requiring that no jet passes the b-jet identification criterion. Because the top quark background is smaller in this category, the imposed kinematic selection requirements, ∆φ(e, µ) > 1.6 and Σ cos ∆φ > − 0.4, are looser than in the tag category.
The most important background processes in this channel are Z/γ
∗+ jets, t¯ t, and multi-jet production.
The Z/γ
∗→ ττ background is estimated using the τ-embedded Z/γ
∗→ µ
+µ
−sample outlined in Section 3. It is normalized using the NNLO Z/γ
∗+ jets cross section calculated with FEWZ [69] and an estimate of the trigger and lepton η, p
Tand identification efficiency from simulation. The t¯ t background is estimated from simulation with the normalization taken from a data control region enriched in t t ¯ events.
W+jet background where one of the leptons results from a misidentified jet is estimated using simulation.
Smaller backgrounds from single top, and diboson production are also estimated from simulation.
The multi-jet background is estimated from data using a two-dimensional sideband method. The
event sample is split into four regions according to the charge product of the eµ pair and the isolation
requirements on the electron and muon. Whereas region A (B) contains events where both leptons pass
Tag category Veto category
Signal 140 ± 30 2020 ± 130
(m
A= 150 GeV, tan β = 20)
Z/γ
∗→ ττ+jets 420 ± 30 55000 ± 4000
Multi-jet 100 ± 21 4200 ± 700
t¯ t and Single Top 420 ± 50 2700 ± 400
Others 26 ± 7 4010 ± 280
Total background 970 ± 60 66000 ± 4000
Data 904 65917
Table 1: Number of events observed for the h/H/A → τ
eτ
µchannel and the predicted background and signal. The predicted signal event yields correspond to the parameter choice m
A= 150 GeV and tan β = 20. The row labeled “Others” includes events from diboson production, Z/γ
∗→ ee/µµ and W+jets production. Combined statistical and systematic uncertainties are quoted. The signal prediction does not include the uncertainty due to the cross section calculation.
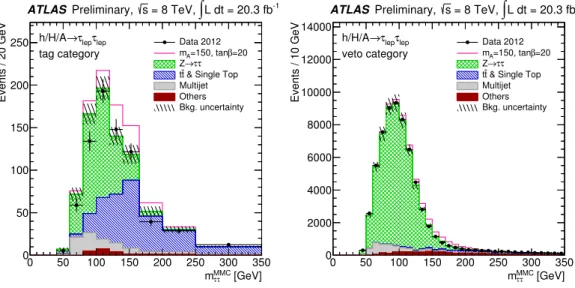
Table 1 shows the number of observed τ
eτ
µevents, the prediction of the background and the signal
prediction for the MSSM m
maxhscenario parameter choice m
A= 150 GeV, tan β = 20. The table quotes
also the total combined statistical and systematic uncertainties in the predictions. The observed event
yields are compatible with the expected yields from SM processes. The MMC mass is used as the
discriminating variable in this channel, and is shown in Figure 2 for the tag and veto categories separately.
[GeV]
MMCτ
mτ
0 50 100 150 200 250 300 350
Events / 20 GeV
0 50 100 150 200
250 Data 2012
β=20
=150, tan mA
τ τ Z→
& Single Top t
t Multijet Others Bkg. uncertainty ATLAS Preliminary, s = 8 TeV,
∫
L dt = 20.3 fb-1tag category τlep
τlep
→ h/H/A
[GeV]
MMCτ
mτ
0 50 100 150 200 250 300 350
Events / 10 GeV
0 2000 4000 6000 8000 10000 12000 14000
Data 2012 β=20
=150, tan mA
τ τ Z→
& Single Top t
t Multijet Others Bkg. uncertainty ATLAS Preliminary, s = 8 TeV,
∫
L dt = 20.3 fb-1veto category τlep
τlep
→ h/H/A
Figure 2: MMC mass distributions for the h/H/A → τ
eτ
µchannel. The MMC mass is shown for the tag
(left panel) and the veto categories (right panel). The data are compared to the background expectation
and a hypothetical MSSM signal (m
A= 150 GeV and tan β = 20). The contributions of the diboson,
Z/γ
∗→ ee/µµ, and W + jets background processes are combined and labelled “Others”. The background
uncertainty includes statistical and systematic uncertainties.
5.2 The h/H/A → τ
lepτ
hadchannel
Events in the h/H/A → τ
lepτ
hadchannel are selected using single electron or single muon triggers.
The data sample corresponds to an integrated luminosity of 20.3 fb
−1. Events are required to contain an electron or a muon with p
T> 26 GeV and an oppositely-charged τ
hadwith p
T> 20 GeV satisfying the
“medium” τ
hadidentification criterion. Events must not contain additional electrons or muons.
The event selection is optimised separately for low and high mass Higgs bosons in order to exploit differences in kinematics and background composition.
The low mass selection targets the parameter space with m
A< 200 GeV. It includes two orthogonal categories: the tag category and the veto category. In the tag category there must be at least one jet tagged as a b-jet. No other jet than the leading b-jet must have a p
Texceeding 30 GeV, and the transverse mass between the lepton and the E
Tmissis required to not exceed 45 GeV. These requirements serve to reduce the otherwise dominant t¯ t background. In the veto category there must be no jet tagged as b-jet. Two additional selection requirements are applied to reduce the W + jets background. First, the transverse mass between the lepton and the E
Tmissmust be below 60 GeV. Secondly, the sum of the azimuthal angles between the τ
had–E
missTpair and the lepton–E
missTpair, Σ∆φ ≡ ∆φ(τ
had, E
missT) + ∆φ(τ
lep, E
Tmiss), must have a value less than 3.3. Finally, in the τ
µτ
hadchannel of the veto category, dedicated requirements based on kinematic and shower shape properties of the tau candidate are applied to reduce the number of muons faking hadronic tau decays.
The high mass selection targets m
A≥ 200 GeV. It is required that Σ∆φ < 3.3, in order to re- duce the W+jets background. The hadronic and leptonic tau decays are requested to be back-to-back:
∆φ(τ
lep, τ
had) > 2.4. In addition, the transverse momentum difference between the τ
hadand the lepton,
∆p
T≡ p
T(τ
had) − p
T(lepton), must be above 45 GeV. This requirement takes advantage of the fact that a τ
hadtends to have a higher visible transverse momentum than a τ
lepdue to the presence of more neutrinos in the latter decay.
In the low-mass categories, the electron and muon channels are treated separately and combined statistically. For the high-mass category, they are treated as a single channel to improve the statistical robustness.
The most important SM background processes in this channel are Z/γ
∗+ jets, W + jets, multi-jet production, top (including both t t ¯ and single top) and diboson production. The τ-embedded Z/γ
∗→ µ
+µ
−sample is used to estimate the Z/γ
∗→ ττ background. It is normalised in the same way as in the τ
lepτ
lepchannel. The rate at which electrons are misidentified as τ
had, important mostly for Z → ee decays, has been estimated from data [66]. The contribution of diboson processes is small and estimated from simulation. Events originating from W +jets, Z( → ℓℓ)+ jets (ℓ = e, µ), t t ¯ and single top production, in which a jet is misreconstructed as τ
had, are estimated from simulated samples with normalisation defined by comparing event yields in background-dominated control regions in data. Separate regions are defined for the low-mass tag, low-mass veto, and high-mass categories. Systematic uncertainties are derived using alternative definitions for the control regions. The multi-jet background is estimated with a two-dimensional sideband method, similar to the one employed for the τ
eτ
µchannel, using the lepton (e or µ) - τ
hadcharge product and lepton isolation. The systematic uncertainty on the predicted event yield is estimated by varying the definitions of the regions used, and by testing the stability of the r
C/Dratio across the m
MMCττrange.
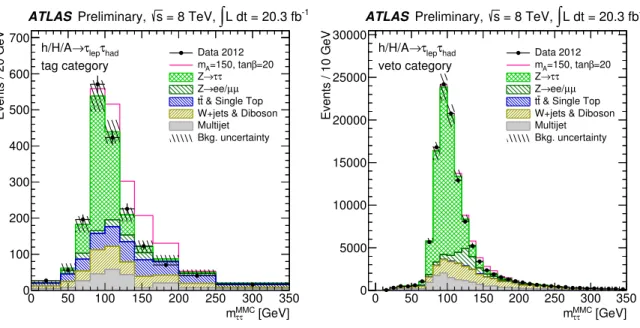
Table 2 shows the number of observed τ
lepτ
hadevents, the prediction of the background, and the
signal prediction for the MSSM m
maxhscenario parameter choices m
A= 150 GeV, tan β = 20 for the low
mass categories and m
A= 350 GeV, tan β = 30 for the high mass category. The table quotes also the
total combined statistical and systematic uncertainties in the predictions. The observed event yields are
compatible with the expected yields from Standard Model processes within the uncertainties. The MMC
mass is used as the final mass discriminant in this channel and is shown in Figures 3 and 4 for the low
and high mass categories, respectively.
Low mass categories
Tag category Veto category
e channel µ channel e channel µ channel
Signal 190 ± 40 190 ± 40 1870 ± 90 1840 ± 90
(m
A= 150 GeV, tan β = 20)
Z → ττ+jets 400 ± 40 430 ± 40 31700 ± 2800 38400 ± 3300
Z → ℓℓ+jets (ℓ = e, µ) 70 ± 24 33 ± 14 6000 ± 900 2900 ± 500
W+jets 160 ± 40 190 ± 60 9100 ± 1300 9800 ± 1400
Multi-jet 185 ± 35 66 ± 31 11700 ± 500 3100 ± 400
t t ¯ and Single Top 230 ± 40 236 ± 34 530 ± 90 500 ± 100
Diboson 9.1 ± 2.3 10.0 ± 2.5 470 ± 40 470 ± 40
Total background 1060 ± 80 960 ± 90 59400 ± 3300 55000 ± 4000
Data 1067 947 60351 54776
High mass category
Signal 315 ± 18
(m
A= 350 GeV, tan β = 30)
Z → ττ+jets 410 ± 50
Z → ℓℓ+jets (ℓ = e, µ) 35 ± 7
W+jets 210 ± 40
Multi-jet 57 ± 20
t t ¯ and Single Top 184 ± 26
Diboson 30 ± 5
Total background 930 ± 70
Data 920
Table 2: Number of events observed for the h/H/A → τ
lepτ
hadchannel and the predicted background and
signal. The predicted signal event yields correspond to the parameter choice m
A= 150 GeV, tan β = 20
for the low mass categories and m
A= 350 GeV, tan β = 30 for the high mass category. Combined
statistical and systematic uncertainties are quoted. The signal prediction does not include the uncertainty
due to the cross section calculation.
[GeV]
MMCτ
mτ
0 50 100 150 200 250 300 350
Events / 20 GeV
0 100 200 300 400 500 600 700
Data 2012 β=20
=150, tan mA
τ τ Z→
µ ee/µ Z→
& Single Top t
t
W+jets & Diboson Multijet Bkg. uncertainty
ATLAS
Preliminary, s = 8 TeV, ∫ L dt = 20.3 fb
-1tag category τhad
τlep
→ h/H/A
[GeV]
MMCτ
mτ
0 50 100 150 200 250 300 350
Events / 10 GeV
0 5000 10000 15000 20000 25000 30000
Data 2012 β=20
=150, tan mA
τ τ Z→
µ ee/µ Z→
& Single Top t
t
W+jets & Diboson Multijet Bkg. uncertainty
ATLAS
Preliminary, s = 8 TeV, ∫ L dt = 20.3 fb
-1veto category τhad
τlep
→ h/H/A
Figure 3: MMC mass distributions for the low-mass categories of the h/H/A → τ
lepτ
hadchannel. Tag (left panel) and veto (right panel) categories are shown for the combined τ
eτ
hadand τ
µτ
hadfinal states.
The data are compared to the background expectation and a hypothetical MSSM signal (m
A= 150 GeV and tan β = 20). The background uncertainty includes statistical and systematic uncertainties.
[GeV]
MMCτ
mτ
0 100 200 300 400 500 600 700 800 900 1000
Events / 50 GeV
0 50 100 150 200 250 300
Data 2012 β=30
=350, tan mA
τ τ
→ Z
µ ee/µ Z→
& Single Top t
t
W+jets & Diboson Multijet Bkg. uncertainty
ATLAS
Preliminary, s = 8 TeV, ∫ L dt = 20.3 fb
-1high mass category τhad
τlep
→ h/H/A
Figure 4: MMC mass distributions for the high-mass category of the h/H/A → τ
lepτ
hadchannel shown
for the combined τ
eτ
hadand τ
µτ
hadfinal states. The data are compared to the background expectation
and a hypothetical MSSM signal (m
A= 350 GeV and tan β = 30). The background uncertainty include
statistical and systematic uncertainties.
5.3 The h/H/A → τ
hadτ
hadchannel
Events in the h/H/A → τ
hadτ
hadchannel are selected using either a single τ
hadtrigger or a τ
hadτ
hadtrigger. The data sample corresponds to an integrated luminosity of 19.5 fb
−1. Events are required to contain at least two τ
had, identified using the “loose” identification criterion. If more than two τ
hadare present, the two with the highest p
Tvalues are considered. Events containing an electron or muon are rejected to ensure orthogonality with the other channels. The two τ
hadare required to have p
T>
50 GeV, have opposite electric charges, and to be back-to-back in the azimuthal plane (∆φ > 2.7). Two event categories are defined as follows. The single-τ
hadtrigger category (STT category) includes the events selected by the single τ
hadtrigger that contain at least one τ
hadwith p
T> 150 GeV. The τ
hadτ
hadtrigger category (DTT category) includes the events selected by the τ
hadτ
hadtrigger, with the leading τ
hadrequired to have pT less than 150 GeV, to ensure orthogonality with the STT category, and with both taus passing the “medium” identification criterion. In addition, events in the DTT category are required to have E
Tmiss> 10 GeV, and the scalar sum of transverse energy of all deposits in the calorimeter to be greater than 160 GeV.
The dominant background in this channel is multi-jet production and for this reason the m
totalTis used as a final discriminant. Other processes include Z/γ
∗+ jets, W + jets, t t ¯ and diboson.
The multi-jet background is estimated separately for the STT and DTT categories. A control region is defined in the STT category by requiring the next-to-highest-p
Tτ
hadto fail the “loose” τ
hadidentifi- cation criterion, thus obtaining a high purity sample of multi-jet events. The number of multi-jet events in the signal region is then estimated by extrapolating from this control region. The extrapolation is per- formed by measuring the ratio between the number of jets passing and failing the same τ
hadidentification criterion in a pure sample of di-jet events. An estimate for the systematic uncertainty of the method is obtained based on the charge product of the two jets in this control sample. The uncertainty is in the range 2–30% depending on the jet p
Tand number of associated tracks. A two-dimensional sideband method is used in the DTT category by defining four regions based on the charge product of the two τ
hadand the E
Tmiss> 10 GeV requirement. A systematic uncertainty is derived by measuring the variation of the ratio of opposite-sign over same-sign τ
hadτ
hadpairs for different sideband region definition, as well as across the m
totalTrange, and amounts to 5%.
The remaining backgrounds are modelled using simulation. Non-multi-jet processes with jets faking taus are dominated by W( → τν)+jets. Their contribution is estimated by simulation, which is corrected using the efficiency of a jet to be misidentified as a τ
hadmeasured in a control region in data. Z/γ
∗+ jets background is also estimated using simulation. Due to the low statistics after the p
Tthresholds of the tau trigger requirements, the tau-embedded Z → µµ sample is not used.
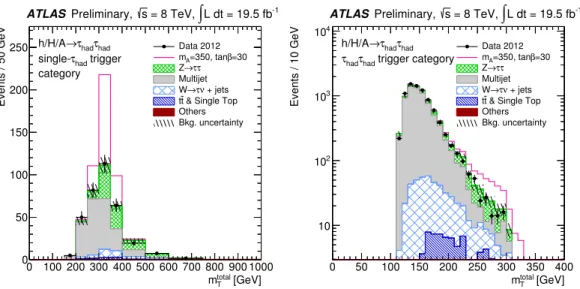
Table 3 shows the number of observed τ
hadτ
hadevents, the prediction of the background and the
signal prediction for the MSSM m
maxhscenario parameter choice m
A= 350 GeV, tan β = 30. The table
quotes also the total combined statistical and systematic uncertainties in the predictions. The observed
event yields are compatible with the expected yields from SM processes within the uncertainties. The
distributions of the total transverse mass are shown in Figure 5 for the STT and the DTT categories
separately.
Single-τ
hadtrigger τ
hadτ
hadtrigger (STT) category (DTT) category
Signal 177 ± 35 340 ± 50
(m
A= 350 GeV, tan β = 30)
Multi-jet 216 ± 25 6800 ± 400
Z/γ
∗→ ττ 113 ± 18 750 ± 210
W( → τν)+jets 34 ± 8 400 ± 100
t t ¯ and Single Top 10 ± 4 76 ± 26
Others 0.50 ± 0.20 3.4 ± 0.8
Total background 370 ± 30 8000 ± 500
Data 373 8225
Table 3: Number of events observed for the h/H/A → τ
hadτ
hadchannel and the predicted background and signal. The predicted signal event yields correspond to the parameter choice m
A= 350 GeV, tan β = 30. The row labeled “Others” include events from diboson production, Z → ll and W → lν with l = e, µ.
Combined statistical and systematic uncertainties are quoted. The signal prediction does not include the uncertainty due to the cross section calculation.
[GeV]
total
mT
0 100 200 300 400 500 600 700 800 900 1000
Events / 50 GeV
0 50 100 150 200
250 Data 2012
β=30
=350, tan mA
τ τ
→ Z Multijet
+ jets ν τ
→ W
& Single Top t
t Others Bkg. uncertainty ATLAS Preliminary, s = 8 TeV,
∫
L dt = 19.5 fb-1category trigger τhad
single- τhad
τhad
→ h/H/A
[GeV]
total
mT
0 50 100 150 200 250 300 350 400
Events / 10 GeV
10 102
103
104
Data 2012 β=30
=350, tan mA
τ τ
→ Z Multijet
+ jets ν τ
→ W
& Single Top t
t Others Bkg. uncertainty ATLAS Preliminary, s = 8 TeV,
∫
L dt = 19.5 fb-1trigger category τhad
τhad had hadτ τ
→ h/H/A
Figure 5: Total transverse mass distributions for STT (left panel) and DTT (right panel) categories of the
h/H/A → τ
hadτ
hadchannel. The data are compared to the background expectation and a hypothetical
MSSM signal (m
A= 350 GeV and tan β = 30). The background labeled “Others” includes events from
diboson production, Z → ll and W → lν with l = e, µ. The background uncertainty includes statistical
and systematic uncertainties.
6 Systematic Uncertainties
The event yields for several of the backgrounds in this search have been estimated using control samples in data as described in Section 5 and their associated uncertainties are discussed there. In this section, the remaining uncertainties are discussed and the overall effect of the systematic uncertainties is presented.
Signal cross section uncertainties are taken from the study in Ref. [70]. Typical uncertainty values are in the range 10–15% for gluon-fusion and 15–20% for b-associated production.
The uncertainty on the signal acceptance from the parameters used in the event generation of signal and background samples is also considered. This is done by evaluating the change in acceptance after varying the relevant scale parameters, parton distribution function choices, and if applicable, conditions for the matching of the partons used in the fixed order calculation and the parton shower. The uncertainty on the signal acceptance is largest in the tag category for b-associated production where it is about 13%.
Uncertainties for single boson and diboson production cross sections have been estimated for missing higher order corrections, parton density functions and the value of the strong coupling constant, and have been considered wherever applicable. Acceptance uncertainties for these background processes have been estimated in the same way as for signal. The most important theoretical uncertainties on the background are the Z+jets cross section and acceptance that affect the normalisation by about 7%.
The uncertainty on the integrated luminosity is 2.8%. It is derived, following the same methodology as that detailed in Ref. [71], from a preliminary calibration of the luminosity scale derived from beam- separation scans performed in November 2012.
The single and double τ
hadtrigger efficiencies are studied in Z → ττ events. Their uncertainties are in the range 3–25% depending on the pseudorapidity, p
Tand the number of the associated tracks of the hadronic tau decay as well as the data taking period and they are estimated with a method similar to Ref. [72] updated for the 2012 data taking conditions.
The τ
hadidentification efficiency is measured using Z → ττ events. The uncertainty is in the range 3–10% depending on the pseudorapidity and the number of tracks matched to the τ lepton [66]. Ex- trapolated uncertainties are used for τ
hadcandidates with transverse momenta above those accessible in Z → ττ events.
The τ
hadenergy scale uncertainty is estimated by propagating the single particle response to the individual τ
haddecay products (neutral and charged pions). This uncertainty is in the range 2–4% [73]
depending on p
T, pseudorapidity and the number of associated tracks.
The jet energy scale (JES) and resolution uncertainties are described in Refs. [63] and [74]. The JES is established by exploiting the p
Tbalance between a jet and a reference object such as a Z boson or a photon. The uncertainty ranges between 3% and 7% depending on the p
Tand pseudorapidity.
The b-jet identification efficiency uncertainty ranges from 2% to 8% depending on the jet p
T. The estimation of this uncertainty is based on a study that uses t t ¯ events in data [64].
The E
missTuncertainties are derived by propagating all reconstructed object energy scale uncertain- ties. Additionally, the scale for energy outside reconstructed objects and the resolution uncertainties are considered [75].
Electron and muon reconstruction, identification, isolation and trigger efficiency uncertainties have
been estimated from data [60, 76]. Electron energy scale and resolution and muon momentum scale and
an additional uncertainty of 50% on the Z → ττ background is added for the τ
lepτ
hadtag cateogry for m
MMCττ> 135 GeV, and a 20% uncertainty for the τ
lepτ
hadhigh mass category for m
MMCττ> 400 GeV.
The relative effect of each of the systematic uncertainties can be seen by their influence on the signal strength parameter, µ, defined as the ratio of the fitted to the assumed signal cross section times branching ratio (see also Section 7). In the low mass analysis the dominant uncertainties on µ arise from τ
hadenergy scale, jet energy scale, electron and muon identification, Z+jets normalisation and lepton-to-tau fake rate. In the high mass analyses they are due to the τ
hadenergy scale, the multi-jet estimation, the τ
hadidentification and the τ
hadtrigger.
7 Results
The results from the channels studied in this search are combined to improve the sensitivity to the MSSM Higgs boson production. Each of the channels used here has been optimized for specific Higgs boson mass regimes. In particular, the τ
eτ
µchannel, the τ
lepτ
hadtag category, and the τ
lepτ
hadveto category are used for the range 90 ≤ m
A< 200 GeV. The τ
lepτ
hadhigh mass category and the τ
hadτ
hadchannel are used for m
A≥ 200 GeV.
The parameter of interest in this search is the signal strength, µ defined by the ratio of the fitted signal cross section times branching ratio to the signal cross section times branching ratio predicted by the particular MSSM signal assumption. The value µ = 0 corresponds to the absence of signal, whereas the value µ = 1 suggests signal presence as predicted by the theoretical model under study. The statistical analysis of the data employs a binned likelihood function constructed as the product of Poisson probability terms as an estimator of µ. Signal and background predictions depend on uncertainties that are parameterised as nuisance parameters and are constrained using Gaussian functions. The binned likelihood function is constructed in bins of the MMC mass for the τ
eτ
µand the τ
lepτ
hadchannels and in bins of total transverse mass for the τ
hadτ
hadchannel.
Since the data are in good agreement with the predicted background yields, exclusion limits are calculated. The significance of any small observed excess in data is evaluated by quoting p-values.
Exclusion limits use the modified frequentist method known as CL
s[78]. Both exclusion limits and p-values are calculated using the asymptotic approximation [79]. The test statistic used for the exclusion limits derivation is the ˜ q
µtest statistic and for the p-values the q
0test statistic
5[79].
The lowest local p-value for the statistical combination corresponds to 0.20, or 0.8 σ in terms of Gaussian standard deviations, at m
φ= 200 GeV. For the individual channels, the lowest local p-value in τ
hadτ
hadis 0.10 (or 1.3 σ) at m
φ= 250 GeV and for the τ
lepτ
had0.10 (or 1.3 σ) at m
φ= 90 GeV. In the τ
lepτ
lepchannel there is no excess in the mass region used for the combination (90 ≤ m
φ< 200 GeV).
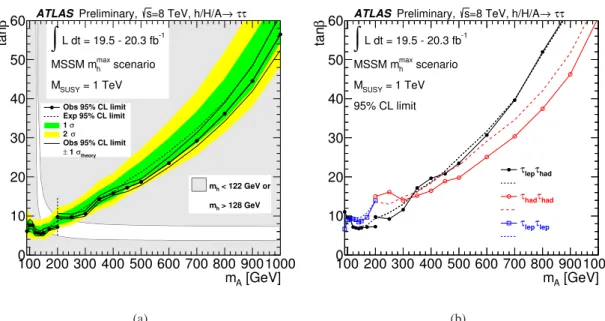
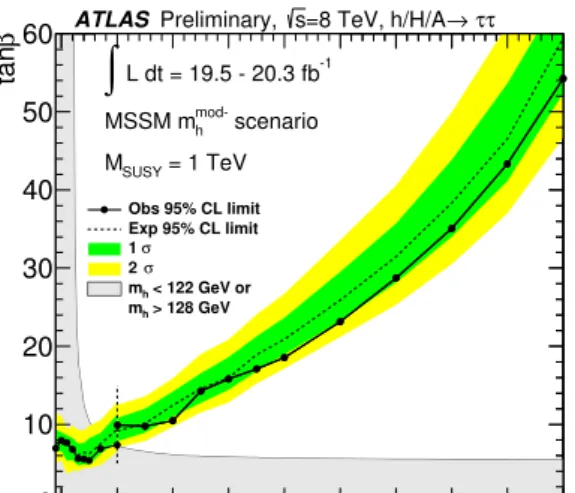
Expected and observed upper limits for the statistical combination of all channels are shown in Fig- ure 6(a) for the MSSM m
maxhscenario with M
SUSY= 1 TeV [32,33]. In this figure, the theoretical MSSM Higgs cross section uncertainties are not included in the reported result, but their impact is shown sep- arately, by recalculating the upper limits again after considering the relevant ± 1σ variations. The upper
5
The definition of the test statistics used in this search is the following:
˜
qµ=
−
2 ln(
L(µ,
θ)/ˆ
L(0,
θ))ˆˆ if ˆ
µ <0
−
2 ln(
L(µ,
θ)/ˆ
L( ˆ
µ,θ))ˆ if 0
≤µˆ
≤µ0 if ˆ
µ > µand
q0=
( −
2 ln(
L(0,
θ)/ˆˆ
L( ˆ
µ,θ))ˆ if ˆ
µ≥0
0 if ˆ
µ <0
where
L(µ, θ) denotes the binned likelihood function,
µis the parameter of interest (i.e. the signal strength parameter), and
θde-
notes the nuisance parameters. The pair ( ˆ
µ,θ) corresponds to the global maximum of the likelihood, whereas (x,ˆ
θ) correspondsˆˆ
to a conditional maximum in which
µis fixed to a given value
x.[GeV]
m
A100 200 300 400 500 600 700 800 9001000
βtan
0 10 20 30 40 50 60
Obs 95% CL limit Exp 95% CL limit
σ 1
σ 2
Obs 95% CL limit
theory
σ
± 1
< 122 GeV or mh
> 128 GeV mh
τ τ
→ h/H/A
=8 TeV, s Preliminary, ATLAS
L dt = 19.5 - 20.3 fb-1
∫
scenario
max
MSSM mh
= 1 TeV MSUSY
(a)
[GeV]
m
A100 200 300 400 500 600 700 800 9001000
βtan
0 10 20 30 40 50 60
τhad
τlep
τhad
τhad
τlep
τlep
τ τ
→ h/H/A
=8 TeV, s Preliminary, ATLAS
L dt = 19.5 - 20.3 fb-1
∫
scenario
max
MSSM mh
= 1 TeV MSUSY
95% CL limit
(b)
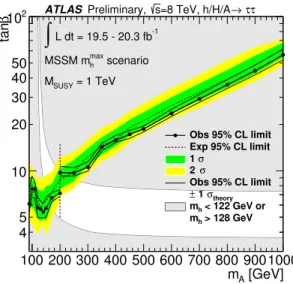
Figure 6: Expected (dashed line) and observed (solid line with markers) 95% CL upper limits on tan β as a function of m
A. Values of tan β above the lines are excluded. The upper limits are shown in (a) for the statistical combination of all channels and in (b) for each channel separately. The vertical dashed line at 200 GeV indicates the transition point between low and high mass categories. The m
A− tan β plane region which is incompatible with a light, CP-even Higgs boson with mass in the range 122–128 GeV is shown as a gray area in (a). For more information, see text.
limits for each channel separately for comparison is shown for the same configuration in Figure 6(b).
The best tan β constraint for the combined search excludes tan β > 5.4 for m
A= 140 GeV. For high mass tan β > 36 is excluded for m
A= 800 GeV. Figure 6(a) shows also the region in the MSSM m
maxhparameter space that is not compatible with a light CP-even Higgs boson with a mass in the range 122–
128 GeV within this model. From this region is is concluded that if the light CP-even Higgs boson of the MSSM is identified with the particle discovered at the LHC, then for this particular MSSM scenario m
A< 160 GeV is excluded for all tan β values and tan β > 10 is excluded for all m
Avalues.
The outcome of the search is further interpreted in the case of a single scalar boson φ with narrow
width relative to the experimental mass resolution produced in either the gluon-fusion or b-associated
production mode and decaying to ττ. Figure 7 shows 95% CL upper limits on the cross section times the
ττ branching fraction based on this interpretation. The exclusion limits for the production cross section
times the branching fraction for a Higgs boson decaying to ττ are shown as a function of the Higgs
boson mass. The excluded cross section times branching fraction values range from σ × BR > 29 pb at
m
φ= 90 GeV to σ × BR > 7.4 pb at m
φ= 1000 GeV for a Higgs boson produced via gluon-fusion. The
exclusion range for the b-associated production mechanism is from σ × BR > 6.4 pb at m
φ= 90 GeV to
σ × BR > 7.2 fb at m
φ= 1000 GeV.
[GeV]
m
φ100 200 300 400 500 600 700 800 9001000
) [pb]ττ→φ BR( ×σ
10
-310
-210
-11 10 10
210
3 ATLAS Preliminary, s=8 TeV τ τ→ φ
-1, L dt = 19.5 - 20.3 fb
∫
gluon-fusion
Obs 95% CL limit Exp 95% CL limit 1 σ
2 σ
(a)
[GeV]
m
φ100 200 300 400 500 600 700 800 9001000
) [pb]ττ→φ BR( ×σ
10
-310
-210
-11 10 10
210
3 ATLAS Preliminary, s=8 TeV τ τ→ φ
-1, L dt = 19.5 - 20.3 fb
∫
b-associated production
Obs 95% CL limit Exp 95% CL limit 1 σ
2 σ