ATLAS-CONF-2014-042 05July2014
ATLAS NOTE
ATLAS-CONF-2014-042
July 4, 2014
Determination of the o ff -shell Higgs boson signal strength in the high-mass ZZ final state with the ATLAS detector
The ATLAS Collaboration
Abstract
The measurement of the ZZ final state in the mass range above the 2m
Zthreshold pro- vides a unique opportunity to measure the off-shell coupling strength of the observed Higgs boson. In this note a determination of the o
ff-shell Higgs boson signal strength in the ZZ
→4 ` and ZZ
→2 ` 2 ν final states is presented. The result is based on the data col- lected by the ATLAS experiment at the LHC, corresponding to an integrated luminosity of 20 . 3 fb
-1at a collision energy of
√s
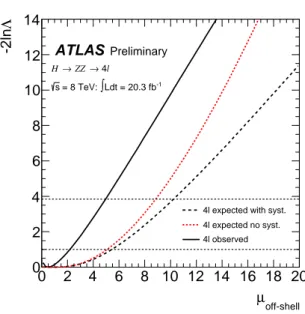
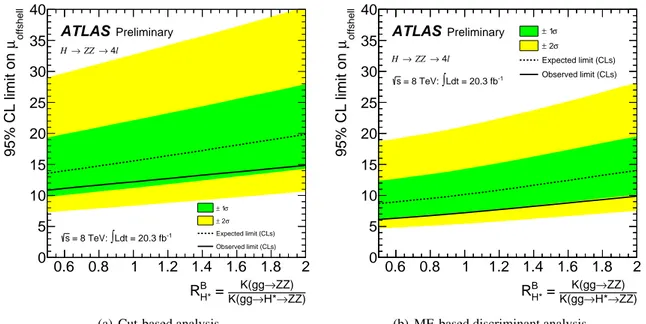
=8 TeV. The 95% confidence level upper CL
slimit on the o
ff-shell signal strength µ
off-shellis in the range 5.6–9.0 when varying the unknown gg
→ZZ background K-factor from higher-order QCD corrections between half and twice the known signal K-factor, with an expected range of 6.6–10.7. Assuming no energy-scale dependence of the relevant Higgs boson couplings, a combination with the on-shell measure- ment of µ
on-shellin the H
→ZZ
→4` channel yields an observed (expected) 95% confidence level upper limit on
ΓH/Γ
SMHin the range 4.8–7.7 (7.0–12.0) under the same variations of the background K-factor.
c Copyright 2014 CERN for the benefit of the ATLAS Collaboration.
Reproduction of this article or parts of it is allowed as specified in the CC-BY-3.0 license.
1 Introduction
The observation of a new particle in the search for the Standard Model (SM) Higgs boson at the LHC, reported by the ATLAS [1] and CMS [2] Collaborations, is a milestone in the quest to understand elec- troweak symmetry breaking. Precision measurements of the properties of the new boson are of critical importance. Among its key properties are the couplings to each of the SM fermions and bosons, for which ATLAS presented results in Refs. [3, 4] and spin
/CP properties, for which ATLAS presented re- sults in Ref. [5].
The studies in Refs. [6–9] have shown that the high-mass o
ff-peak regions of the H
→ZZ and H
→WW channels above the 2m
V(V
=W , Z) threshold have sensitivity to Higgs boson production through off-shell and background interference effects, which presents a novel way of characterising the properties of the Higgs boson in terms of the o
ff-shell signal strength and the associated o
ff-shell Higgs boson couplings. This approach was used by the CMS collaboration [10] to set an indirect limit on the total width.
This note presents an analysis of the o
ff-shell signal strength in the ZZ
→4 ` and ZZ
→2 ` 2 ν final states ( `
=e , µ ). It is structured as follows: Section 2 presents the analysis concept and some key theoretical considerations for this analysis. Section 3 discusses the simulation of the main signal and background processes. Sections 4 and 5 give details for the analysis in the ZZ
→4 ` and ZZ
→2 ` 2 ν final states, respectively. The dominant systematic uncertainties are discussed in Section 6. Finally the results of the ZZ
→4` and ZZ
→2`2ν analysis and their combination are presented in Section 7.
The ATLAS detector is described in Ref. [11]. The present analysis is performed on data correspond- ing to an integrated luminosity of 20 . 3 fb
-1at a collision energy of
√s
=8 TeV.
2 O ff -shell signal and theoretical considerations
The recent interest in the cross section for the o
ff-shell Higgs boson production gg
→(H
∗ →)VV
1, σ
gg→off-shell(H∗→)VVfor high-mass WW and ZZ final states was sparked by the novel approach to Higgs boson couplings measurements possible in this region. This could provide sensitivity to new physics that alters the interactions between the Higgs boson and other fundamental particles in the high-mass region [12–
15].
The cross section for the off-shell signal strength σ
gg→Hoff-shell∗→ZZis proportional to the Higgs boson couplings for production and decay. However, unlike the on-shell Higgs boson production, σ
gg→off-shellH∗→ZZis independent of the total Higgs boson decay width
ΓH[6, 7]. Using the framework of Higgs boson coupling deviations as in Ref. [16] this proportionality can be expressed as:
σ
gg→Hoff-shell∗→ZZσ
gg→off-shell, SMH∗→ZZ =µ
off-shell=κ
2g,off-shell·κ
2V,off-shell, (1) where µ
off-shellis the o
ff-shell signal strength in the high-mass region above the 2m
Zthreshold and κ
g,off-shelland κ
V,off-shellare the off-shell coupling scale factors associated with the gg
→H
∗production and the H
∗→ZZ decay, respectively. The o
ff-shell Higgs boson signal cannot be treated independently from the gg
→ZZ background, as sizeable negative interference e
ffects appear [6]. The interference term is proportional to
õ
off-shell=κ
g,off-shell·κ
V,off-shell.
1In the following the notationgg→(H∗→)ZZis used for the full signal+background process forZZproduction, including the Higgs boson signalgg→H∗→ZZprocess, the continuum backgroundgg→ZZprocess and their interference. For Vector Boson Fusion (VBF) production, the analogous notation VBF (H∗ →)ZZis used for the full signal plus background process, with VBFH∗→ZZrepresenting the Higgs boson signal and VBFZZfor the background.
In contrast, the on-shell process gg
→H
→ZZ allows a measurement of the ratio:
σ
gg→on-shellH→ZZσ
gg→on-shell, SMH→ZZ=
µ
on-shell=κ
g,2on-shell·κ
2V,on-shellΓH
/Γ
SMH, (2)
where the total width
ΓHappears in the denominator. The combination of both on- and o
ff-shell measure- ments promises a significantly higher sensitivity to the total width
ΓHthan previously believed possible at the LHC through direct measurements of the on-shell line shape.
Several theory considerations have to be taken into account for this analysis:
•
The determination of µ
off-shellis valid under the assumption that any new physics which modifies the o
ff-shell couplings κ
2i,off-shelldoes not modify the expectation for the SM backgrounds (includ- ing higher-order QCD and electroweak (EW) corrections to the SM signal and background predic- tions) nor does it produce other sizeable signals in the search region of this analysis unrelated to an enhanced o
ff-shell signal strength. This assumption is similar in structure to the assumptions needed for the Higgs boson coupling scale factor framework in Ref. [16] and a µ
off-shellmeasure- ment should be regarded as a search for a deviation from the SM expectation. The observation of a deviation is independent of any assumptions, but the interpretation of the deviation as a non- standard Higgs boson o
ff-shell coupling relies on the assumption above.
•
The interpretation of µ
off-shellas a measurement of
ΓHrequires a combination with the on-shell signal strength measurements from the
∼125.5 GeV Higgs boson peak. This interpretation is valid under the assumption κ
i,on-shell=κ
i,off-shell. This assumption is particularly relevant to the running of the e
ffective coupling κ
gfor the loop induced gg
→H production process, as it is sensitive to new physics that enters at higher mass scales and could be probed in the high-mass m
ZZsignal region of this analysis. More details are given in Refs. [12–15].
•
While higher-order QCD and EW corrections are known for the o
ff-shell signal process [17] in the form of a next-to-next-to-leading-order (NNLO) K-factor K
H∗(m
ZZ)
=σ
NNLOgg→H∗→ZZ/σ
LOgg→H∗→ZZ, no higher-order QCD calculations are available for the leading-order (LO) gg
→ZZ background process. In Ref. [18] a soft-collinear approximation is used to estimate the next-to-leading-order (NLO) and NNLO corrections to the gg
→WW background process, indicating that the signal K-factor may also be applied to the signal-background interference term at the cost of adding an additional uncertainty of
∼30%. Details can be found in Section 6.
•
Although the NNLO
/LO K-factor K
H∗(m
ZZ) is known for the signal [17] as a function of m
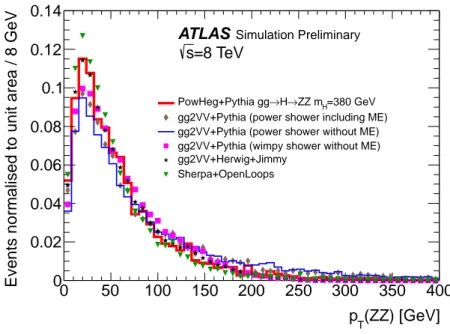
ZZ, it is calculated inclusively, meaning that it is integrated over all jet multiplicities or non-zero p
T(ZZ) values that are induced by the higher order QCD corrections, and may no longer be accurate if event selections which bias the jet multiplicity or transverse momentum p
T(ZZ) are applied.
Consequently, the impact of any direct or indirect selections in jet multiplicity or p
T(ZZ), must be assessed by simulating the additional QCD activity with a parton shower MC to approximate the missing higher order matrix element contributions. This will lead to correspondingly larger acceptance uncertainties.
As a consequence of these considerations, the primary goal of this analysis is to provide a limit on the
o
ff-shell signal strength µ
off-shell. The experimental analysis was designed to be as inclusive as possible
with respect to additional QCD activitity, to minimize additional acceptance-related uncertainties on the
gg
→(H
∗ →)ZZprocess. Finally, results will be given as a function of the K-factor ratio K(gg
→ZZ) / K( gg
→H
∗ →ZZ) to make their dependence on this unknown K-factor explicit. Following
Ref. [18], the central value is obtained with the background K-factor taken from the Higgs boson signal
calculation.
3 Monte Carlo event simulation
The dominant processes contributing to the high-mass signal region in the ZZ
→4 ` and ZZ
→2 ` 2 ν final states are: the gg
→H
∗→ZZ o
ff-shell signal, the gg
→ZZ background, the interference between them, ZZ production through VBF and V H-like production modes pp
→ZZ
+2 j (s-, t- and u-channel) and finally the q q ¯
→ZZ background. In the following a Higgs boson mass of m
H=125 . 5 GeV, close to the ATLAS measured Higgs boson mass value of 125 . 36 GeV [19], is assumed for the signal processes.
However, the expected value for the off-shell production rate is only very weakly dependent on the Higgs boson mass value. The detector simulation for all generated Monte Carlo (MC) event samples is done with Geant4 [20, 21].
3.1 gg → H
∗→ ZZ signal and gg → ZZ background
To generate the gg
→H
∗ →ZZ and gg
→ZZ processes, including the interference, the leading- order MC generators gg2VV [6, 22] and MCFM [8] are used, and they yield identical results. The QCD renormalisation and factorisation scales are set to m
ZZ/ 2 [8]. The CT10 NNLO PDF set [23] is used, as the LO gg
→ZZ process is part of the NNLO calculation for pp
→ZZ. Figure 1 shows the m
4ldistribution for the gg
→(H
∗ →)ZZ →2e2µ processes
2, applying the event selections in the ZZ
→4`
channel (see Section 4) on generator level quantities. For low masses m
ZZ< 2m
Zthe o
ff-shell signal is negligible, while it becomes comparable to the continuum gg
→ZZ background for masses above the 2m
tthreshold. The interference between the gg
→H
∗ →ZZ signal and the gg
→ZZ background is negative over the whole mass range.
The default parton showering and hadronization option for the events processed with the full detector simulation is Pythia8 [25] with the “power shower” parton shower option.
3.1.1 Higher-order QCD corrections
In Ref. [17] the NNLO
/LO K-factor K
H∗(m
ZZ)
=σ
NNLOgg→H∗→ZZ/σ
LOgg→H∗→ZZand associated uncertainties are calculated for the pp
→gg
→H
∗ →ZZ signal
3with m
H ∼125.5 GeV, as a function of the Higgs boson virtuality m
ZZ, using the MSTW2008 PDF set [26]. The K-factor also accounts for NLO EW corrections. This K-factor approximately doubles the expected off-shell signal yield in the high-mass region and is applied to the LO gg
→H
∗ →ZZ MC events after reweighting the K-factor to the CT10 NNLO PDF set which is used for the gg
→H
∗→ZZ MC sample.
For the gg
→ZZ continuum processes, NLO and NNLO QCD calculations are not available. How- ever, the e
ffect of the NLO and NNLO QCD corrections are studied for the WW final state in Ref. [18]
in the soft-collinear approximation, which is considered suitable for the Higgs boson production at high- mass. This approximation to the gg
→WW background process is compared to the same approximation for the gg
→H
→WW signal process, where the full NNLO QCD corrections are available, leading to the conclusion that the signal K-factor may also be applied to the signal-background interference term as an approximation to higher-order QCD corrections. This same approximation should also apply to the ZZ final state and the o
ff-shell Higgs process.
As discussed in Section 2, the results in this note are given as a function of the unknown K-factor ratio K(gg
→ZZ)/K(gg
→H
∗ →ZZ) between the gg
→ZZ background and the gg
→H
∗→ZZ off- shell signal. Ref. [17] considers only the gluon-initiated part K
Hgg∗(m
ZZ) of the full NNLO Higgs boson
2In this illustration, all four lepton final states (2e2µ, 4eand 4µ) are identical, as final state interference effects from same lepton flavours are negligible in the high-mass region [24].
3In the following the shortergg→Xnotation is used also in the context of QCD higher-order calculations whereqgand qqinitial states contribute to the fullpp→gg→Xprocess.
[GeV]
m4l
200 400 600 800 1000
[fb/GeV]4l/dmσd
10-6
10-5
10-4
10-3
10-2
10-1
ZZ (S)
→
→ H*
gg ZZ (B)
→ gg
→) ZZ
→ (H*
gg
off-shell=10) µ ) ZZ (
→
→ (H*
gg
Simulation Preliminary
ATLAS
µ 2 2e
→
→ZZ gg
= 8 TeV s
(a)
[GeV]
m4l
200 400 600 800 1000
[fb/GeV] 4l/dmσd
-0.4 -0.3 -0.2 -0.1
0 0.1 0.2 0.3
10-3
×
ZZ (S)
→
→ H*
gg
) ZZ (Interference)
→
→ (H*
gg
Simulation Preliminary
ATLAS
µ 2 2e
→
→ZZ gg
= 8 TeV s
(b)
Figure 1: (a) Di
fferential cross-sections for the gg
→(H
∗ →)ZZ
→2e2 µ channel at the parton level, for the gg
→H
∗ →ZZ signal (red solid line), gg
→ZZ continuum background (thick brown dotted line), gg
→(H
∗ →)ZZ with SM Higgs coupling (magenta long dashed line) and gg
→(H
∗ →)ZZ with µ
off-shell =10 (blue long dashed line). (b) Di
fferential cross-section as a function of m
4lfor the gg
→H
∗ →ZZ
→2e2µ signal (solid red line) and its interference with the gg
→ZZ
→2e2µ continuum background (black dashed line).
K-factor for the interference term
4. This approach is adopted here for both the interference term and the background, hence the more precise definition for the K-factor ratio above is:
R
BH∗ =K( gg
→ZZ)
K( gg
→H
∗→ZZ)
=K
B(m
ZZ)
K
Hgg∗(m
ZZ) , (3)
where K
B(m
ZZ) is the mass dependent K-factor for the gg
→ZZ background. As the K-factor K
ggH∗(m
ZZ) is almost constant as a function of m
ZZin the relevant region of phase space, no mass dependence on R
BH∗is assumed.
3.1.2 Dependence of o
ff-shell signal and background interference on the signal strength
An event sample MC
gg→(H∗→)ZZ( µ
off-shell) for the gg
→(H
∗ →)ZZ process with an arbitrary value of the off-shell Higgs boson signal strength µ
off-shellcan be constructed from the MC sample for the SM Higgs boson signal gg
→H
∗ →ZZ (MC
SMgg→H∗→ZZ), the gg
→ZZ continuum background MC sample (MC
contgg→ZZ) and a full SM Higgs boson signal plus background gg
→(H
∗ →)ZZMC sample
4Numerically, KHgg∗(mZZ) differs from KH∗(mZZ) by∼2% as the higher-order QCD contribution fromqgandqqproduction is small. However, KHgg∗(mZZ) has substantially larger uncertainties than KH∗(mZZ).
(MC
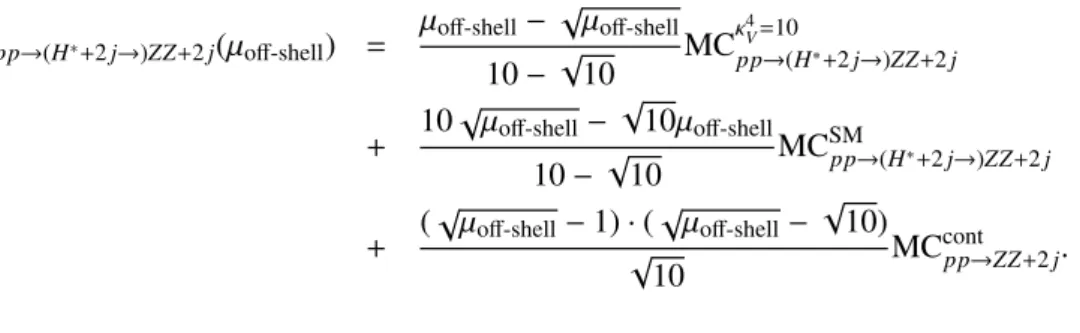
SMgg→(H∗→)ZZ) using the following weighting function:
MC
gg→(H∗→)ZZ( µ
off-shell)
=K
H∗(m
ZZ)
·µ
off-shell·MC
SMgg→H∗→ZZ(4)
+ √K
ggH∗(m
ZZ)
·K
B(m
ZZ)
·µ
off-shell·MC
Interference gg→ZZ+
K
B(m
ZZ)
·MC
contgg→ZZ, MC
Interferencegg→ZZ =
MC
SMgg→(H∗→)ZZ−MC
SMgg→H∗→ZZ−MC
contgg→ZZ, (5) where MC
Interferencegg→ZZ
represents a MC sample for the interference term between signal and background as defined in Equation (5). The K-factors are calculated inclusively without any selections.
As a direct simulation of an interference MC sample is not possible, Equation (5) and R
BH∗are used to obtain:
MC
gg→(H∗→)ZZ(µ
off-shell)
= (K
H∗(m
ZZ)
·µ
off-shell−K
Hgg∗(m
ZZ)
· √R
BH∗·µ
off-shell)
·
MC
SMgg→H∗→ZZ(6)
+K
ggH∗(m
ZZ)
· √R
BH∗ ·µ
off-shell·MC
SMgg→(H∗→)ZZ +K
ggH∗(m
ZZ)
·(
R
BH∗ − √R
BH∗ ·µ
off-shell)
·
MC
contgg→ZZ, 3.2 q q ¯ → ZZ and q q ¯ → WZ background
The q q ¯
→ZZ and q q ¯
→WZ background are simulated with Powheg [27, 28] in NLO QCD using dynamic QCD renormalisation and factorisation scales of m
VZand the CT10 NLO PDF set. Parton showering and hadronization is done with Pythia8. The interference with the q q ¯
→WW process for the 2`2ν final state is neglected [28].
3.2.1 NNLO QCD correction to q q ¯
→ZZ
The cross section for the q q ¯
→ZZ process is calculated in Ref. [29] for two on-shell Z in the final state at NNLO QCD accuracy, which makes this calculation applicable to the high-mass region. This calculation already contains the gg
→ZZ process as part of the NNLO calculation. Excluding the gg
→ZZ component, the cross section in the high-mass region is increased by approximately 4% compared to the NLO calculation.
A di
fferential K-factor in m
ZZwhich can be directly applied to the Powheg NLO q q ¯
→ZZ sample, using dynamic QCD renormalisation and factorisation scales of m
ZZ/ 2 and the CT10 NNLO PDF set, but removing the gg
→ZZ component:
K(m
ZZ)
=σ
NNLOq¯q→ZZ(m
ZZ, µ
=m
ZZ/ 2 , CT10 NNLO)
−σ
LOgg→ZZ(m
ZZ, µ
=m
ZZ/ 2 , CT10 NNLO) σ
NLOq¯q→ZZ(m
ZZ, µ
=m
ZZ, CT10 NLO) , (7) has been calculated by the authors of Ref. [29] and is used for this analysis.
3.2.2 NLO EW corrections
Electroweak higher-order corrections are not taken into account by Powheg or any o
fficially released
generator, but were calculated in Ref. [30, 31] for on-shell outgoing vector bosons and found to be
approximately
−10% in the high-massZZ region of this analysis. These NLO EW corrections are taken
into account in the analysis by reweighting the Powheg events based on the kinematics of the diboson
system. The required quantities are derived from the initial state quarks and the outgoing vector bosons
and a reweighting procedure comparable to that described in Ref. [32] is applied.
3.3 EW ZZ production through VBF and V H-like production modes (s-, t- and u-channel) The EW pp
→ZZ
+2 j processes are simulated using MadGraph5 [33]. The QCD renormalisation and factorisation scales are set to m
Wfollowing the recommendation in Ref. [24] and the CTEQ6L1 PDF set [34] is used. Pythia6 [35] is used for parton showering and hadronisation. Phantom [36] was used as cross-check for MadGraph5 and validation showed good agreement between them in the high-mass region.
The pp
→ZZ
+2 j process contains both VBF-like events and V H-like events. The high-mass range selected by the analysis receives Higgs boson signal induced events through:
•
the o
ff-shell VBF H
→ZZ process (this process scales with κ
V4and is independent of
ΓH),
•
VBF-like ZZ processes with a t-channel Higgs boson exchange (this process scales with κ
4Vand is independent of
ΓH),
•
W H and ZH events with an on-shell Higgs boson, with decays Z
→2` or W
→`ν and H
→2`2 j or H
→`ν 2 j (this process scales with κ
V4/Γ
H).
As the events with an on-shell Higgs boson behave differently from the off-shell events with respect to a measurement of o
ff-shell Higgs boson couplings or the total width, these two populations need to be separated in the analysis by applying a cut on the generated Higgs boson mass
|mgen.H −125.5 GeV| <
1 GeV. In this context the V H events behave more like a background than like a signal. A K-factor of 1.08 is applied to the V H events to scale to the NNLO QCD corrected cross section as in Ref. [16].
3.3.1 Dependence of the o
ff-shell signal and the background interference on the o
ff-shell signal strength
A MC event sample for the EW pp
→(H
∗+2 j
→)ZZ
+2 j process with an arbitrary value of the o
ff-shell Higgs boson signal strength µ
off-shellcan be constructed from a pure pp
→ZZ
+2 j continuum background MC sample, a full SM Higgs boson signal plus background pp
→(H
∗+2 j
→)ZZ+2 j MC sample and a third Higgs boson signal plus background pp
→(H
∗+2 j
→)ZZ
+2 j MC sample with µ
off-shell =κ
4V = ΓH/Γ
SMH =10. Using
ΓH/Γ
SMH =10 for the last sample ensures that the on-shell V H events are generated with SM-like signal strength. Within the context of this analysis µ
off-shell=κ
2g·κ
2V =κ
V4is assumed for the sub-dominant VBF-like component.
The following weighting function is used:
MC
pp→(H∗+2j→)ZZ+2j(µ
off-shell)
=µ
off-shell·MC
SMpp→(H∗+2j→)ZZ+2j(8)
+ õ
off-shell·MC
Interferencepp→ZZ+2j
+
MC
contpp→ZZ+2j,
where the signal and interference samples are implicitly defined through the SM pp
→(H
∗+2 j
→)ZZ
+2 j MC sample
MC
SMpp→(H∗+2j→)ZZ+2j =MC
SMpp→H∗+2j→ZZ+2j+MC
Interferencepp→ZZ+2j+
MC
contpp→ZZ+2j(9) and a µ
off-shell=10 MC sample:
MC
κ4 V=10
pp→(H∗+2j→)ZZ+2j =
10
·MC
SMpp→H∗+2j→ZZ+2j+ √10
·MC
Interferencepp→ZZ+2j+
MC
contpp→ZZ+2j. (10)
Solving for the generated MC samples yields:
MC
pp→(H∗+2j→)ZZ+2j( µ
off-shell)
=µ
off-shell− √µoff-shell10
− √10 MC
κ4 V=10
pp→(H∗+2j→)ZZ+2j
(11)
+10
õ
off-shell− √10µ
off-shell10
− √10 MC
SMpp→(H∗+2j→)ZZ+2j +(
õ
off-shell−1)
·(
õ
off-shell− √√
10)
10 MC
contpp→ZZ+2j.
4 Analysis in the ZZ → 4 ` final state
4.1 Event selection and background estimations
The analysis in the ZZ
→4 ` channel follows closely the Higgs boson measurements in the same final states in Ref. [19], with the same event selections in the off-peak region of 220 GeV < m
4`< 1000 GeV. To avoid the dependence of the gg
→ZZ kinematics on higher-order QCD e
ffects, the analysis is performed inclusively, ignoring the number of jets in the events. The analysis is split into the same 4 lepton final states (2µ2e, 2e2µ, 4e, 4µ) as in Ref. [19]. The same background estimation procedures are applied for the q q ¯
→ZZ
→4 ` and reducible backgrounds.
To enhance the sensitivity, a matrix element based kinematic discriminant (ME-based discriminant) is used, exploiting the full kinematics in the centre-of-mass frame of the 4` system, to be discussed in Section 4.2. For the nominal result, a binned maximum likelihood fit to the ME-based discriminant distribution is performed. As a cross-check, a cut-and-count analysis is also performed, by counting events in an enriched signal region, defined to be 400 GeV < m
4`< 1000 GeV.
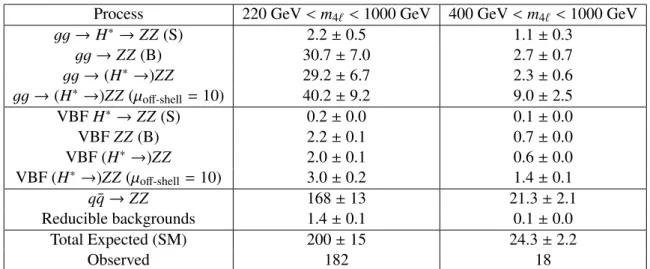
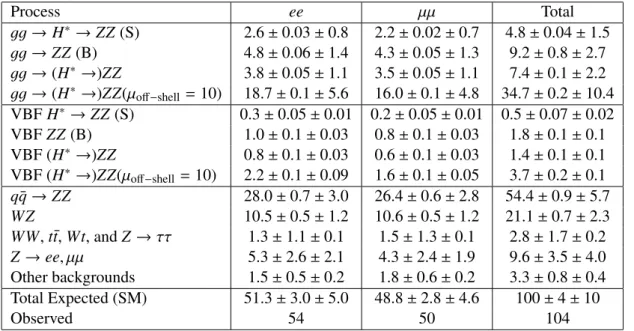
Table 1 shows the expected number of events for the signal and background processes in the inclusive o
ff-peak region and the cut-based signal region. In both regions data are found to be consistent with the SM expectation. The dominant background comes from the q q ¯
→ZZ process. The contribution of reducible backgrounds, such as Z+jets and top-quark production, is only about 0.5% of the total background in the full o
ff-peak region and in the signal-enriched region. These backgrounds are not included in the final analysis.
4.2 Matrix element based kinematic discriminant
A matrix element based discriminant is constructed to enhance the sensitivity to the gg
→H
∗ →ZZ signal in the o
ff-shell region, with respect to the gg
→ZZ and q q ¯
→ZZ backgrounds. It fully ex- ploits the event kinematics in the centre-of-mass frame of the 4 ` system, based on eight observables:
{m4`
, m
Z1, m
Z2, cos θ
1, cos θ
2, φ, cos θ
∗, φ
1}, defined in Ref. [19]. These observables are used to create thefour-momenta of the leptons and incoming partons, which are then used to calculate matrix elements for di
fferent processes, provided by the MCFM program [8]. The following matrix elements are calculated for each event:
•
P
q¯q: matrix element for the q q ¯
→ZZ
→4 ` process,
•
P
gg: matrix element for the gg
→(H
∗ →)ZZ
→4 ` process including the Higgs boson (m
H =125.5 GeV) with SM couplings, continuum background and their interference,
•
P
H: matrix element for for the gg
→H
∗→ZZ
→4 ` process (m
H=125 . 5 GeV).
Process 220 GeV < m
4`< 1000 GeV 400 GeV < m
4`< 1000 GeV
gg
→H
∗→ZZ (S) 2.2
±0.5 1.1
±0.3
gg
→ZZ (B) 30.7
±7.0 2.7
±0.7
gg
→(H
∗→)ZZ29.2
±6.7 2.3
±0.6
gg
→(H
∗→)ZZ ( µ
off-shell=10) 40.2
±9.2 9.0
±2.5
VBF H
∗→ZZ (S) 0.2
±0.0 0.1
±0.0
VBF ZZ (B) 2.2
±0.1 0.7
±0.0
VBF (H
∗→)ZZ2.0
±0.1 0.6
±0.0
VBF (H
∗→)ZZ ( µ
off-shell=10) 3.0
±0.2 1.4
±0.1
q q ¯
→ZZ 168
±13 21.3
±2.1
Reducible backgrounds 1.4
±0.1 0.1
±0.0
Total Expected (SM) 200
±15 24.3
±2.2
Observed 182 18
Table 1: Expected and observed number of events in the ZZ
→4` channel in the full off-peak region (220 GeV < m
4`< 1000 GeV) and the cut-based analysis signal region (400 GeV < m
4`< 1000 GeV).
The reducible background includes contributions from the Z
+jets and top quark processes. The expected events for the gg
→(H
∗ →)ZZand VBF (H
∗ →)ZZprocesses, including the Higgs boson signal, background and interference, are reported for both the SM predictions and µ
off-shell =10. A relative gg
→ZZ background K-factor of R
BH∗=1 is assumed. The uncertainties in the number of expected events include the statistical uncertainties from MC samples and systematic uncertainties.
The kinematic discriminant is defined as in Ref. [8]:
ME
=log
10(
P
HP
gg+c
·P
q¯q ), (12)
where c is an empirical constant, chosen to be 0.1, to approximately balance the overall cross-sections of the q q ¯
→ZZ and gg
→(H
∗ →)ZZprocesses. The value of c has a very small effect on the overall sensitivity.
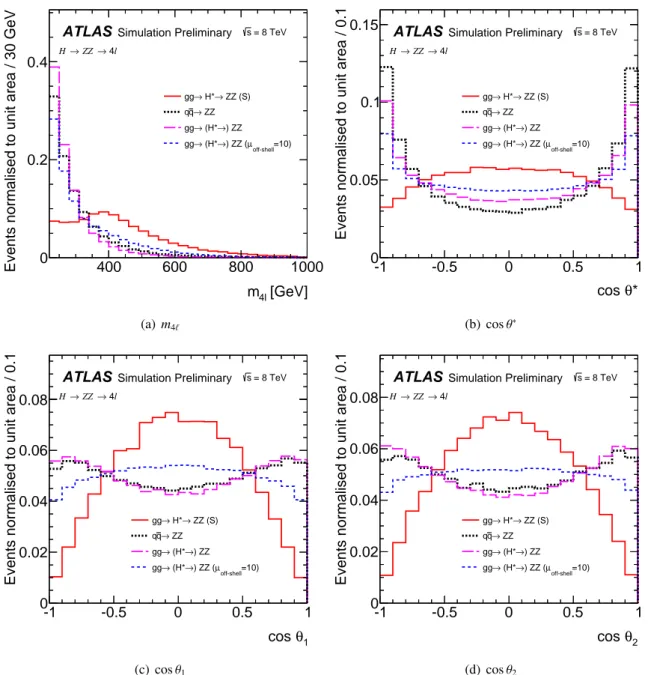
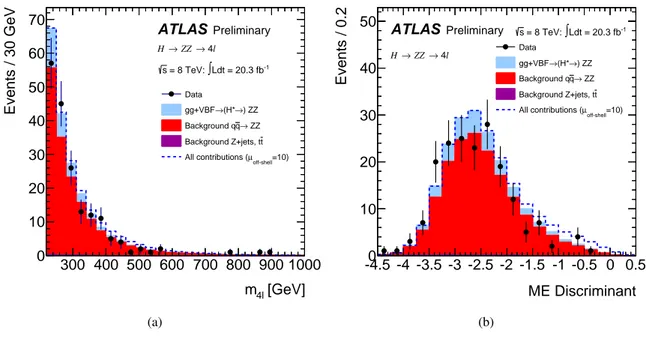
Figure 2 shows the shape comparisons of the key input variables to the ME-based discriminant:
{m
4`, cos θ
1, cos θ
2and cos θ
∗}, for the full off-peak region (220 GeV< m
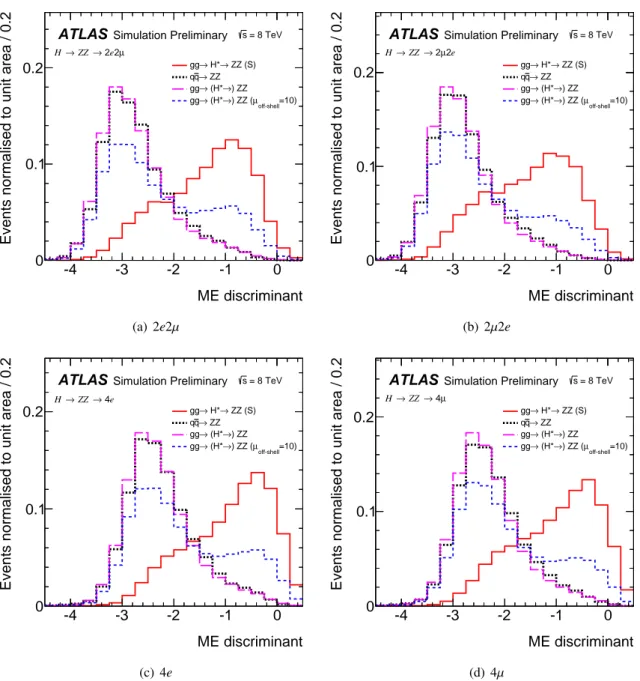
4`< 1000 GeV). Figure 3 shows the shape comparisons of the ME-based discriminant for the gg
→H
∗ →ZZ signal, q q ¯
→ZZ background, gg
→(H
∗→)ZZ with SM µ
off-shelland gg
→(H
∗→)ZZ with µ
off-shell=10, for the full o
ff-peak region (220 GeV < m
4`< 1000 GeV). The gg
→H
∗ →ZZ signal events have on average larger ME-based discriminant values, compared to the q q ¯
→ZZ background and the gg
→ZZ background dominated gg
→(H
∗ →)ZZ events. The gg
→(H
∗ →)ZZ events with µ
off-shell=10 have a double-peak structure.
The peak around -2.5 corresponds to the gg
→ZZ background component, while the peak around -0.5 corresponds mainly to the gg
→H
∗ →ZZ component. Events with ME-based discriminant values between -4.5 and 0.5 are used in the final analysis.
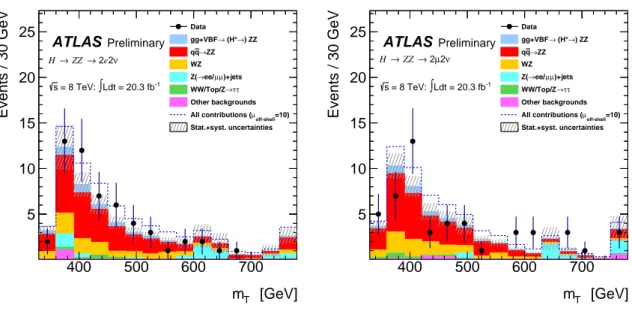
5 Analysis in the ZZ → 2 ` 2 ν final state
The analysis in the ZZ
→2`2ν channel follows similar strategies to those used in the invisible Higgs boson search in the ZH channel [37]. The definitions of the reconstructed physics objects
5are identical, but some of the kinematic cuts have been optimised for the current analysis, as described below.
5For theZZ →2`2νanalysis electrons, muons, jets, missing transverse momentum, and track-based missing transverse momentum are used.
[GeV]
m4l
400 600 800 1000
Events normalised to unit area / 30 GeV 0 0.2 0.4
ZZ (S)
→
→ H*
gg
→ ZZ q q
→) ZZ
→ (H*
gg
off-shell=10) µ ) ZZ (
→
→ (H*
gg
Simulation Preliminary
ATLAS
4l
→
→ZZ H
= 8 TeV s
(a)m4`
θ* cos
-1 -0.5 0 0.5 1
Events normalised to unit area / 0.1
0 0.05 0.1 0.15
ZZ (S)
→
→ H*
gg
→ ZZ q q
→) ZZ
→ (H*
gg
off-shell=10) µ ) ZZ (
→
→ (H*
gg
Simulation Preliminary
ATLAS
4l
→
→ZZ H
= 8 TeV s
(b) cosθ∗
θ1
cos
-1 -0.5 0 0.5 1
Events normalised to unit area / 0.1
0 0.02 0.04 0.06 0.08
ZZ (S)
→
→ H*
gg
→ ZZ q q
→) ZZ
→ (H*
gg
off-shell=10) µ ) ZZ (
→
→ (H*
gg
Simulation Preliminary
ATLAS
4l
→
→ZZ H
= 8 TeV s
(c) cosθ1
θ2
cos
-1 -0.5 0 0.5 1
Events normalised to unit area / 0.1
0 0.02 0.04 0.06 0.08
ZZ (S)
→
→ H*
gg
→ ZZ q q
→) ZZ
→ (H*
gg
off-shell=10) µ ) ZZ (
→
→ (H*
gg
Simulation Preliminary
ATLAS
4l
→
→ZZ H
= 8 TeV s
(d) cosθ2
Figure 2: Distributions of the key input variables to the ME-based discriminant, for all lepton final states combined, normalised to unit area for shape comparisons, for the full o
ff-peak region (220 GeV < m
4`<
1000 GeV). The thick black dotted line represents the q q ¯
→ZZ background, the red solid line the
gg
→H
∗→ZZ signal with SM couplings, the magenta long-dashed line the gg
→(H
∗→)ZZ with SM
µ
off-shell, and the blue dashed line is for gg
→(H
∗→)ZZ with µ
off-shell=10.
ME discriminant
-4 -3 -2 -1 0
Events normalised to unit area / 0.2
0 0.1
0.2 gg→ H*→ ZZ (S)
→ ZZ q q
→) ZZ
→ (H*
gg
off-shell=10) µ ) ZZ (
→
→ (H*
gg
Simulation Preliminary
ATLAS
µ 2 2e
→
→ZZ H
= 8 TeV s
(a) 2e2µ
ME discriminant
-4 -3 -2 -1 0
Events normalised to unit area / 0.2
0 0.1
0.2 ggqq→→ H* ZZ→ ZZ (S)
→) ZZ
→ (H*
gg
off-shell=10) µ ) ZZ (
→
→ (H*
gg
Simulation Preliminary
ATLAS
2e µ
→ 2
→ZZ H
= 8 TeV s
(b) 2µ2e
ME discriminant
-4 -3 -2 -1 0
Events normalised to unit area / 0.2
0 0.1
0.2 gg→ H*→ ZZ (S)
→ ZZ q q
→) ZZ
→ (H*
gg
off-shell=10) µ ) ZZ (
→
→ (H*
gg
Simulation Preliminary
ATLAS
4e
→
→ZZ H
= 8 TeV s
(c) 4e
ME discriminant
-4 -3 -2 -1 0
Events normalised to unit area / 0.2
0 0.1
0.2 ggqq→→ H* ZZ→ ZZ (S)
→) ZZ
→ (H*
gg
off-shell=10) µ ) ZZ (
→
→ (H*
gg
Simulation Preliminary
ATLAS
µ
→ 4
→ZZ H
= 8 TeV s
(d) 4µ
Figure 3: Distributions of the ME-based discriminant in the four lepton final states normalised to unit
area to show the shape comparisons, for the full off-peak region (220 GeV < m
4`< 1000 GeV). The
thick black dotted line represents the q q ¯
→ZZ background, the red solid line the gg
→H
∗→ZZ signal
with SM couplings, the magenta long-dashed line the gg
→(H
∗ →)ZZwith SM µ
off-shell, and the blue
dashed line is for gg
→(H
∗→)ZZwith µ
off-shell=10.
As the neutrinos in the final state do not allow for a kinematic reconstruction of the mass m
ZZ, the transverse mass (m
T) reconstructed from the momentum of the di-lepton system (p
``T) and the magnitude of the missing transverse momentum (E
Tmiss):
m
2T ≡[ √m
2Z+|−→p
``T|2+√
m
2Z+|→−E
missT |2]2
−[
−
→
p
``T +→−E
missT]2
, (13)
is chosen as the discriminating variable to enhance sensitivity to the gg
→H
∗→ZZ signal.
The analysis cuts are optimised to maximize the signal significance with respect to the main back- grounds ZZ, WZ, WW , top-quark events, and W / Z
+jets as described in Section 5.1. The selection cuts are also chosen to minimize the contributions of systematic uncertainties arising from the jet kinematics.
After the optimisation, the following event selection is adopted (any requirements not listed here are identical to those used in Ref [37]):
•
Opposite-charge di-electron or di-muon in the Z mass window (76 < m
``< 106 GeV),
•
No third lepton (e or µ ) identified in the event using looser identification criteria for the electrons and a lower p
Tthreshold of 7 GeV,
•
E
missT> 150 GeV,
•
350 GeV < m
T< 1000 GeV,
•
b-jet [38] veto (p
T> 20 GeV,
|η|< 2.5),
•
Requirement on the fractional p
Tdi
fference:
→−
E
missT +∑jet
−
→
p
jetT −p``T/ p
``T< 0.3, (14) where
→−p
jetTis the 2-dimensional vector of the jet momentum in the transverse plane,
•