A TLAS-CONF-2010-049 28 July 2010
ATLAS NOTE
ATLAS-CONF-2010-049
July 17, 2010
Measurement of di ff erential cross section and fragmentation of jets from tracks in proton-proton collisions at center-of-mass energy √
s = 7 TeV with the ATLAS detector
The ATLAS Collaboration
Abstract
Jets are identified and their properties studied using tracks measured by the ATLAS
Inner Detector. Events are selected using a minimum-bias trigger, allowing the emergence
of jets at low transverse momentum to be observed and for jets to be studied independently
of the calorimeter. Jets are reconstructed using the anti-k t algorithm applied to tracks with
two parameter choices, 0.4 and 0.6. An inclusive jet transverse momentum cross section
measurement from 4 GeV to 80 GeV is shown, integrated over | η | < 0.57 and corrected
to charged particle-level truth jets. The probability that a particular particle carries a given
fraction of the jet momentum (fragmentation function) is also measured. Comparison with
the theoretical models implemented in existing tunings of Monte Carlo event generators with
the data indicates reasonable overall agreement between data and Monte Carlo; areas where
these tunings could be improved are indicated.
1 Introduction
QCD predicts the existence of high p T jets in pp collisions. The emergence of these jets from the soft in- teractions that characterize most of the pp inelastic cross section indicates that the scattering has reached a momentum transfer where the interaction can be described in terms of hard scattering, perturbative pro- cesses. In this note, the production cross section and fragmentation function of jets produced at the lowest observable transverse momenta are measured. These jets are reconstructed with an anti-k t algorithm [1]
using charged particle tracks measured in the ATLAS 2010 run at √
s = 7 TeV. The jet momentum and track fragmentation distributions are corrected back to the level of “charged particle jets.” The proper- ties of these charged particle jets are not directly comparable to any non-perturbative QCD calculation;
however, they can be compared to the phenomenological models of jet production and fragmentation that are implemented in Monte Carlo generators. Jets are reconstructed using the anti-k t algorithm al- gorithm, with parameter R of 0.4 and 0.6. Charged particle jets at truth level are formed by applying the jet algorithm to all primary charged particles with transverse momentum p T > 500 MeV. Primary charged particles are defined as charged particles with a mean lifetime τ > 0.3 × 10 − 10 s produced in pp interactions or from subsequent decays of particles with a shorter lifetime.
Studies of track jets provide a complement to calorimeter-based measurements, with results indepen- dent of calorimeter calibrations and selections. Systematic uncertainties are also independent of those in the calorimeter, and measurement is possible down to very low momentum, allowing the emergence of jets from minimum bias events to be studied.
The charged particle differential jet cross section is measured as a function of transverse momentum for | η | < 0.57. 1 Fragmentation distributions of charged particles in these jets are also measured in bins of jet p T . The momentum distribution of tracks inside a jet is given by the fragmentation function f (z) defined as the probability that a particle carries fraction z of the jet momentum. The z distribution discussed here differs from the usual definition, because the total momentum is the sum over charged particles with p T > 500 MeV only.
2 The ATLAS Inner Detector
The ATLAS Inner Detector [2] provides precise track reconstruction over pseudorapidity | η | < 2.5. In the barrel, it consists of three layers of pixel detectors close to the beam-pipe, four layers of silicon microstrip detectors (SCT) providing eight hits per track at intermediate radii, and a transition radiation tracker (TRT) at the outer radii, providing about 35 hits per track.
3 Run and Event Selection
This analysis uses data from an initial period of ATLAS running with total luminosity of about 370 µb − 1 . Luminosities are calibrated using the Van-der-Meer method of scanning the beams against each other in the horizontal and vertical planes [3]. The systematic uncertainty is 11% which is dominated by the uncertainty on the beam currents.
The events in the sample are triggered during LHC stable beams using the Minimum-Bias-Trigger- Scintillators (MBTS) [2], which cover the pseudorapidity range, 2.09 < | η | < 3.84, and are located in front of the end-cap electromagnetic calorimeters; at least one MBTS hit is required. Events are selected for which the tracker recorded data with high quality and the solenoidal field was at its nominal
1
The pseudorapidity η is defined by η = − log (tan(θ/2)) where the coordinate system is the usual ATLAS coordinate system:
a right handed system with x pointing to the centre of the LHC ring and y pointing vertically upwards. θ is the angle between
the particle direction and the z axis which points along the beam towards Lake Geneva. φ is the polar angle: φ = 0 corresponds
to the centre of the LHC ring.
value. The trigger was not prescaled during this period of initial running, and the number of events with multiple proton-proton collisions was minimal. A primary vertex was also required to be selected. A total of 19,861,249 events satisfy the selection criteria.
The efficiencies of the trigger and vertex requirements were determined from data for events of interest to this analysis. The efficiency of the trigger was measured by identifying randomly-triggered events with a selected offline jet, then determining the fraction of these events that passed the trigger requirements. The efficiency of the vertex requirement was determined by replacing the primary vertex requirement (Section 5) for tracks with a requirement with respect to the average beam spot, then building jets from these alternatively selected tracks and determining the fraction of events with one or more jets that also had a reconstructed primary vertex. For both trigger and vertex finding selections, the efficiency was negligibly different from 100%.
4 Monte Carlo samples
The baseline Monte Carlo simulated sample uses Pythia with the ATLAS MC09 tuning, which has sat- isfactory agreement with the inclusive track transverse momentum and multiplicity distributions [4, 5].
Other Pythia tunings are used for comparison in order to explore the sensitivity to underlying event and fragmentation parameters [6, 7, 8]. Tunes 100, 110, 117 and 129 use the Q 2 ordered showers (“old showering”), while the ATLAS MC09 tune and tune 320 (Perugia-0) use p T ordered showers (“new showering”). Tunes 110 and 117 use the “Professor” machinery [9] to fit the LEP fragmentation data but differ in the color reconnection model. Tune 100 is a fit to the Tevatron data (Tune A of R. Field [10]).
A new Pythia tune, AMBT1 [11], is fit to ATLAS minimum bias data. Additionally samples from Pythia 8 [12] and Phojet are used with their default settings. The event samples used include the ND (non- diffractive), SD (single-diffractive) and DD (double-diffractive) components that are added with the rates given by the event generators. However as Pythia 6 does not have a hard scattering component in its SD and DD, there are very few jets from these components. This is in contrast to Phojet and Pythia 8 which do have hard scattering components in the diffractive samples.
In order to validate the momentum spectrum unfolding (Section 6.1) and to determine systematic uncertainties (Section 7), for each tune, an ensemble of samples – each with the same number of events as the data – are required. Because full simulation of so many events is impractical, a toy smearing mechanism is used. The tracking efficiency and the resolution in 1/p T are determined in bins of η and 1/p T using the baseline Monte Carlo sample. For each generator tune, a large number of events (250M-500M) are simulated; particles in these events are vetoed or smeared according to the determined efficiency and resolution. This sample is then divided into statistically independent sets, each of which is the same size as the real data. The distributions of unfolding results from these statistically independent samples are used to evaluate any potential bias in the unfolding and the validity of the quoted uncertainty on the central value.
5 Track selection
Tracks are reconstructed using the silicon-seeded tracking algorithm [13] and extrapolated to the TRT.
They are required to have:
• Transverse momentum p T > 500 MeV
• Pseudorapidity | η | < 1.9 (although tracks in selected jets will have more central η; see Section 6)
• Transverse impact parameter with respect to the primary vertex | d 0 | < 1.5 mm
• Longitudinal impact parameter with respect to the primary vertex z 0 satisfying | z 0 sinθ | < 1.5 mm (z 0 sinθ corresponds to the projection of z 0 to the plane transverse to the track direction.)
• At least 1 pixel B-layer hit and one additional pixel detector hit
• At least 6 SCT hits
In order to suppress high-momentum tracks with significantly mismeasured curvature, an additional requirement is made: a hit must be present in either the outermost pixel layer or the innermost SCT layer.
This cut removes a larger proportion of tracks with p T > 25 GeV in data than it does in Monte Carlo.
There are two extreme explanations of this disagreement in the ratio of vetoed to selected tracks, which are accounted for in a systematic uncertainty. The first is that the number of significantly mismeasured, but accepted, tracks scales up in proportion to the number of vetoed tracks. The second possibility is that all the vetoed tracks represent an uncorrected loss of efficiency for well-measured high- p T tracks. In this case, the proportion of tracks lost is simply the difference between vetoed-to-selected track ratios. A systematic error is assigned to these possibilities in Section 7.
Tracking efficiencies are determined from Pythia 6 ATLAS MC09 non-diffractive Monte Carlo with full Geant 4 simulation. Studies[4, 5] of the minimum bias events have determined that the ATLAS pixel and SCT detectors are well modeled by the simulation. While the simulation qualitatively agrees with the data, there are differences in the response which are accounted for in the estimate of systematic uncertainty on the track finding efficiency, as discussed in Section 7.
The impact on tracking efficiency due to track density inside jets is negligible for the jet momenta considered here, because the typical distance between tracks in the core of the jets is still far larger than the granularity of the silicon detectors. It has been verified from Monte Carlo simulation that this effect begins to impact tracking efficiency only for charged particle jets with p T above 100 GeV.
6 Analysis
Jets are produced from selected tracks by applying the anti-k t algorithm with parameter R of 0.4 and 0.6.
The pion mass is assumed for all tracks in the application of the algorithm. Jets are required to have p T > 4 GeV and | η | < 0.57; the latter cut ensures that all potential constituent tracks are contained in the acceptance for all four layers of the SCT barrel ( | η | < 1.17). A total of 1,361,526 (820,084) jets are found in the data sample for R = 0.6 (0.4).
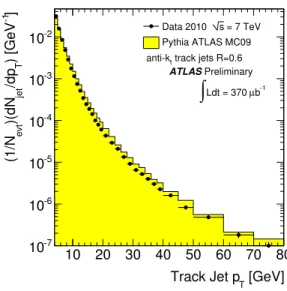
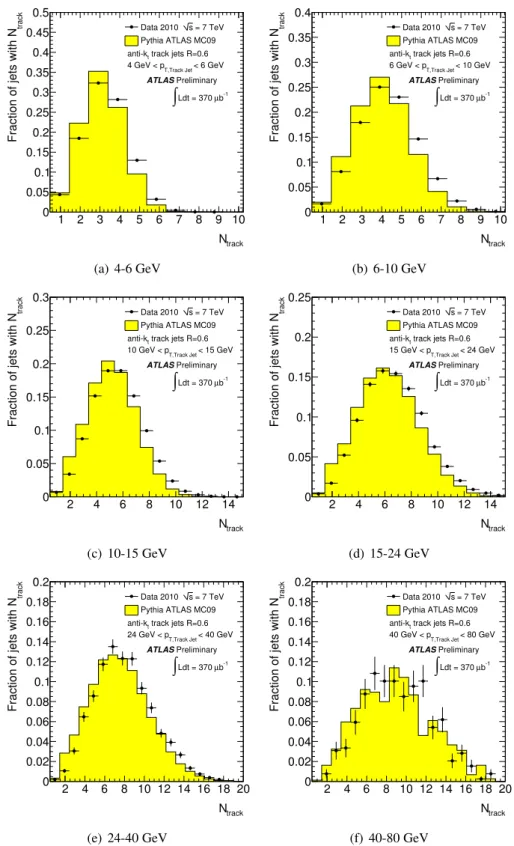
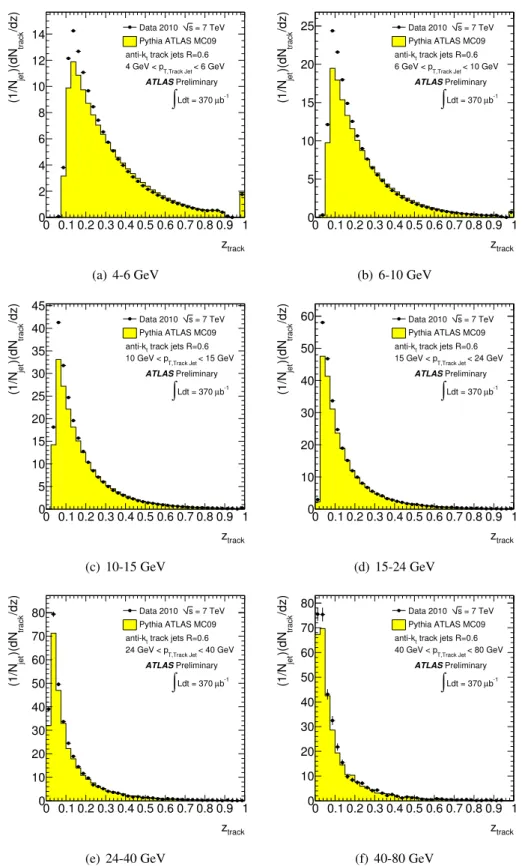
Uncorrected reconstructed distributions for R = 0.6 are presented in Figures 1 to 3 and compared with Pythia MC09 tune and the ATLAS simulation. Figure 1 shows the track jet momenta, normalized to the number of selected events. Figure 2 shows the distribution of track multiplicity in jets in bins of jet p T . These show that the number of tracks increases with jet p T as expected. Figure 3 shows raw z distributions for various ranges of jet p T . The mean value of z falls as the jet p T rises, reflecting the effect of QCD radiation.
6.1 Unfolding Procedure
The unfolding procedure corrects for jet-finding efficiency, reconstructed track jets not matched to a charged particle jet, and bin-to-bin migration of reconstructed jets due to tracking efficiency and resolu- tion smearing. The ATLAS MC09 tune is used to derive the baseline corrections; charged particle jets are matched to reconstructed track jets by requiring ∆R < 0.3.
The first step applies a scaling correction to account for reconstructed track jets with no matching
charged particle jet. This correction is approximately 14% at the lowest jet p T and decreases rapidly with
[GeV]
Track Jet p
T10 20 30 40 50 60 70 80 ]
-1) [GeV
T/dp
jet)(dN
evt(1/N
10
-710
-610
-510
-410
-310
-2ATLASPreliminary b-1
µ Ldt = 370
∫
track jets R=0.6 anti-kt
= 7 TeV s Data 2010 Pythia ATLAS MC09
Figure 1: The uncorrected transverse momentum distribution of anti-k t track jets with R = 0.6. The jets are required to have | η | < 0.57, which corresponds to tracks with | η | < 1.17, ensuring that all tracks used in jets are within the acceptance of all four SCT barrel layers. The Pythia Monte Carlo simulation prediction shows the raw value after detector simulation, and is normalized to the same area as the data.
jet p T , to about 1% by 20 GeV. A systematic uncertainty associated with this correction is discussed in Section 7.
Efficiencies and bin-to-bin migration are corrected via the Bayesian Iterative Unfolding algorithm [14]
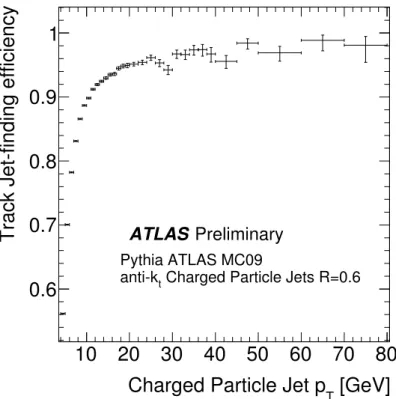
as implemented by the RooUnfold package [15]; based on performance of the unfolding algorithm ap- plied to toy samples, one iteration was chosen as sufficient to correct the spectrum while avoiding com- pounded uncertainties. The track-jet finding efficiency, given a charged particle jet of a given momentum, is shown in Figure 4. It rises rapidly with p T up to 25 GeV, and increases more slowly at higher momenta.
The performance of the unfolding procedure is checked by applying unfolding to an ensemble of toy Monte Carlo samples. The pulls obtained in these results have a mean consistent with zero and a width consistent with one.
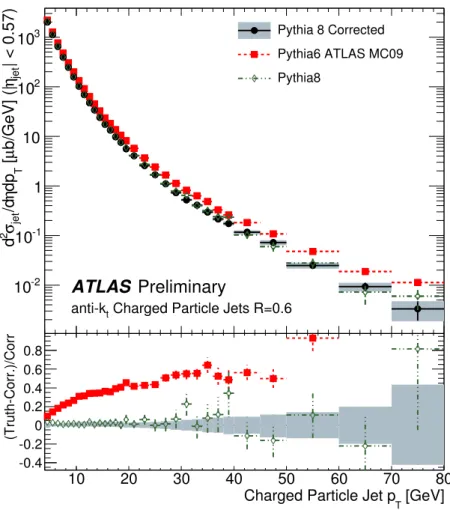
An additional global test of the unfolding procedure is obtained by applying the corrections derived from the baseline Pythia 6 sample to unfolding a fully simulated Pythia 8 sample. The agreement of the differential cross section between the unfolded Pythia 8 simulation and the original Pythia 8 truth is shown in Figure 5 for R = 0.6. They agree within the applicable statistical and systematic uncertainties except in the two lowest p T bins where the deviation is a factor of two larger than the uncertainty.
Because the dominant uncertainty due to tracking efficiency is not included, this demonstrates that any uncertainty due to the unfolding procedure is small compared with the total systematic uncertainty.
Bin-by-bin correction factors were used for the f(z), scaling from the track z within a reconstructed track jet to the charged particle distribution in a truth jet. Corrections were made in ranges of jet p T : 4-6 GeV, 6-10 GeV, 10-15 GeV, and 15-24 GeV.
7 Systematic Uncertainties
Systematic uncertainties for tracking efficiency and fragmentation/underlying event apply to both the
cross section and fragmentation measurements. These uncertainties are computed by producing an en-
semble of toy Monte Carlo samples of the same size as the dataset and unfolding each one – always
track
N 1 2 3 4 5 6 7 8 9 10
track
Fraction of jets with N
0 0.05 0.1 0.15 0.2 0.25 0.3 0.35 0.4 0.45 0.5
ATLASPreliminary b-1
Ldt = 370 µ
∫
track jets R=0.6 anti-kt
< 6 GeV
T,Track Jet
4 GeV < p
= 7 TeV s Data 2010 Pythia ATLAS MC09
(a) 4-6 GeV
track
N 1 2 3 4 5 6 7 8 9 10
track
Fraction of jets with N
0 0.05 0.1 0.15 0.2 0.25 0.3 0.35 0.4
ATLASPreliminary b-1
Ldt = 370 µ
∫
track jets R=0.6 anti-kt
< 10 GeV
T,Track Jet
6 GeV < p
= 7 TeV s Data 2010 Pythia ATLAS MC09
(b) 6-10 GeV
track
N
2 4 6 8 10 12 14
track
Fraction of jets with N
0 0.05 0.1 0.15 0.2 0.25 0.3
ATLASPreliminary b-1
µ Ldt = 370
∫
track jets R=0.6 anti-kt
< 15 GeV
T,Track Jet
10 GeV < p
= 7 TeV s Data 2010 Pythia ATLAS MC09
(c) 10-15 GeV
track
N
2 4 6 8 10 12 14
track
Fraction of jets with N
0 0.05 0.1 0.15 0.2 0.25
ATLASPreliminary b-1
µ Ldt = 370
∫
track jets R=0.6 anti-kt
< 24 GeV
T,Track Jet
15 GeV < p
= 7 TeV s Data 2010 Pythia ATLAS MC09
(d) 15-24 GeV
track
N 2 4 6 8 10 12 14 16 18 20
track
Fraction of jets with N
0 0.02 0.04 0.06 0.08 0.1 0.12 0.14 0.16 0.18 0.2
ATLASPreliminary b-1
µ Ldt = 370
∫
track jets R=0.6 anti-kt
< 40 GeV
T,Track Jet
24 GeV < p
= 7 TeV s Data 2010 Pythia ATLAS MC09
(e) 24-40 GeV
track
N 2 4 6 8 10 12 14 16 18 20
track
Fraction of jets with N
0 0.02 0.04 0.06 0.08 0.1 0.12 0.14 0.16 0.18 0.2
ATLASPreliminary b-1
µ Ldt = 370
∫
track jets R=0.6 anti-kt
< 80 GeV
T,Track Jet
40 GeV < p
= 7 TeV s Data 2010 Pythia ATLAS MC09
(f) 40-80 GeV
Figure 2: Number of tracks per reconstructed track jet with R = 0.6 for various jet p T ranges as indicated.
These data are not corrected. Differences between data and Pythia MC09 in the number of tracks per jet
are accounted for in the fragmentation/underlying event systematic described in Section 7.
track
z 0 0.1 0.2 0.3 0.4 0.5 0.6 0.7 0.8 0.9 1 /dz)
track)(dN
jet(1/N
0 2 4 6 8 10 12 14
ATLASPreliminary b-1
µ Ldt = 370
∫
track jets R=0.6 anti-kt
< 6 GeV
T,Track Jet
4 GeV < p
= 7 TeV s Data 2010 Pythia ATLAS MC09
(a) 4-6 GeV
track
z 0 0.1 0.2 0.3 0.4 0.5 0.6 0.7 0.8 0.9 1 /dz)
track)(dN
jet(1/N
0 5 10 15 20 25
ATLASPreliminary b-1
µ Ldt = 370
∫
track jets R=0.6 anti-kt
< 10 GeV
T,Track Jet
6 GeV < p
= 7 TeV s Data 2010 Pythia ATLAS MC09
(b) 6-10 GeV
track
z 0 0.1 0.2 0.3 0.4 0.5 0.6 0.7 0.8 0.9 1 /dz)
track)(dN
jet(1/N
0 5 10 15 20 25 30 35 40 45
ATLASPreliminary b-1
µ Ldt = 370
∫
track jets R=0.6 anti-kt
< 15 GeV
T,Track Jet
10 GeV < p
= 7 TeV s Data 2010 Pythia ATLAS MC09
(c) 10-15 GeV
track
z 0 0.1 0.2 0.3 0.4 0.5 0.6 0.7 0.8 0.9 1 /dz)
track)(dN
jet(1/N
0 10 20 30 40 50 60
ATLASPreliminary b-1
µ Ldt = 370
∫
track jets R=0.6 anti-kt
< 24 GeV
T,Track Jet
15 GeV < p
= 7 TeV s Data 2010 Pythia ATLAS MC09
(d) 15-24 GeV
track
z 0 0.1 0.2 0.3 0.4 0.5 0.6 0.7 0.8 0.9 1 /dz)
track)(dN
jet(1/N
0 10 20 30 40 50 60 70 80
ATLASPreliminary b-1
µ Ldt = 370
∫
track jets R=0.6 anti-kt
< 40 GeV
T,Track Jet
24 GeV < p
= 7 TeV s Data 2010 Pythia ATLAS MC09
(e) 24-40 GeV
track
z 0 0.1 0.2 0.3 0.4 0.5 0.6 0.7 0.8 0.9 1 /dz)
track)(dN
jet(1/N
0 10 20 30 40 50 60 70 80
ATLASPreliminary b-1
µ Ldt = 370
∫
track jets R=0.6 anti-kt
< 80 GeV
T,Track Jet
40 GeV < p
= 7 TeV s Data 2010 Pythia ATLAS MC09
(f) 40-80 GeV
Figure 3: Uncorrected z distributions for various ranges of reconstructed track jet (R = 0.6) p T as indi-
cated. Both the data and the Monte Carlo are normalized to the number of jets.
[GeV]
Charged Particle Jet p T
10 20 30 40 50 60 70 80
Track Jet-finding efficiency
0.6 0.7 0.8 0.9 1
ATLAS Preliminary Pythia ATLAS MC09
Charged Particle Jets R=0.6 anti-k
tFigure 4: Efficiency to find an anti-k t track jet (R = 0.6) given a truth-level charged particle jet, as a function of the truth-level p T . The statistical errors on simulated data are shown.
using the same Pythia MC09 sample to produce the corrections. The deviation of the unfolded answer from the true value for each sample is averaged over the ensemble for the Monte Carlo sample being un- folded, and the average for that Monte Carlo tune is compared with the deviation of a central ensemble of samples (a toy Monte Carlo using Pythia MC09 truth level spectra and default track smearing). The largest difference in unfolding performance, over all the Monte Carlo samples which are relevant for the systematic being computed, is determined to be the systematic uncertainty. This is determined for each plot, each bin, and uncertainties associated with both tracking efficiency and Monte Carlo tuning.
In the case of tracking efficiency, the set of samples used consists of three Pythia MC09 samples that are identical at truth level, but of which two have their table of track-finding efficiencies for smearing modified: one increased and one decreased by 3% at all track momenta. This value is consistent with the systematic uncertainty associated with track-finding efficiency that has been found in detailed studies of ATLAS tracking. The resulting systematic uncertainty on the jet cross section ranges from 4% at low p T up to 8-10% at high p T , and is the dominant systematic for the cross section (except in the highest momentum bin). For the fragmentation distributions, this systematic dominates at low z and then again at very high z, with the exact turnover depending on jet radius and momentum; in other z ranges, the fragmentation/underlying event uncertainty (discussed in the next paragraph) dominates.
Possible differences in the number of tracks per jet and the momentum distribution of tracks within
jets are accounted for by varying the fragmentation and underlying event properties within the Monte
Carlo. In order to span the space of such properties, Pythia 6 tunes 100, 129, and 320, described in
Section 4, were used along with Pythia MC09. Double-sided uncertainties were computed by taking the
greatest deviation from the unfolded-to-truth ratio produced in the MC09 sample. However, MC09 is an
outlier in many distributions among these samples, so the resulting systematic uncertainty in some bins
10 20 30 40 50 60 70 80
| < 0.57)
jetη b/GeV] (| µ [
Tdp η /d
jetσ
2d
10
-210
-11 10 10
210
3Pythia 8 Corrected
Pythia6 ATLAS MC09 Pythia8
ATLAS Preliminary
Charged Particle Jets R=0.6 anti-k
t[GeV]
Charged Particle Jet p
T10 20 30 40 50 60 70 80
(Truth-Corr.)/Corr.
-0.4 -0.2 0 0.2 0.4 0.6 0.8
Figure 5: Test unfolding of R = 0.6 anti-k t jets in the fully simulated Pythia 8 sample, compared with that sample’s truth-level information as well as to the MC09 sample from which the response was de- rived. Systematic uncertainties associated with fragmentation and unmatched jets are shown. Agreement between the Pythia 8 unfolded results and the Pythia 8 truth is good within these uncertainties, except for the two lowest momentum bins, where agreement is within twice the quoted values.
is one-sided.
Differences in the modeling of mismeasured high-p T tracks between data and Monte Carlo is based on two worst-case scenarios. First, underestimating the fraction of high-p T events that are mismeasured would lead to an overestimate of the true cross section. Second, an overestimate of high- p T efficiency would lead to an underestimate of the true cross section. To produce a conservative systematic, deviations between Monte Carlo and data are estimated from the changes obtained by applying the requirement of a hit in the outermost Pixel or innermost SCT layer. The resulting corrections are then used to determine systematic uncertainties based on the number of jets with leading track in a given momentum range; these corrections reach about 1% at a jet p T of about 35 GeV, and climb to +6% − 10% ( +7% − 12% ) in the 70-80 GeV bin for jet R = 0.6 (0.4). Uncertainties on fake and mismeasured low-p T tracks are negligible compared with the variation in tracking efficiency applied above. Corrected fragmentation distributions are presented only for jets with p T < 24 GeV, and therefore this uncertainty is negligible for those distributions.
An additional systematic uncertainty on the correction for unmatched reconstructed jets in the cross
section unfolding procedure is determined by comparing the correction derived from Pythia MC09 and
the correction derived from Phojet. The difference is about 1% at low p T ; at higher p T , the Monte Carlo statistics available for determining the difference are limited. A 1% uncertainty is therefore assigned.
Inefficiencies due to missing pixel B-layer modules are not perfectly modeled by the Monte Carlo.
There is a potential systematic uncertainty in the unfolding of the jet cross section due to this poor modeling of the φ − distribution. A correction to the data of 1.3% is indicated at low p T falling to 0.9%
at high p T . This is assigned a systematic uncertainty of 1.6%, which is comparable to the Monte Carlo modeling uncertainty but significantly smaller than the dominant tracking uncertainty.
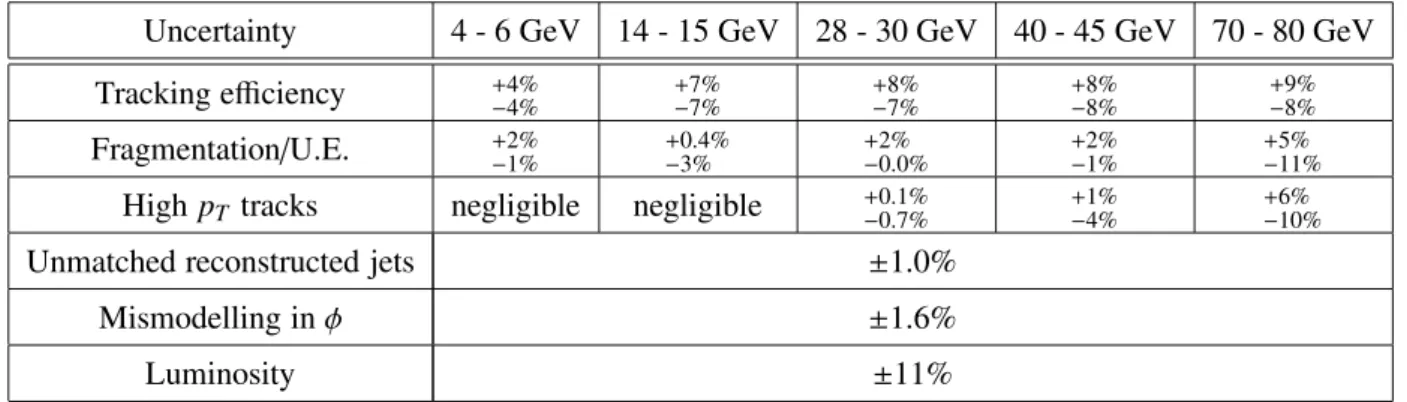
A summary of systematic uncertainties on the jet cross section, for R = 0.6 jets, is shown in Table 1.
Table 1: Summary of systematic uncertainties on the jet cross section, with values given for representative momentum bins for R = 0.6.
Uncertainty 4 - 6 GeV 14 - 15 GeV 28 - 30 GeV 40 - 45 GeV 70 - 80 GeV Tracking efficiency +4% − 4% +7% − 7% +8% − 7% +8% − 8% +9% − 8%
Fragmentation/U.E. +2% − 1% +0.4% − 3% +2% − 0.0% +2% − 1% +5% − 11%
High p T tracks negligible negligible +0.1% − 0.7% +1% − 4% +6% − 10%
Unmatched reconstructed jets ± 1.0%
Mismodelling in φ ± 1.6%
Luminosity ± 11%
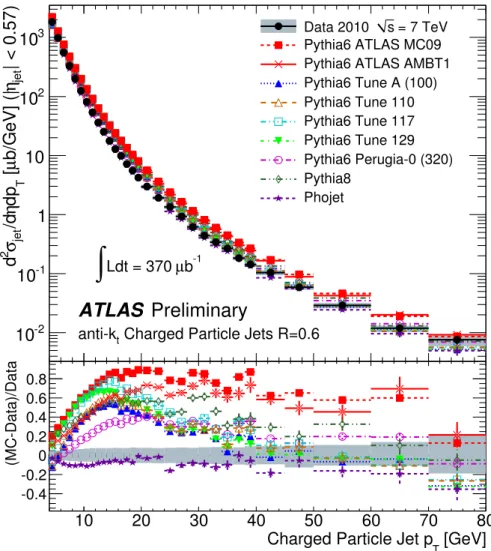
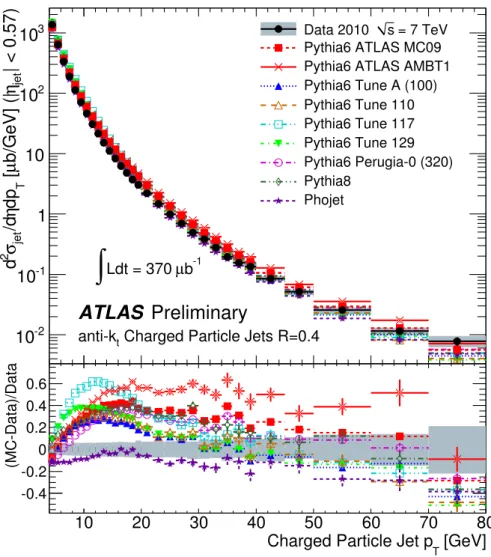
8 Results
The charged particle jet cross section d 2 σ jet /d p T dη (averaged over | η | < 0.57) is shown in Figure 6 for anti-k t jets with R = 0.6, and in Figure 7 for R=0.4, where charged particle jets are built using all primary charged particles with p T > 500 MeV. Also shown are systematic uncertainties and a variety of truth-level Monte Carlo distributions. Note that the 11% uncertainty on the normalization inherent in the determination of the integrated luminosity is not shown in the figures.
The differences between Monte Carlo predictions and the measured values for the p T distributions are generally smaller at low p T . Phojet does best in describing the shape of the p T distribution, particularly for R = 0.6, where a rescaling of a factor of 1.1 (consistent with the luminosity uncertainty) would give good agreement over most of the spectrum. The ATLAS MC09 tuning result has the largest disagreement with the measurement for R = 0.6, being a factor or 1.6 higher than the data for p T > 18 GeV. For R = 0.4, Phojet also has the best description; the ATLAS MC09 agreement is somewhat improved, and ATLAS AMBT1 is off by the largest amount.
The ratio of cross sections with R = 0.6 and R = 0.4 falls slowly with jet p T : from 1.9 at 6 GeV to 1.6 at 20 GeV and 1.3 at 70 GeV. This dependence can result from the transverse spreading of the jet which is controlled by fragmentation and QCD showering, and the decrease in the jet energy which results from less of the underlying event being included at smaller R. As indicated above, the MC09 tuning agrees better with the data for R = 0.4, as this tuning has a jet cross section that falls faster than the data as R decreases. This could indicate the presence of too many high p T tracks in the underlying event for the MC09 tune. This tune agrees best with the track multiplicity for tracks with p T < 5 GeV, which dominate the total multiplicity. At higher p T it produces a higher multiplicity than the other tunes.
(See Figure 8c of Ref. [5]).
Some of the Monte Carlo tunings, in particular Pythia Tune 117 and AMBT1, reproduce the R-
dependence of the data better than others. The difference in the variation with R between the data and the
MC indicates inadequate modeling of the underlying event and/or the jet fragmentation and showering.
It is to be noted that the shape of the jet p T spectrum is sensitive to the PDF’s. The PDF used is specified as part of each Monte Carlo tuning. In particular, the same PDF is not used for all of the tunings shown. AMBT1 and MC09 use modLO MRST [16, 17], the others use CTEQ5L [18].
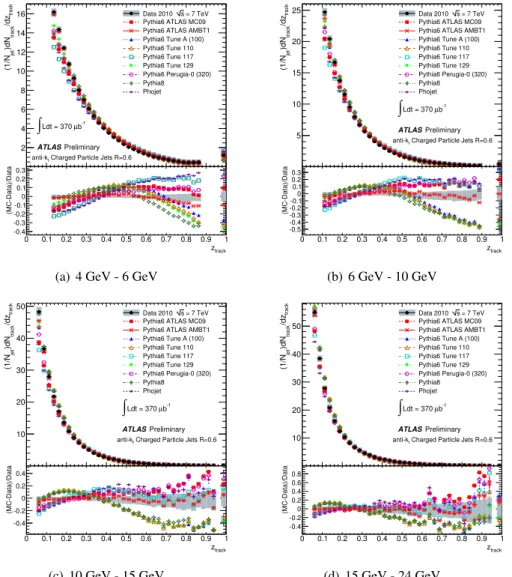
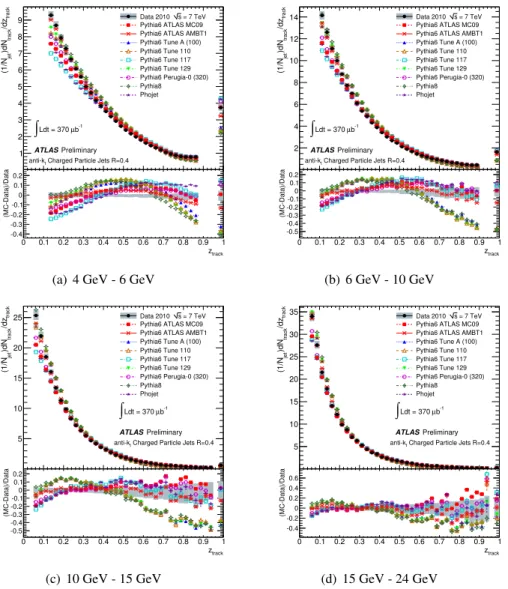
The corrected fragmentation functions are shown in Figures 8 (10) and 9 (11) for R = 0.6 and R = 0.4 on a linear (logarithmic) scale. Fractional differences between the data and Monte Carlo predictions are indicated separately. No tuning describes the data well for all jet momenta and all values of z; however, the ATLAS AMBT1 tune is consistent with the data within errors for jet p T > 10 GeV.
10 20 30 40 50 60 70 80
| < 0.57) jet η b/GeV] (| µ [ T dp η /d jet σ 2 d
10 -2
10 -1
1 10 10 2
10 3 Data 2010 s = 7 TeV
Pythia6 ATLAS MC09 Pythia6 ATLAS AMBT1 Pythia6 Tune A (100) Pythia6 Tune 110 Pythia6 Tune 117 Pythia6 Tune 129 Pythia6 Perugia-0 (320) Pythia8
Phojet
ATLAS Preliminary
b
-1µ Ldt = 370
∫
Charged Particle Jets R=0.6 anti-k
t[GeV]
Charged Particle Jet p T
10 20 30 40 50 60 70 80
(MC-Data)/Data
-0.4 -0.2 0 0.2 0.4 0.6 0.8
Figure 6: Corrected jet cross section for anti-k t jets with R=0.6, compared with several Pythia 6 tunes, as well as Phojet and Pythia 8. The shaded area is the total uncertainty for the corrected data distribution, excluding the overall 11% luminosity uncertainty.
9 Summary and Conclusions
Using tracks identified in the ATLAS Inner Detector, the properties of charged particle jets have been
measured. The differential cross section has been shown as a function of jet transverse momentum. The
10 20 30 40 50 60 70 80
| < 0.57) jet η b/GeV] (| µ [ T dp η /d jet σ 2 d
10 -2
10 -1
1 10 10 2
10 3 Data 2010 s = 7 TeV
Pythia6 ATLAS MC09 Pythia6 ATLAS AMBT1 Pythia6 Tune A (100) Pythia6 Tune 110 Pythia6 Tune 117 Pythia6 Tune 129 Pythia6 Perugia-0 (320) Pythia8
Phojet
ATLAS Preliminary
b
-1µ Ldt = 370
∫
Charged Particle Jets R=0.4 anti-k
t[GeV]
Charged Particle Jet p T
10 20 30 40 50 60 70 80
(MC-Data)/Data
-0.4 -0.2 0 0.2 0.4 0.6
Figure 7: Corrected jet cross section for anti-k t jets with R=0.4, compared with several Pythia 6 tunes, as well as Phojet and Pythia 8. The shaded area is the total uncertainty for the corrected data distribution, excluding the overall 11% luminosity uncertainty.
fragmentation distribution for tracks within these jets has been shown.
Direct comparison of these results with theoretical predictions is possible only in the context of Monte Carlo models, because the details of jet fragmentation, hadronization, and underlying event have a significant impact on the measured results. Comparisons have been made with existing Monte Carlo models. It is found that Phojet best describes the cross section and that the ATLAS AMBT1 tune of Pythia best describes the fragmentation distributions. The results can be used for future tuning and refinements of Monte Carlo models.
References
[1] M. Cacciari, G. P. Salam, and G. Soyez, The anti-k t jet clustering algorithm, JHEP 04 (2008) 063.
0 0.1 0.2 0.3 0.4 0.5 0.6 0.7 0.8 0.9 1
track/dztrack)dNjet(1/N
2 4 6 8 10 12 14
16 Data 2010 s = 7 TeV
Pythia6 ATLAS MC09 Pythia6 ATLAS AMBT1 Pythia6 Tune A (100) Pythia6 Tune 110 Pythia6 Tune 117 Pythia6 Tune 129 Pythia6 Perugia-0 (320) Pythia8 Phojet
ATLASPreliminary b-1
µ Ldt = 370
∫
Charged Particle Jets R=0.6 anti-kt
track z 0 0.1 0.2 0.3 0.4 0.5 0.6 0.7 0.8 0.9 1
(MC-Data)/Data
-0.4 -0.3 -0.2 -0.1 0 0.1 0.2 0.3
(a) 4 GeV - 6 GeV
0 0.1 0.2 0.3 0.4 0.5 0.6 0.7 0.8 0.9 1
track/dztrack)dNjet(1/N
5 10 15 20
25 Data 2010 s = 7 TeV
Pythia6 ATLAS MC09 Pythia6 ATLAS AMBT1 Pythia6 Tune A (100) Pythia6 Tune 110 Pythia6 Tune 117 Pythia6 Tune 129 Pythia6 Perugia-0 (320) Pythia8 Phojet
ATLASPreliminary b-1
µ Ldt = 370
∫
Charged Particle Jets R=0.6 anti-kt
track z 0 0.1 0.2 0.3 0.4 0.5 0.6 0.7 0.8 0.9 1
(MC-Data)/Data
-0.5 -0.4 -0.3 -0.2-0.10.20.30.10
(b) 6 GeV - 10 GeV
0 0.1 0.2 0.3 0.4 0.5 0.6 0.7 0.8 0.9 1
track/dztrack)dNjet(1/N
10 20 30 40
50 Data 2010 s = 7 TeV
Pythia6 ATLAS MC09 Pythia6 ATLAS AMBT1 Pythia6 Tune A (100) Pythia6 Tune 110 Pythia6 Tune 117 Pythia6 Tune 129 Pythia6 Perugia-0 (320) Pythia8 Phojet
ATLASPreliminary b-1
µ Ldt = 370
∫
Charged Particle Jets R=0.6 anti-kt
track z 0 0.1 0.2 0.3 0.4 0.5 0.6 0.7 0.8 0.9 1
(MC-Data)/Data
-0.4 -0.2 0 0.2 0.4
(c) 10 GeV - 15 GeV
0 0.1 0.2 0.3 0.4 0.5 0.6 0.7 0.8 0.9 1
track/dztrack)dNjet(1/N
10 20 30 40 50
= 7 TeV s Data 2010 Pythia6 ATLAS MC09 Pythia6 ATLAS AMBT1 Pythia6 Tune A (100) Pythia6 Tune 110 Pythia6 Tune 117 Pythia6 Tune 129 Pythia6 Perugia-0 (320) Pythia8 Phojet
ATLASPreliminary b-1
µ Ldt = 370
∫
Charged Particle Jets R=0.6 anti-kt
track z 0 0.1 0.2 0.3 0.4 0.5 0.6 0.7 0.8 0.9 1
(MC-Data)/Data
-0.4 -0.2 0 0.2 0.4 0.6 0.8
(d) 15 GeV - 24 GeV
Figure 8: Corrected fragmentation function in anti-k t jets with R = 0.6 in ranges of charged jet p T , compared with several Pythia 6 tunes, as well as Phojet and Pythia 8. The shaded area is the total uncertainty for the corrected data distribution. This is identical to Figure 10, except that the data are shown on a linear scale.
[2] ATLAS Collaboration, G. Aad et al., The ATLAS Experiment at the CERN Large Hadron Collider, JINST 3 (2008) S08003.
[3] ATLAS Collaboration, Luminosity Determination Using the ATLAS Detector, ATLAS-CONF-2010-060.
[4] ATLAS Collaboration, G. Aad et al., Charged-particle multiplicities in pp interactions at sqrt(s) = 900 GeV measured with the ATLAS detector at the LHC, Phys. Lett. B 1 (2010) 21–42,
arXiv:1003.3124 [hep-ex].
[5] ATLAS Collaboration, Charged particle multiplicities in pp interactions at sqrt(s) = 7 TeV
measured with the ATLAS detector at the LHC, ATLAS-CONF-2010-024.
0 0.1 0.2 0.3 0.4 0.5 0.6 0.7 0.8 0.9 1
track/dztrack)dNjet(1/N
1 2 3 4 5 6 7 8
9 Data 2010 s = 7 TeV
Pythia6 ATLAS MC09 Pythia6 ATLAS AMBT1 Pythia6 Tune A (100) Pythia6 Tune 110 Pythia6 Tune 117 Pythia6 Tune 129 Pythia6 Perugia-0 (320) Pythia8 Phojet
ATLASPreliminary b-1
µ Ldt = 370
∫
Charged Particle Jets R=0.4 anti-kt
track z 0 0.1 0.2 0.3 0.4 0.5 0.6 0.7 0.8 0.9 1
(MC-Data)/Data
-0.4 -0.3 -0.2 -0.1 0 0.1 0.2
(a) 4 GeV - 6 GeV
0 0.1 0.2 0.3 0.4 0.5 0.6 0.7 0.8 0.9 1
track/dztrack)dNjet(1/N
2 4 6 8 10 12
14 Data 2010 s = 7 TeV
Pythia6 ATLAS MC09 Pythia6 ATLAS AMBT1 Pythia6 Tune A (100) Pythia6 Tune 110 Pythia6 Tune 117 Pythia6 Tune 129 Pythia6 Perugia-0 (320) Pythia8 Phojet
ATLASPreliminary b-1
µ Ldt = 370
∫
Charged Particle Jets R=0.4 anti-kt
track z 0 0.1 0.2 0.3 0.4 0.5 0.6 0.7 0.8 0.9 1
(MC-Data)/Data
-0.5 -0.4 -0.3 -0.2 -0.1 0 0.1 0.2
(b) 6 GeV - 10 GeV
0 0.1 0.2 0.3 0.4 0.5 0.6 0.7 0.8 0.9 1
track/dztrack)dNjet(1/N
5 10 15 20
25 Data 2010 s = 7 TeV
Pythia6 ATLAS MC09 Pythia6 ATLAS AMBT1 Pythia6 Tune A (100) Pythia6 Tune 110 Pythia6 Tune 117 Pythia6 Tune 129 Pythia6 Perugia-0 (320) Pythia8 Phojet
ATLASPreliminary b-1
µ Ldt = 370
∫
Charged Particle Jets R=0.4 anti-kt
track z 0 0.1 0.2 0.3 0.4 0.5 0.6 0.7 0.8 0.9 1
(MC-Data)/Data
-0.5 -0.4 -0.3 -0.2 -0.1 0 0.1 0.2
(c) 10 GeV - 15 GeV
0 0.1 0.2 0.3 0.4 0.5 0.6 0.7 0.8 0.9 1
track/dztrack)dNjet(1/N
5 10 15 20 25 30
35 Data 2010 s = 7 TeV
Pythia6 ATLAS MC09 Pythia6 ATLAS AMBT1 Pythia6 Tune A (100) Pythia6 Tune 110 Pythia6 Tune 117 Pythia6 Tune 129 Pythia6 Perugia-0 (320) Pythia8 Phojet
ATLASPreliminary b-1
µ Ldt = 370
∫
Charged Particle Jets R=0.4 anti-kt
track z 0 0.1 0.2 0.3 0.4 0.5 0.6 0.7 0.8 0.9 1
(MC-Data)/Data
-0.4 -0.2 0 0.2 0.4 0.6
(d) 15 GeV - 24 GeV
Figure 9: Corrected fragmentation function in anti-k t jets with R = 0.4 in ranges of charged jet p T , compared with several Pythia 6 tunes, as well as Phojet and Pythia 8. The shaded area is the total uncertainty for the corrected data distribution. This is identical to Figure 11, except that the data are shown on a linear scale.
[6] P. Skands.
http://home.fnal.gov/ skands/leshouches-plots/LHPlotsFrontpage.html.
[7] P. Z. Skands, The Perugia Tunes, arXiv:1005.3457 [hep-ph].
[8] T. Sjostrand and M. van Zijl, A Multiple Interaction Model for the Event Structure in Hadron Collisions, Phys. Rev. D36 (1987) 2019.
[9] A. Buckley, H. Hoeth, H. Lacker, H. Schulz, and J. E. von Seggern, Systematic event generator tuning for the LHC, Eur. Phys. J. C65 (2010) 331–357, arXiv:0907.2973 [hep-ph].
[10] CDF Collaboration, R. Field, CDF Run II Monte-Carlo tunes, . To appear in the proceedings of
TeV4LHC 2006 Workshop 4th meeting, Batavia, Illinois, 20-22 Oct 2006.
0 0.1 0.2 0.3 0.4 0.5 0.6 0.7 0.8 0.9 1
track/dztrack)dNjet(1/N
1 10
= 7 TeV s Data 2010 Pythia6 ATLAS MC09 Pythia6 ATLAS AMBT1 Pythia6 Tune A (100) Pythia6 Tune 110 Pythia6 Tune 117 Pythia6 Tune 129 Pythia6 Perugia-0 (320) Pythia8 Phojet
ATLASPreliminary b-1
µ Ldt = 370
∫
Charged Particle Jets R=0.6 anti-kt
track z 0 0.1 0.2 0.3 0.4 0.5 0.6 0.7 0.8 0.9 1
(MC-Data)/Data
-0.4 -0.3 -0.2 -0.1 0 0.1 0.2 0.3
(a) 4 GeV - 6 GeV
0 0.1 0.2 0.3 0.4 0.5 0.6 0.7 0.8 0.9 1
track/dztrack)dNjet(1/N
10-1
1 10
102 Data 2010 s = 7 TeV
Pythia6 ATLAS MC09 Pythia6 ATLAS AMBT1 Pythia6 Tune A (100) Pythia6 Tune 110 Pythia6 Tune 117 Pythia6 Tune 129 Pythia6 Perugia-0 (320) Pythia8 Phojet
ATLASPreliminary b-1
µ Ldt = 370
∫
Charged Particle Jets R=0.6 anti-kt
track z 0 0.1 0.2 0.3 0.4 0.5 0.6 0.7 0.8 0.9 1
(MC-Data)/Data
-0.5 -0.4 -0.3 -0.2-0.10.20.30.10
(b) 6 GeV - 10 GeV
0 0.1 0.2 0.3 0.4 0.5 0.6 0.7 0.8 0.9 1
track/dztrack)dNjet(1/N
10-1
1 10
102 Data 2010 s = 7 TeV
Pythia6 ATLAS MC09 Pythia6 ATLAS AMBT1 Pythia6 Tune A (100) Pythia6 Tune 110 Pythia6 Tune 117 Pythia6 Tune 129 Pythia6 Perugia-0 (320) Pythia8 Phojet
ATLASPreliminary b-1
µ Ldt = 370
∫
Charged Particle Jets R=0.6 anti-kt
track z 0 0.1 0.2 0.3 0.4 0.5 0.6 0.7 0.8 0.9 1
(MC-Data)/Data
-0.4 -0.2 0 0.2 0.4
(c) 10 GeV - 15 GeV
0 0.1 0.2 0.3 0.4 0.5 0.6 0.7 0.8 0.9 1
track/dztrack)dNjet(1/N
10-1
1 10 102
= 7 TeV s Data 2010 Pythia6 ATLAS MC09 Pythia6 ATLAS AMBT1 Pythia6 Tune A (100) Pythia6 Tune 110 Pythia6 Tune 117 Pythia6 Tune 129 Pythia6 Perugia-0 (320) Pythia8 Phojet
ATLASPreliminary b-1
µ Ldt = 370
∫
Charged Particle Jets R=0.6 anti-kt
track z 0 0.1 0.2 0.3 0.4 0.5 0.6 0.7 0.8 0.9 1
(MC-Data)/Data
-0.4 -0.2 0 0.2 0.4 0.6 0.8
(d) 15 GeV - 24 GeV
Figure 10: Corrected fragmentation function in anti-k t jets with R = 0.6 in ranges of charged jet p T , compared with several Pythia 6 tunes, as well as Phojet and Pythia 8. The shaded area is the total uncertainty for the corrected data distribution. This is identical to Figure 8, except that the data are shown on a logarithmic scale.
[11] ATLAS Collaboration, Charged particle multiplicities in pp interactions at sqrt(s) = 0.9 and 7 TeV in a diffractive limited phase-space measured with the ATLAS detector at the LHC and new PYTHIA6 tune, ATLAS-CONF-2010-031.
[12] T. Sjostrand, S. Mrenna, and P. Z. Skands, A Brief Introduction to PYTHIA 8.1, Comput. Phys.
Commun. 178 (2008) 852–867, arXiv:0710.3820 [hep-ph].
[13] T. Cornelissen et al., The new ATLAS track reconstruction (NEWT), J. Phys. Conf. Ser. 119 (2008) 032014.
[14] G. D’Agostini, A Multidimensional unfolding method based on Bayes’ theorem, Nucl. Instrum.
Meth. A362 (1995) 487–498.
0 0.1 0.2 0.3 0.4 0.5 0.6 0.7 0.8 0.9 1
track/dztrack)dNjet(1/N
1 10
= 7 TeV s Data 2010 Pythia6 ATLAS MC09 Pythia6 ATLAS AMBT1 Pythia6 Tune A (100) Pythia6 Tune 110 Pythia6 Tune 117 Pythia6 Tune 129 Pythia6 Perugia-0 (320) Pythia8 Phojet
ATLASPreliminary b-1
µ Ldt = 370
∫
Charged Particle Jets R=0.4 anti-kt
track z 0 0.1 0.2 0.3 0.4 0.5 0.6 0.7 0.8 0.9 1
(MC-Data)/Data
-0.4 -0.3 -0.2 -0.1 0 0.1 0.2
(a) 4 GeV - 6 GeV
0 0.1 0.2 0.3 0.4 0.5 0.6 0.7 0.8 0.9 1
track/dztrack)dNjet(1/N
1 10
= 7 TeV s Data 2010 Pythia6 ATLAS MC09 Pythia6 ATLAS AMBT1 Pythia6 Tune A (100) Pythia6 Tune 110 Pythia6 Tune 117 Pythia6 Tune 129 Pythia6 Perugia-0 (320) Pythia8 Phojet
ATLASPreliminary b-1
µ Ldt = 370
∫
Charged Particle Jets R=0.4 anti-kt
track z 0 0.1 0.2 0.3 0.4 0.5 0.6 0.7 0.8 0.9 1
(MC-Data)/Data
-0.5 -0.4 -0.3 -0.2 -0.1 0 0.1 0.2
(b) 6 GeV - 10 GeV
0 0.1 0.2 0.3 0.4 0.5 0.6 0.7 0.8 0.9 1
track/dztrack)dNjet(1/N
10-1
1 10
102 Data 2010 s = 7 TeV
Pythia6 ATLAS MC09 Pythia6 ATLAS AMBT1 Pythia6 Tune A (100) Pythia6 Tune 110 Pythia6 Tune 117 Pythia6 Tune 129 Pythia6 Perugia-0 (320) Pythia8 Phojet
ATLASPreliminary b-1
µ Ldt = 370
∫
Charged Particle Jets R=0.4 anti-kt
track z 0 0.1 0.2 0.3 0.4 0.5 0.6 0.7 0.8 0.9 1
(MC-Data)/Data
-0.5 -0.4 -0.3 -0.2 -0.1 0 0.1 0.2
(c) 10 GeV - 15 GeV
0 0.1 0.2 0.3 0.4 0.5 0.6 0.7 0.8 0.9 1
track/dztrack)dNjet(1/N
10-1
1 10 102
= 7 TeV s Data 2010 Pythia6 ATLAS MC09 Pythia6 ATLAS AMBT1 Pythia6 Tune A (100) Pythia6 Tune 110 Pythia6 Tune 117 Pythia6 Tune 129 Pythia6 Perugia-0 (320) Pythia8 Phojet
ATLASPreliminary b-1
µ Ldt = 370
∫
Charged Particle Jets R=0.4 anti-kt
track z 0 0.1 0.2 0.3 0.4 0.5 0.6 0.7 0.8 0.9 1
(MC-Data)/Data
-0.4 -0.2 0 0.2 0.4 0.6