ATLAS-CONF-2016-049 17/03/2017
ATLAS NOTE
ATLAS-CONF-2016-049
4th August 2016
Search for pair production of Higgs bosons in the b b b ¯ b ¯ final state using proton–proton collisions at √
s = 13 TeV with the ATLAS detector
The ATLAS Collaboration
Abstract
A search for Higgs-boson pair production in the
bbb¯
b¯ final state is carried out with 13.3 fb
−1of LHC proton-proton collision data collected at
√s =
13 TeV with the ATLAS detector in 2015 and 2016. The data are consistent with the estimated background and are used to set upper limits on the production cross section of Higgs-boson pairs times branching ratio to
bbb¯
b¯ for both non-resonant and resonant production. In the context of the Randall–Sundrum model, upper limits in the 1000 fb to 2 fb range are obtained for masses between 300 and 3000 GeV, at the 95% confidence level. The cross section times branching ratio for non-resonant Standard Model Higgs-boson pair production is constrained to be less than 330 fb, 29 times the Standard Model predicted cross section of 11
.3
+0−1..90fb.
Note: the current version of this note was updated on 17th March 2017 to add the non- resonant expected limit, which was missing due to an oversight.
© 2016 CERN for the benefit of the ATLAS Collaboration.
Reproduction of this article or parts of it is allowed as specified in the CC-BY-4.0 license.
1 Introduction
The discovery of a Higgs boson (
h) [1, 2] at the Large Hadron Collider (LHC) motivates searches for physics beyond the Standard Model (SM) in channels involving coupling to the Higgs boson. In particular, many models of new physics predict cross sections for Higgs boson pair production that are significantly greater than the SM prediction. Resonant Higgs boson pair production is predicted in models such as the bulk Randall-Sundrum (RS) model [3, 4], which features spin-2 Kaluza-Klein gravitons,
G∗KK
, that are produced via gluon-fusion and then may subsequently decay to a pair of Higgs bosons. Similarly, 2HDM models [5] posit the existence of a heavy spin-0 scalar,
H, that may decay to
hpairs. Enhanced, non-resonant Higgs boson pair production is predicted by other models, for example those featuring light coloured scalars [6] or direct
t¯t hhvertices [7, 8].
The analysis presented in this paper makes use of the dominant
h → bb¯ decay mode to search for Higgs boson pair production using the
bbb¯¯
bfinal state. It is based on the previous ATLAS searches at
√s=
8 TeV [9] and
√s =
13 TeV [10], which set limits on both resonant and non-resonant Higgs boson pair production. For the Bulk RS model, these previous analyses excluded
G∗KK
masses between 480 GeV up to 770 – 990 GeV, depending on the model parameters. For non-resonant production, the
√s=
13 TeV analysis [10] set a cross section upper limit of 1.22 pb [11]. CMS has also searched for narrow resonances in the
bbb¯
b¯ channel using
√s =
8 TeV data [12]. Other final states have been analysed for evidence of Higgs boson pair production using
√s =
8 TeV data: ATLAS has searched in
bbγγ¯ [13],
bbτ¯
+τ−and
W+W−γγ, which were combined with the
bbb¯
b¯ results in [11]. CMS has performed analyses of the
bbγγ¯ [14] and
bbτ¯
+τ−[15] final states in addition to a search in multilepton and multilepton+photons final states [16]. None of these analyses found any evidence of Higgs boson pair production.
Two techniques to reconstruct the Higgs boson, which are complementary in their acceptance, are presented in this note. Both use anti-
ktjets [17] to reconstruct the kinematics of the Higgs boson candidates, but with different values of the jet radius parameter,
R. The "resolved" technique is used to analyse
hhsystems that have sufficiently low mass (
mhh) to enable the reconstruction of each
b-quark as a distinct
b-jet with
R=0
.4. These jets are identified as containing
b-hadrons using a multivariate
b-tagging algorithm [18, 19]. The "boosted" technique is used to analyse those
hhsystems with higher mass, in which the higher Lorentz boosts cause an inability to resolve the decay products of each Higgs boson as separate
R=0
.4
b-jets. In these cases, the Higgs boson candidates consist of a single anti-
ktjet with
R =1
.0, with
b-tagging performed using the same multivariate algorithm as in the resolved analysis, but operating on
R=0
.2 track-jets matched to the
R=1
.0 jet. The final results are obtained using the resolved analysis up to a resonance mass of 1000 GeV, with the boosted analysis used for higher masses.
The search reported in this note has been improved relative to the previous analysis [10] and yields better
sensitivity to non-resonant Higgs boson pairs, resonances with masses below 500 GeV, and resonances
with masses above 2500 GeV. The improvement for non-resonant and low-mass resonant signals has been
gained by loosening the topological selection requirements in order to increase signal acceptance, while
the improvement at high mass was achieved by removing the requirement that at least two
R=0
.2 track-
jets are associated with the boosted Higgs candidates, again increasing signal acceptance. The overall
analysis sensitivity also benefits from a factor of four increase in integrated luminosity by including the
dataset recorded by ATLAS during March-July 2016.
2 ATLAS detector
The ATLAS experiment [20] at the LHC is a multi-purpose particle detector with a forward-backward symmetric cylindrical geometry and a near 4
πcoverage in solid angle.1 It consists of an inner track- ing detector (ID) surrounded by a thin superconducting solenoid providing a 2 T axial magnetic field, electromagnetic (EM) and hadronic calorimeters, and a muon spectrometer (MS). The ID covers the pseudorapidity range
|η| <2
.5. It consists of silicon pixel, silicon micro-strip, and straw tube transition radiation tracking detectors. An additional pixel detector layer [21], inserted at a mean radius of 3.3 cm, is used in the Run-2 data-taking. Lead/liquid-argon (LAr) sampling calorimeters provide electromagnetic energy measurements. A steel/scintillator-tile hadronic calorimeter covers the central pseudorapidity range (
|η| <1
.7). The end-cap and forward regions are instrumented with LAr calorimeters for both EM and hadronic energy measurements up to
|η| =4
.9. The muon spectrometer (MS) surrounds the calorimeters and includes three large superconducting air-core toroids. The field integral of the toroids ranges between 2.0 and 6.0 T m for most of the detector. The MS includes a system of precision tracking chambers and fast detectors for triggering. A dedicated trigger system is used to select events [22]. The first-level trigger is implemented in hardware and uses the calorimeter and muon detectors to reduce the accepted event rate to 100 kHz. This is followed by a software-based high-level trigger (HLT) that reduces the accepted event rate to 1 kHz on average.
3 Data and simulated samples
3.1 Data
This analysis is performed on two LHC
ppcollision datasets at
√s =
13 TeV. The first dataset was collected during 2015. After requiring that the data were collected during stable beam conditions and that all relevant detector systems were functional, the integrated luminosity was measured to be 3.2 fb
−1. The uncertainty in the integrated luminosity is found to be
±2
.1%, from a calibration of the luminosity scale using
x− ybeam-separation scans performed in August 2015, following a methodology similar to that detailed in Ref. [23, 24]. The second dataset was collected during March-July 2016 and, after the LHC beam and detector data-quality requirements, corresponds to an integrated luminosity of 10.1 fb
−1, with a preliminary uncertainty of
±3
.7% found using
x−ybeam-separation scans performed in May 2016.
Events were selected from these datasets for the resolved analysis using two sets of four triggers: one for the 2015 dataset and one for the 2016 dataset. All of the triggers required the presence of either one or two
b-tagged jets, with different kinematic and
b-tag quality requirements. Some of the triggers required additional jets. Multiple triggers were needed in order to maintain high signal efficiency: greater than 65% for signals with
mhh =300 GeV, increasing to more than 95% for
mhh ≥500 GeV. Different trigger sets were used in 2015 and 2016 due to the different LHC conditions and to benefit from improved online
b-tagging. For the boosted analysis, events were selected from the 2015 dataset using a trigger that required a single anti-
ktjet with
R=1
.0 and with
pT >360 GeV. In 2016, a similar trigger was used
1ATLAS uses a right-handed coordinate system with its origin at the nominal interaction point (IP) in the centre of the detector and thez-axis along the beam pipe. The x-axis points from the IP to the centre of the LHC ring, and the y-axis points upwards. Cylindrical coordinates(r, φ) are used in the transverse plane, φbeing the azimuthal angle around the z-axis.
The pseudorapidity is defined in terms of the polar angleθasη =−ln tan(θ/2). Angular distance is measured in units of
∆R≡
q(∆η)2+(∆φ)2.
but with a higher threshold of
pT >420 GeV. These triggers were 100% efficient for signals passing the offline large-
Rjet kinematic requirements.
3.2 Signal models and simulation
Simulated Monte Carlo (MC) event samples are used in this analysis to model signal production and the background from
t¯tand
Z+jets events. The dominant multi-jet background is modelled using data-driven techniques.
Signal
G∗KK→hh→bbb
¯
b¯ events were generated at leading order (LO) with
MG5_aMC@NLOv2.2.2 [25]
using the NNPDF2.3 LO parton distribution function (PDF) set [26]. The matrix elements produced were passed to Pythia 8.186 [27] for parton showering, hadronization and simulation of the underlying event.
The A14 set of tuned underlying-event parameters [28] was used. The signal samples were generated with
k/M¯
Pl =1 (
kis the curvature of the warped extra dimension and ¯
MPl =2
.4
×10
18GeV is the effective four-dimensional Planck scale).
Non-resonant SM
pp→hh→bbb¯
b¯ signal events were generated via the gluon-fusion process with the next-to-leading-order (NLO)
MG5_aMC@NLOusing form factors for the top-quark loop from HPAIR [29, 30]. The cross section times branching ratio to the
bbb¯¯
bfinal state, evaluated at next-to-next-to-leading order (NNLO) with the summation of logarithms at next-to-next-leading-logarithm accuracy and including top-quark mass effects at NLO [31] is 11
.3
+0.9−1.0fb [32]. The uncertainty includes the effects due to renormalization and factorization scales, PDF set,
αS, and the
h→bb¯ branching ratio.
In all signal samples, the mass of the Higgs boson (
mh) was set to 125.0 GeV.
Generation of
tt¯ events was performed with Powheg-box v1 using the CT10 PDF set. The parton shower, hadronization, and the underlying event were simulated using Pythia 6.428 [33] with the CTEQ6L1 PDF set and the corresponding Perugia 2012 set of tuned underlying-event parameters [34]. The top-quark mass was set to 172.5 GeV. Higher-order corrections to
t¯tcross sections were computed with Top++
2.0 [35]. These incorporate next-to-next-to-leading-order corrections in QCD, including resummation of next-to-next-to-leading logarithmic soft gluon terms. The
Z+jets sample was generated using Pythia 8.186 with the NNPDF2.3 LO PDF set.
For all simulated samples, charm-hadron and bottom-hadron decays were handled by EvtGen 1.2.0 [36].
To simulate the impact of multiple
ppinteractions that occur within the same or nearby bunch crossings (pile-up), minimum-bias events generated with Pythia 8 are overlaid on top of the hard scatter event, with the instantaneous luminosity profile and accelerator bunch structure present in 2015 and 2016 data. The detector response was simulated with Geant 4 [37, 38] and the events were processed with the same reconstruction software as that used for the data.
4 Event reconstruction
Higgs boson kinematic properties are reconstructed using anti-
ktjets built from topological clusters of energy deposits in calorimeters cells [39], using a four-momentum reconstruction scheme with massless clusters as input. The directions of jets are corrected to point back to the identified hard-scatter proton–
proton collision vertex, the vertex with the highest
ΣpT2of constituent tracks.
The
R =0
.4 jets used in the resolved analysis are reconstructed from clusters calibrated at the electro- magnetic scale. They are corrected for additional energy deposited from the pile-up interactions using an area-based correction [40], with a further, small correction based on the expected average number of
ppcollisions in the bunch-crossing that removes any residual energy offset. Jets are then calibrated using
pT- and
η-dependent calibration factors derived from MC simulation, before global sequential calibration [41] is applied, which reduces flavour-dependent differences in calorimeter response. Final calibration is performed based on in situ measurements in real collision data [42]. Jets with a majority of their energy arising from these pile-up interactions are suppressed using tracking information as detailed in Ref. [43].
The
R=1
.0 jets used in the boosted analysis are built from locally-calibrated [41] topological clusters.
They are trimmed [44] to minimize the impact of energy deposits from pile-up interactions. Trimming proceeds by reclustering the jet with the
ktalgorithm [45] into smaller
R=0
.2 subjets and then removing those subjets with
psubjetT /pjet
T <
0
.05, where
psubjetT
is the transverse momentum of the subjet and
pjetT
that of the original jet. The energy and mass scales of the trimmed jets are then calibrated using
pT- and
η-dependent calibration factors derived from MC simulations [46].
Jets containing
b-hadrons are identified using a multivariate
b-tagging algorithm [18]. This algorithm is applied to a set of charged-particle tracks associated to each jet that satisfy quality and impact parameter criteria. Tracks are associated with
R=0
.4 jets using a
pT-dependent
∆Rrequirement. For
R=1
.0 jets,
b-tagging is performed on
R=0
.2 track-jets [47] matched to the
R=1
.0 jets using ghost association [48].
The smaller radius parameter of the track-jets enables two close-by
b−hadrons to be identified within a single jet, which is beneficial when reconstructing high-
pTHiggs boson candidates. The
b-tagging requirements of the resolved (boosted) analysis result in an efficiency of 70% (77%) for jets containing
b-hadrons in a sample of simulated
t¯tevents. The corresponding efficiencies for
c-hadron jets and light- quark or gluon jets are 7.8% (24%) and 0.4% (1.7%), respectively. Different
b-tagging operating points are chosen in the two analyses to maximise their respective sensitivities.
Muons are reconstructed by combining tracks in the ID and MS, and are required to satisfy medium muon identification criteria [49]. The four-momentum of a muon with
pT >4 GeV and
|η| <2
.5, that is within
∆R
of 0.4 (0.2) of a jet used for
b-tagging in the resolved (boosted) analysis, is added to the calorimeter-jet’s four-momentum to partially account for the energy lost in semi-leptonic
b-hadron decays.
5 Resolved analysis
The resolved analysis is optimised to discover signals that result in either non-resonant or low-mass resonant Higgs boson pairs. The strategy is to select two Higgs boson candidates, each composed of two
b-tagged anti-
kt R=0
.4 jets, with masses near
mh.
The mass of the two Higgs boson candidate system (
m4j) is used as the final discriminant between Higgs boson pair production and the backgrounds. Resonant signals would lead to a localised excess, while non-resonant production would result in an excess in the tail of the
m4jspectrum.
The 2015 and 2016 datasets are analysed separately because LHC conditions such as instantaneous
luminosity were different in these two years, necessitating the use of different trigger schemes. The results
are combined statistically as described in Section 7.
[GeV]
G*KK
m
300 400 500 600 700 800 900 1000 1100 1200
Efficiency × Acceptance
0 0.02 0.04 0.06 0.08 0.1 0.12 0.14 0.16 0.18
0.2 4 b-tagged jets
Rjj
∆
Rhh
∆ Dependent Cuts, m4j
Xhh
Trigger
Preliminary ATLAS
Resolved
= 13 TeV, 2016, 10.1 fb-1
s
0SMNR 0.01 0.02 0.03 0.04 0.05 0.06 0.07 0.08
4 b-tagged jets jj
∆R Dependent Cuts, ∆Rhh 4j m hh X Trigger
ATLAS Internal
Resolved
= 13 TeV, 2016, 10.1 fb-1
s
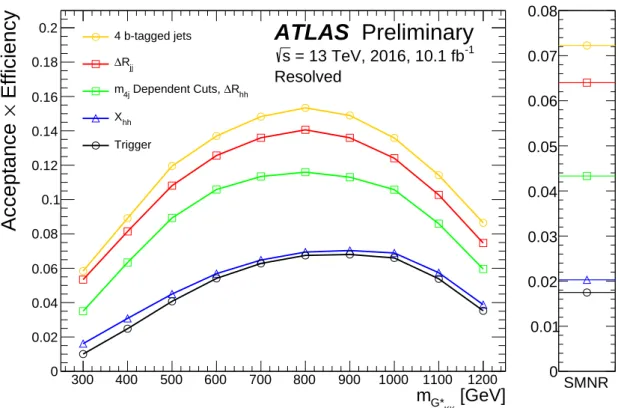
Figure 1: The selection efficiency at each stage of the resolved analysis event selection forG∗
KK→ hh→bbb¯ b¯ samples with a range ofmG∗
KKand for a SM non-resonant signal (SMNR).
5.1 Selection
The combined acceptance times efficiency at different stages of the event selection is shown in Figure 1 for the Bulk RS and SM non-resonant signal models.
The selection begins with the requirement that the event contains at least four
b-tagged anti-
kt R=0
.4 jets with
pT> 30 GeV and
|η| <2
.5. The acceptance times efficiency of this requirement is shown in Figure 1 as the curve labelled “4 b-tagged jets”. The four jets with the highest
b-tagging score are paired to construct two Higgs boson candidates. The angle between the decay products of the Higgs boson in the lab frame is dependent on the Lorentz boost of the Higgs boson and thus the invariant mass of the four-jet system,
m4j. Accordingly, pairings of jets into Higgs boson candidates are only accepted if they satisfy the following requirements, where
m4jis expressed in GeV:
360
m4j −
0
.5
<∆Rj j,lead <655
m4j +
0
.475 235
m4j < ∆Rj j,subl <
875
m4j +0
.35
if
m4j <1250 GeV
0
< ∆Rj j,lead <1 0
< ∆Rj j,subl <1
if
m4j >1250 GeV
In these expressions,
∆Rj j,leadis the angular distance between jets in the leading Higgs boson candidate
and
∆Rj j,sublfor the sub-leading candidate. The leading Higgs boson candidate is defined to be the
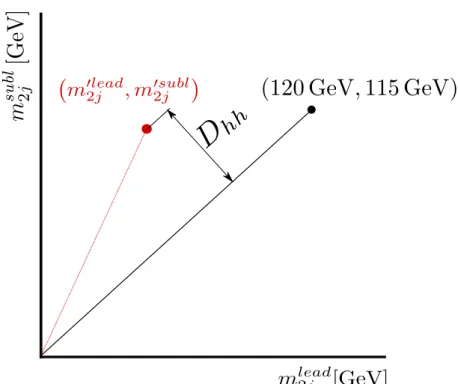
Figure 2:Dhhis used to choose the best pairing of jets into Higgs boson candidates in the resolved analysis. It is the distance of the pairing’s
m0l ead
2j ,m0subl
2 j
from the line connecting (0 GeV,0 GeV)and the centre of the signal region,(120 GeV,115 GeV).
candidate with the highest scalar sum of jet
pT. Figure 1 shows the efficiency after requiring events to contain two Higgs boson candidates satisfying these criteria as the curve labelled “
∆Rj j”. Most of the efficiency loss shown is the rejection of events where one of the
b-tagged jets did not come from a Higgs boson decay.
In events with
m4j <500 GeV, there are likely to be multiple Higgs bosons candidates satisfying these requirements, necessitating an algorithm to choose the correct pairs. In the absence of energy loss through semi-leptonic decays, the optimal choice would be the combination most consistent with the decays of two particles of equal mass. To account for energy loss, the choice is modified to the pairing that minimizes the distance,
Dhh, from a line connecting (0 GeV, 0 GeV) and (120 GeV, 115 GeV):
Dhh = r
mlead
2j
2 +
msubl
2j
2
sin
* ,tan
−1* ,msubl
2j
mlead
2j
+ -
−
tan
−1115 120
! + -
(1) where
mlead2j
is the mass of the leading Higgs boson candidate and
msubl2j
the mass of the sub-leading candidate (see Figure 2). The values of 120 GeV and 115 GeV are the centre of the signal region in
mlead2j
and
msubl2j
respectively, chosen because they correspond to the median values of the narrowest intervals that contain 90% of the signal in simulations.
The resolved analysis searches for resonances with a wide range of masses, 300 GeV
<m<1200 GeV, as
well as non-resonant signals. Event selection criteria that vary as a function of the reconstructed resonance
mass are used to enhance the analysis sensitivity across this range. Mass-dependent requirements are made on the leading Higgs boson candidate
pT,
pleadT
, the sub-leading Higgs boson
pT,
psublT
, and the pseudorapidity difference between the two Higgs boson candidates,
|∆ηhh|:
plead
T >
0
.5
m4j−90 GeV
psublT >
0
.33
m4j−70 GeV
|∆ηhh| <
1
.1 if
m4j <850 GeV 2
×10
−3m4j−0
.6 if
m4j >850 GeV where
m4jis again expressed in GeV.
Following this mass-dependent selection, a further requirement is made that the two Higgs boson can- didates must be separated in
∆R, demanding
∆R(h,h) >1
.5. Figure 1 shows the efficiency of the mass-dependent selection and Higgs separation requirements as the curve labelled “
m4jDependent Cuts,
∆Rhh
”.
A requirement on the Higgs boson candidates’ masses is used to define the signal region:
Xhh = vu ut
* ,
mlead
2j −
120 GeV 0
.1
mlead2j
+ -
2
+* ,
msubl
2j −
115 GeV 0
.1
msubl2j
+ -
2
<
1
.6 (2)
where the 0.1
m2jterms represent the widths of the leading and sub-leading Higgs boson candidate mass distributions. The signal region is shown as the inner region of Figure 3. The efficiency of the full event selection, including this signal region requirement, is shown in Figure 1 as “
Xhh”.
Finally, the effect of the trigger requirement is seen in the curve labelled "trigger", which shows the total efficiency of the event selection criteria and the trigger.
The final analysis discriminant,
m4j, is simply the invariant mass of the selected four-jet system. No correction is made based on the known Higgs boson mass.
5.2 Background estimation
After the full event selection, about 95% of the background consists of multijet events, which are modelled using data. The remaining 5% is
tt¯ , which is modelled using MC simulation. There is negligible background from all other sources including processes involving Higgs bosons.
5.2.1 Multijet background
The multijet background is modelled with an independent data sample selected using the same trigger and selection requirements as described above, except for the
b-tagging requirement: exactly two jets must pass the
b-tagging requirement. This “2-tag” selection yields a data sample that consists of 98% multijet events and 2%
t¯tevents. The predicted signal contamination is negligible.
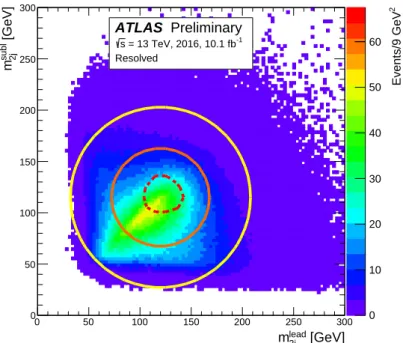
The 2-tag sample used to model the full-selection “4-tag” sample is a signal-free sideband region of the
mlead2j
–
msubl2j
plane, as illustrated in Figure 3. The modelling is verified in a control region. The sideband
region is defined as 48 GeV
<q (mlead2j −
120 GeV
)2+(msubl2j −
115 GeV
)2<88 GeV, while the control region is defined as the region in the
mlead2j
–
msubl2j
plane between the signal and sideband regions. These definitions are chosen to be orthogonal to the signal region and to give approximately equal event yields in both the sideband and control regions. The outer limit on the sideband region ensures that the kinematic properties of the sideband region are representative of the signal region.
[GeV]
lead
m2j
0 50 100 150 200 250 300
[GeV]subl 2jm
0 50 100 150 200 250
300 2 Events/9 GeV
0 10 20 30 40 50 60
Preliminary ATLAS
Resolved
= 13 TeV, 2016, 10.1 fb-1
s
Figure 3: Themsubl
2j vs.mlead
2j distribution for the resolved analysis background model. The signal region is the area surrounded by the dashed red contour line, centred on (mlead
2j =120 GeV,msubl
2j =115 GeV). The control region is the area between the signal region and the orange contour. The sideband region is the area between the orange and yellow contours.
Events in the 2-tag data sample are reweighted to correct for differences introduced by the additional
b-tagging requirement on the 4-tag sample. These differences can arise for the following reasons: events with more jets are more likely to satisfy the requirement of at least four
b-tagged jets; the
b-tagging efficiency varies as a function of jet
pTand
η; the various multijet processes contribute in different fractions in each sample; and the fractions of events passed by each trigger path changes. The weights are derived in the sideband region from linear fits to the ratio of the total background model to data for four distributions that are found to have the largest disagreement between 2-tag and 4-tag: the number of additional jets in the event, the leading Higgs boson candidate
pT, and the energies of the jets in the sub-leading Higgs boson candidate. The reweighting is performed using one-dimensional distributions but is iterated so that correlations between the four variables are taken into account.
After reweighting, the normalization of the multijet background prediction is set by scaling the number of events in each region of the 2-tag sample by the following factor
µmultijetcalculated in the sideband region:
µmultijet= N4-tag
Multijet
N2-tag
Multijet
= N4-tag
data −Nt4-tag
t¯
N2-tag
data −N2-tag
tt¯
,
(3)
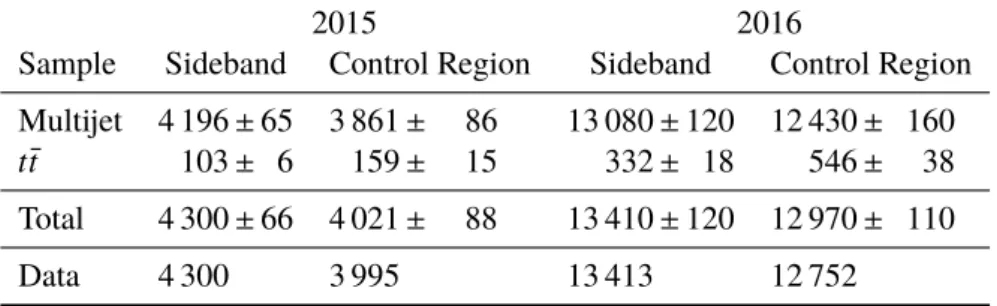
Table 1: The number of events in data and the predicted number of background events for the 2015 and 2016 datasets, after applying the mass-dependent requirements in the sideband and control regions for the resolved analysis. The uncertainties are purely statistical. The data and prediction in the sideband agree by construction.
2015 2016
Sample Sideband Control Region Sideband Control Region Multijet 4 196
±65 3 861
±86 13 080
±120 12 430
±160
t¯t103
±6 159
±15 332
±18 546
±38 Total 4 300
±66 4 021
±88 13 410
±120 12 970
±110
Data 4 300 3 995 13 413 12 752
where
N2-/4-tagdata
is the number of events observed in the sideband region in the 2- or 4-tag data sample, respectively. The yields
Nt2-/4-tagt¯
are the estimated number of
t¯tevents in the 2-/4-tag selected sideband region estimated from MC simulation. In the 2015 dataset
µmultijet= (1
.45
±0
.02
)×10
−2and in the 2016 dataset
µmultijet = (1
.12
±0
.01
) ×10
−2. The two different values of
µmultijetare a result of the different LHC conditions and different triggers used in each year.
After the correction process, there is agreement between the background model and sideband region data, including variables that were not directly corrected.
5.2.2 tt¯background
The
t¯tbackground is modelled using MC simulation. However, due to the limited statistical precision of the simulated sample after the full selection, the
tt m¯
4jdistribution of simulated events passing the “2-tag”
selection is used. A systematic uncertainty is assigned to cover the differences between the 2-tag and 4-tag
m4jdistributions.
5.2.3 Background validation
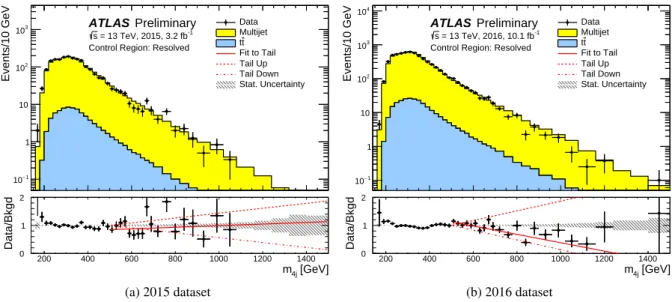
Control region data is used to validate the background model, particularly the multijet model, as well as to assign systematic uncertainties as described in Section 5.3. Table 1 compares the observed data yield in the control region with the corresponding background estimate. The modelling of the
m4jdistribution in the control region is shown in Figure 4. The 4-tag events in the control region are well-described by the background model in both normalization and
m4jshape.
5.3 Systematic uncertainties
Systematic uncertainties on the modelling of signal and background processes are evaluated. The model- ling of signals and
tt¯ backgrounds share common sources of systematic uncertainty because they depend on MC simulation: detector modelling uncertainties and theoretical uncertainty in the acceptance.
The theoretical uncertainties are fully correlated between the 2015 and 2016 datasets. The uncertainties
on the acceptance comprise: missing higher-order terms in the matrix elements and PDF set, as well as
[GeV]
m4j
200 400 600 800 1000 1200 1400
Data/Bkgd
0 1 2
Events/10 GeV
−1
10 1 10 102
103
Data Multijet
t t Fit to Tail Tail Up Tail Down Stat. Uncertainty
Preliminary ATLAS
Control Region: Resolved = 13 TeV, 2015, 3.2 fb-1
s
(a) 2015 dataset
[GeV]
m4j
200 400 600 800 1000 1200 1400
Data/Bkgd
0 1 2
Events/10 GeV
−1
10 1 10 102
103
104
Data Multijet
t t Fit to Tail Tail Up Tail Down Stat. Uncertainty
Preliminary ATLAS
Control Region: Resolved = 13 TeV, 2016, 10.1 fb-1
s
(b) 2016 dataset
Figure 4: Them4jdistribution in the control region of the resolved analysis for the data and the predicted background (top panels) for (a) the 2015 dataset and (b) the 2016 dataset. The data to background ratio (bottom panels) is shown with the statistical uncertainty on the background prediction as the grey band. The first-order polynomial fit to the data-to-background ratio above 500 GeV — used to define the multijet shape systematic uncertainty in this mass range — is shown as the solid red line, with the associated uncertainties “Tail Up” and ”Tail Down” as dashed lines.
modelling of the underlying event, hadronic showers, initial- and final-state radiation. The total theoretical uncertainty is dominated by the uncertainties associated with the modelling of the initial- and final-state radiation.
The following detector modelling uncertainties are evaluated: uncertainties in the jet energy scale (JES) and resolution (JER), and uncertainties in the
b-tagging efficiency. These uncertainties are fully correlated between 2015 and 2016. The MC simulated samples also share common luminosity uncertainties described in Section 3, which are completely uncorrelated between 2015 and 2016. The jet energy uncertainties are derived from the 2015 dataset, using in situ measurement techniques described in Refs. [50–52].
The JES systematic uncertainty is evaluated following the prescription outlined in Ref. [53]. The JER uncertainty is evaluated by smearing jet energies according to the systematic uncertainties of the resolution measurement [53]. The uncertainty in the
b-tagging efficiency is evaluated by propagating the systematic uncertainty in the measured tagging efficiency for
b-jets [54]. The efficiencies are measured as a function of
b-jet
pTand
η. For
b-jets with
pT >300 GeV, systematic uncertainties in the tagging efficiencies are extrapolated with MC simulation and are consequently larger [19].
Systematic uncertainties in the normalization and shape of the multijet background model are treated as
uncorrelated in the 2015 and 2016 datasets. Both uncertainties are assessed for each year in the control
region. For 2015, the background prediction in the control region agrees with the observed data to within
0
.2%, with good agreement in the 2016 dataset as well, with the yields agreeing within 2%. To further test
the robustness of the background estimation, the background models for the 2015 and 2016 datasets are re-
evaluated using different sideband and control region definitions and different
b-tagging requirements on
the 2-tag sample. These variations comprise testing dummy signal regions centred on
(90 GeV
,86 GeV
)and
(160 GeV,153 GeV), where no observable signal is expected; using only the inner or outer half of
the sideband region; adding an inner radius to the control region to move it further from the signal region;
shifting the centre of the control region; and tightening and loosening the
b-tagging vetoes applied in the 2-tag sample. The largest discrepancy observed in these variations in both 2015 and 2016 is
±5%, which is used as the normalisation uncertainty.
These changes affect the kinematic and flavour compositions of the various regions used in the background prediction. The control region agreement and signal region predictions of all variations considered are all consistent to within the assigned uncertainties in the multijet background prediction.
The uncertainties in the description of the multijet
m4jdistributions is determined by comparing the background predictions to the data in the control region and dummy signal regions. The description of the kinematic turn-on and peak of the distribution are evaluated by fitting Landau functions to both 2-tag and 4-tag data in the dummy signal regions. The differences between the four-tag and two-tag fit parameters are then propagated to the signal region prediction.To evaluate the level of agreement in the high mass tail, linear fits are performed on the ratios of the distributions as shown in Figure 4. These fits, along with their uncertainties, are shown in the bottom panels of Figure 4. They both have slopes consistent with zero. The uncertainties in the multijet background shapes are defined using the uncertainties in the fitted slopes. These uncertainties are also tested further using variations in the definitions of the control and sideband regions and the
b-tagging requirements used for the 2-tag sample. The shape in each of these variations is consistent within the assigned uncertainties.
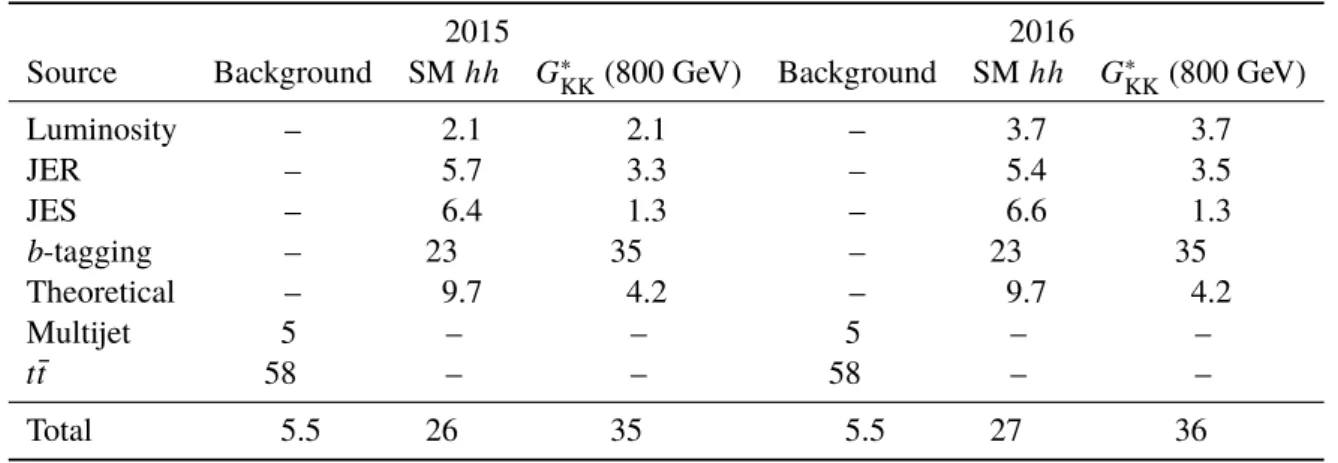
Table 2 summarizes the relative impact of the uncertainties in the event yields.
Table 2: Summary of systematic uncertainties (expressed in percentage yield) in the total background and signal event yields in the signal region of the resolved analysis. Uncertainties are provided for both the 2015 and 2016 analyses for background, for non-resonant SM Higgs pair production and for aG∗
KKresonance in the Bulk RS model withk/M¯Pl= 1 andm=800 GeV.
2015 2016
Source Background SM
hh G∗KK
(800 GeV) Background SM
hh G∗KK
(800 GeV)
Luminosity – 2.1 2.1 – 3.7 3.7
JER – 5.7 3.3 – 5.4 3.5
JES – 6.4 1.3 – 6.6 1.3
b
-tagging – 23 35 – 23 35
Theoretical – 9.7 4.2 – 9.7 4.2
Multijet 5 – – 5 – –
t¯t
58 – – 58 – –
Total 5.5 26 35 5.5 27 36
5.4 Signal region event yields
The predicted number of background events in the signal region, the number of events observed in the
data, and the predicted yield for two potential signals are presented in Table 3 for both the 2015 and
2016 datasets. The numbers of predicted background events and observed events in both years are in
agreement.
Table 3: The number of predicted background events in the signal region for the resolved analysis compared to the data, for the 2015 and 2016 datasets. The yields for two potential signals, SM non-resonant Higgs pair production and an 800 GeVG∗
KK resonance with k/M¯Pl = 1 are shown. The quoted errors include both the statistical and systematic uncertainties.
Sample 2015 Signal Region 2016 Signal Region
Multijet 1 131
±68 3 670
±200
t¯t
57
±34 190
±110
Total 1 189
±76 3 860
±230
Data 1 231 3 990
SM
hh0.47
±0.12 1.5
±0.4
G∗
KK (
800 GeV
),
k/M¯
Pl= 1 8
±3 24
±8
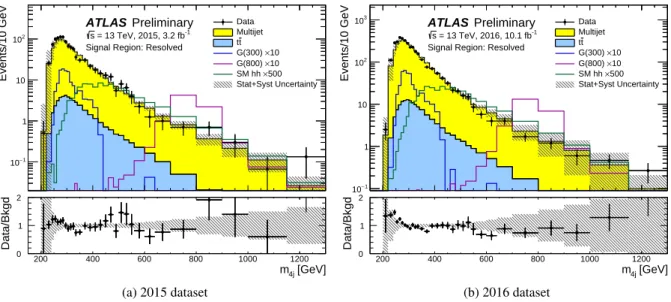
Figure 5 shows comparisons of the predicted
m4jbackground distributions to that observed in the 2015 and 2016 datasets. The predicted background and observed distributions are in agreement, with no significant local excess.
[GeV]
m4j
200 400 600 800 1000 1200
Data/Bkgd
0 1 2
Events/10 GeV
−1
10 1 10 102
Data Multijet
t t
×10 G(300)
×10 G(800)
×500 SM hh
Stat+Syst Uncertainty
Preliminary ATLAS
Signal Region: Resolved = 13 TeV, 2015, 3.2 fb-1
s
(a) 2015 dataset
[GeV]
m4j
200 400 600 800 1000 1200
Data/Bkgd
0 1 2
Events/10 GeV
−1
10 1 10 102
103 Data
Multijet t t
×10 G(300)
×10 G(800)
×500 SM hh
Stat+Syst Uncertainty
Preliminary ATLAS
Signal Region: Resolved = 13 TeV, 2016, 10.1 fb-1
s
(b) 2016 dataset
Figure 5: Distributions ofm4j in the signal region of the resolved analysis for (a) 2015 data and (b) 2016 data, compared to the predicted backgrounds. The hatched bands shown in the data/background ratio in the bottom panels represent the combined statistical and systematic uncertainties in the total background estimates. The expected signal distributions for SM non-resonanthhproduction andG∗
KKresonances with masses of 300 and 800 GeV are also shown.
6 Boosted analysis
The boosted analysis is optimised to discover signals that result in high-mass resonant Higgs boson pairs.
The strategy is to select two Higgs candidates with mass near
mheach composed of a single anti-
kt R=1
.0 jet with at least one
b-tagged track-jet ghost-associated [48] to it. Different signal samples are defined based on the total number of
b-tagged track-jets associated with the Higgs boson candidates. In contrast to the resolved analysis, the differences observed between the 2015 and 2016 datasets are minimal due to the higher
pTthresholds and so the two datasets are combined at the event level.
As in the resolved analysis, the mass of the two Higgs boson candidates system,
m2J, is used as the final discriminant between Higgs boson pair production and the SM backgrounds.
6.1 Selection
The boosted analysis selects events with at least two anti-
kt R =1
.0 (large-
R) jets with
pT >250 GeV,
|η| <
2.0, and mass
mJ>50 GeV. Only the two jets with highest
pTare retained for further selection. As a result of the trigger thresholds, the leading jet is required to have
pT >450 GeV. This high threshold also suppresses
t¯tevents, since all decay products from a top quark decay would be contained in a single jet, with mass close to that of the top quark. The efficiency for signal events to have two jets satisfying these requirements is shown in Figure 6(a) as the curve labelled “large-
Rjets
≥2”.
Since high-mass resonances tend to produce jets that are more central than multijet background processes, the two large-
Rjets are required to have a separation
|∆η| <1.7. The efficiency of this requirement is shown in Figure 6(a) as “
|∆ηhh| <1
.7”.
To be considered as a Higgs boson candidate, each large-
Rjet must have at least one
b-tagged
R=0
.2 track-jet ghost-associated to it. These track-jets are required to be consistent with the primary vertex of the event as well as to satisfy
pT >10 GeV and
|η| <2.5. The
b-tagging requirement has been evaluated as 77% efficient for those jets containing
b-hadrons in
t¯tevents. The efficiency of this requirement is shown in Figure 6(a) as “b-tagged track-jets
≥2”.
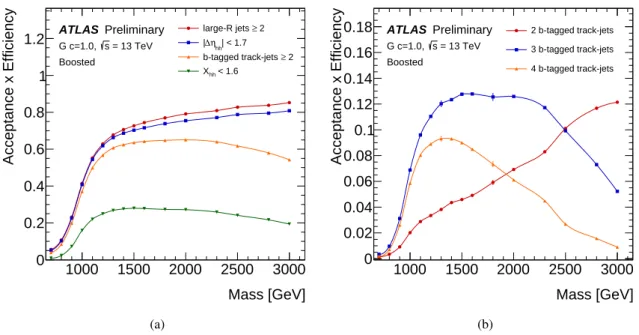
Three separate samples of events are selected, defined by the total number of
b-tagged track-jets associated to the Higgs boson candidates. The “two-tag-split” selection, requires each Higgs boson candidate to have exactly one associated
b-tagged track-jet. The “three-tag” and “four-tag” samples require that there are exactly three or exactly four b-tagged track-jets associated to Higgs boson candidates in the event, with two
b-tagged jets associated with one candidate and one or two associated with the other candidate. Increasing the required number of associated
b-tagged track-jets in the event increases signal purity, but at the expense of lower signal efficiency. As illustrated in Figure 6(b), this loss of efficiency is particularly pronounced for the highest resonance masses. It is difficult to identify four distinct track-jets containing
b-hadrons in these high mass events not only due to the inefficiency in
b-tagging high-
pTtrack-jets, but also because it is difficult to resolve each
b-quark as a separate track-jet due to the extremely high Lorentz boosts.
Signal event candidates are selected if each of the large-
Rjets has a mass consistent with that of the Higgs boson. This is defined analogously to the resolved analysis in Eq. (2):
Xhh = vu t
* ,
mlead
J −
124 GeV 0
.1
mleadJ
+ -
2
+* ,
msubl
J −
115 GeV 0
.1
msublJ
+ -
2
<
1
.6 (4)
Mass [GeV]
1000 1500 2000 2500 3000
Acceptance x Efficiency
0 0.2 0.4 0.6 0.8 1 1.2
≥ 2 large-R jets
| < 1.7 ηhh
∆
|
≥ 2 b-tagged track-jets
< 1.6 Xhh
ATLAS Preliminary = 13 TeV s G c=1.0, Boosted
(a)
Mass [GeV]
1000 1500 2000 2500 3000
Acceptance x Efficiency
0 0.02 0.04 0.06 0.08 0.1 0.12 0.14 0.16
0.18 2 b-tagged track-jets
3 b-tagged track-jets 4 b-tagged track-jets ATLAS Preliminary
= 13 TeV s G c=1.0, Boosted
(b)
Figure 6: (a) The absolute selection efficiency of the boosted analysis as a function of the generatedG∗
KK mass at each stage of the event selection. The trigger efficiency is 100% after the requirement for 2 large-Rjets, so is not shown. (b) The selection efficiency of variousb-tagged track-jet requirements after requiring Xhh <1.6, as a function of the generatedG∗
KKmass.
with the
R =0
.4 dijet masses replaced by the large-
Rjet masses,
mleadJ
and
msublJ
. The requirement of
Xhh <1.6 is retained to define the signal region in the leading–subleading Higgs boson candidate mass plane, as illustrated in Figure 7. The efficiency of this requirement is shown in Figure 6(a) as
“
Xhh <1
.6”.
6.2 Background estimation
As in the resolved analysis, the principle background is multijet events, which comprise 83-87% of the total background (depending on the number of
b-tagged track-jets required), with the remainder being dominated by
t¯tevents. All other sources of background, including processes involving Higgs bosons, are negligible. The multijet events are modelled entirely using data. In contrast, while the
t¯tyield is also estimated using a data-driven technique, the
m2Jshape is taken from MC.
The multijet background is modelled using independent data samples selected using the same trigger and selection requirements as described above, except for the
b-tagging requirements: while the Higgs boson candidates must have the requisite number of track-jets associated to them to model each sample, it is required that all these track-jets must fail the
b-tagging requirement. These three samples will be referred to collectively as “zero-tag” samples and have a multijet fraction of over 99%.
In a similar manner to the estimation of multijet yields in the resolved analysis, the normalisation of the multijet background is derived using a signal-free sideband region, in this case defined as:
36 GeV
<q (mleadJ −
124 GeV)
2+(msublJ −
115 GeV)
2<63 GeV
.In contrast to the resolved analysis however, this sideband region is also used to derive the normalisation of the
t¯tbackground. A control region between the signal and sideband regions is again used to verify the background models and to assign systematic uncertainties. The regions of the
mleadJ
-
msublJ
plane are depicted in Figure 7.
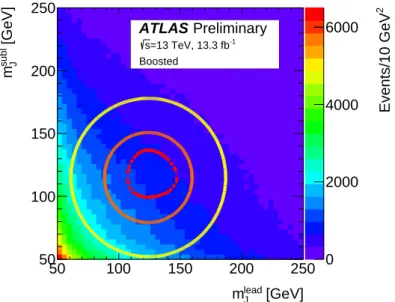
2 Events/10 GeV
0 2000 4000 6000
[GeV]
lead
mJ
50 100 150 200 250
[GeV]subl Jm
50 100 150 200 250
ATLAS Preliminary
=13 TeV, 13.3 fb-1
s Boosted
Figure 7: Themsubl
J vs. mlead
J distribution for the boosted analysis background model. The signal region is the area surrounded by the dashed red contour line, centred on (mlead
J =124 GeV,msubl
J =115 GeV). The control region is the area between the signal region and the orange contour line. The sideband region is the area between the control region and the yellow contour line.
The background yield in each of the three signal samples,
Nn−tagbckgrd
(where
n-tag represents 2-, 3- and 4-tag), is evaluated using the following expression:
Nn−tag
bckgrd = µn−tag
multijetN0−tag
multijet+αn−t tag
t¯ Ntn−tag
t¯
(5)
where
N0−tagmultijet
is the number of multijet events in the 0-tag sample and
Ntn-tag¯t
are the numbers of events predicted by the
n-tag
t¯tsimulation. The parameter
µn-tagmultijet
corresponds to the ratio of multijet event yields in the
n-tag to 0-tag samples. Finally, the parameter
αnt−tagt¯
is a scale factor designed to correct the
tt¯ event yield estimated from the MC simulation.
The values of
µn−tagmultijet
and
αn−t tagt¯
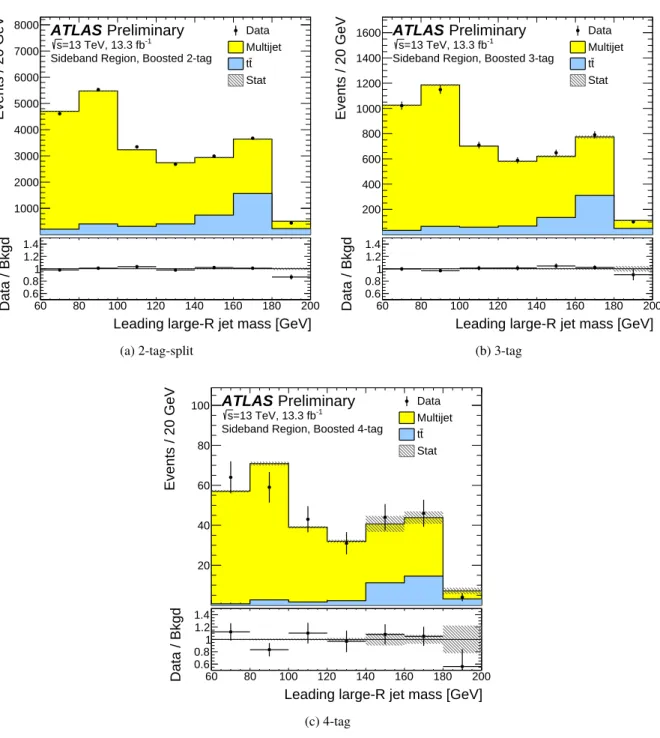
are extracted using Equation 5 from binned likelihood fits to the leading
R=1
.0 jet mass distribution, as illustrated in Figure 8. The leading jet mass distributions (both normalisation and shape) for multijet events are extracted from the relevant 0-tag sample, after subtraction of the
tt¯ contributions predicted by MC simulation. The
t¯tdistributions are taken directly from the MC simulation. The fitted values of
µmultijetand
αtt¯are given in Table 4.
Similar to the resolved analysis, corrections are made for differences between the 0-tag and 2-tag-split,
3-tag and 4-tag samples by reweighting events in the 0-tag sample. These weights are again derived in
the sideband regions, from fits to the ratio of the total background model to data for those distributions
Mass [GeV]
60 80 100 120 140 160 180 200
Events / 20 GeV
1000 2000 3000 4000 5000 6000 7000 8000
Leading large-R jet mass [GeV]
60 80 100 120 140 160 180 200
Data / Bkgd
0.6 0.8 1 1.2 1.4
ATLAS Preliminary
=13 TeV, 13.3 fb-1
s
Sideband Region, Boosted 2-tag
Data Multijet
t t Stat
(a) 2-tag-split
Mass [GeV]
60 80 100 120 140 160 180 200
Events / 20 GeV
200 400 600 800 1000 1200 1400 1600
Leading large-R jet mass [GeV]
60 80 100 120 140 160 180 200
Data / Bkgd
0.6 0.8 1 1.2 1.4
ATLAS Preliminary
=13 TeV, 13.3 fb-1
s
Sideband Region, Boosted 3-tag
Data Multijet
t t Stat
(b) 3-tag
Mass [GeV]
60 80 100 120 140 160 180 200
Events / 20 GeV
20 40 60 80 100
Leading large-R jet mass [GeV]
60 80 100 120 140 160 180 200
Data / Bkgd
0.6 0.8 1 1.2 1.4
ATLAS Preliminary
=13 TeV, 13.3 fb-1
s
Sideband Region, Boosted 4-tag
Data Multijet
t t Stat
(c) 4-tag
Figure 8: The leadingR=1.0 jet mass distributions in the sideband regions of (a) the 2-tag-split, (b) the 3-tag and (c) the 4-tag samples. The normalisation of the multijet andtt¯background predictions is estimated using a binned likelihood fit to the data. The grey hatched bands represent the statistical uncertainties on the background templates.
Table 4: The fitted values ofµmultijetandαt¯tand their correlation for the 2-tag-split, 3-tag and 4-tag samples.
Sample
µmultijet αtt¯ ρµmultijet, αtt¯
2-tag-split
(3
.63
±0
.04
)×10
−21
.44
±0
.06
−0
.65 3-tag
(8.38
±0
.17)
×10
−31
.77
±0
.16
−0
.61 4-tag
(8
.48
±0
.73
)×10
−52
.5
±1
.1
−0
.63
that exhibit the largest discrepancies: the
pTof the leading Higgs boson candidate and the
pTof the leading track-jets associated to each of the Higgs boson candidate. The reweighting is performed using up to three-dimensional distributions but is iterated so that correlations between the three variables are taken into account. After the correction process, there is agreement between the background model and sideband region data.
The impact of limited statistical precision for
m2J>1
.2 TeV in the multijet and
tt¯ models is ameliorated using a background smoothing procedure, which fits the background distributions with the following function:
f (m2J) = p1
1
− m2J√s
!p2
m2J
√s
!p3
(6) where
piare fit parameters. The multijet background is fitted in the range 1
.2 TeV
< m2J <3
.0 TeV, while the
tt¯ background is fitted in the range 1
.1 TeV
<m2J<3
.0 TeV. These fitted functional forms are then used to generate smooth background templates for the statistical analysis. Since very few simulated
t¯tevents pass the full four-tag selection, the
tt¯ distribution in the four-tag sample is taken from the three-tag distribution. A systematic uncertainty is assigned to account for this approximation.
The modelling of the background yields and kinematics is validated in the control regions of the 2-tag-split, 3-tag and 4-tag samples. Good agreement is observed between the yield in data and the yield of predicted backgrounds in the sideband and control regions of each of the samples, as shown in Table 5. Figure 9 compares the predicted background dijet mass distributions to data in the control regions of the three samples. The systematic uncertainties derived in Section 6.3 are shown. Good agreement is obtained in all cases.
Table 5: The number of events in data and predicted background events in the sideband and control regions of the 2-tag-split, 3-tag and 4-tag samples for the boosted analysis. The number of multijet andtt¯background events in the sideband regions are constrained by the number of observed events, as explained in the text. The uncertainties are statistical, with fit uncertainties included for backgrounds. The anti-correlation between the multijet andtt¯yields is accounted for in the uncertainty on the total background yield.
2-tag-split 3-tag 4-tag
Sample Sideband Control Reg. Sideband Control Reg. Sideband Control Reg.
Multijet 19 400
±200 5 917
±62 4 294
±89 1 318
±27 258
±22 84.3
±7.1
tt¯ 3 860
±160 1 038
±45 720
±68 189
±19 36
±16 10.1
±4.5 Total 23 260
±160 6 954
±52 5 014
±73 1 507
±24 294
±17 94.4
±5.8
Data 23 277 7 200 5 007 1 529 291 81
mHH [GeV]
0 500 1000 1500 2000 2500 3000 3500
Events / 100 GeV
1 10 102
103
104
[GeV]
m2J 0 500 1000 1500 2000 2500 3000 3500
Data / Bkgd
0.5 1 1.5 2
ATLAS Preliminary
=13 TeV, 13.3 fb-1
s
Control Region, Boosted 2-tag
Data Multijet
t t Stat+Syst
(a) 2-tag-split
mHH [GeV]
0 500 1000 1500 2000 2500 3000 3500
Events / 100 GeV
1 10 102
103
[GeV]
m2J 0 500 1000 1500 2000 2500 3000 3500
Data / Bkgd
0.5 1 1.5 2
ATLAS Preliminary
=13 TeV, 13.3 fb-1
s
Control Region, Boosted 3-tag
Data Multijet
t t Stat+Syst
(b) 3-tag
mHH [GeV]
0 500 1000 1500 2000 2500 3000 3500
Events / 100 GeV
1 10 102
[GeV]
m2J 0 500 1000 1500 2000 2500 3000 3500
Data / Bkgd
0.5 1 1.5 2
ATLAS Preliminary
=13 TeV, 13.3 fb-1
s
Control Region, Boosted 4-tag
Data Multijet
t t Stat+Syst
(c) 4-tag
Figure 9: Them4jdistribution in the control region of the boosted analysis for the data and the predicted background (top panels) for (a) the 2-tag-split, (b) the 3-tag and (c) the 4-tag samples. The data to background ratio (bottom panels) is shown with the statistical uncertainty plus the control region normalisation and shape uncertainties on the background prediction shown as the grey hatched band.