ATLAS-CONF-2016-107 29September2016
ATLAS NOTE
ATLAS-CONF-2016-107
27th September 2016
Z Boson Production in p p Collisions at √
s = 5.02 TeV with the ATLAS detector at the LHC
The ATLAS Collaboration
Abstract
The production of Z bosons in the di-muon decay channel inppcollisions at √
s=5.02 TeV is measured with the ATLAS detector. Data from the 2015 LHC run corresponding to a total integrated luminosity of 24.7 pb−1are used. Integrated fiducial cross section is measured to beσfid.Z = 590 ± 9 (stat.)± 12 (syst.)± 32 (lumi.) pb. The results from pp collisions are compared to the previously measured data in the proton-lead collisions system at the same energy. Results of the measurement are also compared to theoretical predictions based on NNLO and NLO QCD calculations. Information on the nuclear modification factor RpPb, forZbosons in proton-lead collisions is extracted from the comparison.
©2016 CERN for the benefit of the ATLAS Collaboration.
Reproduction of this article or parts of it is allowed as specified in the CC-BY-4.0 license.
1 Introduction
Experimental study of electroweak bosons in relativistic heavy ion (HI) collisions at the Large Hadron Collider (LHC) is an integral part of the physics program carried out by all four detectors taking data at the LHC. The results of these programs have demonstrated several important phenomena, which have fundamental implications for the entire field of HI physics. Measurements performed by the ATLAS and CMS experiments withZandW decaying leptonically or semileptonically show that the production rate of non-strongly interacting particles scales with the nuclear thickness functionTAA [1,2,3,4]. Results that are obtained with the isolated high-energy photons [5,6] are also consistent with this observed binary scaling.
The momentum and rapidity distributions ofZ bosons and muons coming from theW bosons measured in Pb+Pb collisions at √
sNN =2.76 TeV are consistent with Pythia[7] simulations of nucleon-nucleon collisions multiplied by the hTAAi [1, 2, 4]. Z boson production in Pb+Pb collisions was found to be consistent with next-to-leading order perturbative Quantum Chromodynamics (NLO QCD) calculations that do not include nuclear modifications in the treatment of parton distribution functions (PDF). However, nuclear PDF modification cannot be excluded within the precision of the current measurements [1].
Study of asymmetric collisions systems, such asp+Pb at the LHC may be used to differentiate between initial and final state effects in HI collisions. The first results using 2013p+Pb data on boson production were published by the ATLAS [8] and CMS [9,10] experiments. They show that calculations including nuclear PDF modification better describe the data better than those without, and that the modification may also have centrality dependence. The rates of Zboson production inp+Pb collisions help to understand the problem of centrality definitions inp+Pb collisions and the contribution of colour charge fluctuations to Glauber model calculations [11,12].
Nuclear modifications were previously estimated using predictions based on existing PDF sets [8], mak- ing the estimates model dependent. With the newppdataset available at the same center-of-mass energy, the nuclear modification can be measured by using data only. This note presents the first preliminary results on measuringZboson production in theZ → µµdecay channel inppcollisions at √
s=5.02 TeV with the ATLAS detector at the LHC. The measured observables are the integrated cross section in the fiducial volume and the rapidity differential cross section. These new data combined with the 2013 pub- lished ATLASp+Pb results at √
sNN=5.02 TeV allow the first measurement of the nuclear modification factor,RpPb, forZbosons in proton-lead collisions.
2 ATLAS detector
The ATLAS detector [13] at the LHC covers nearly the entire solid angle around the collision point. It consists of an inner tracking detector surrounded by a thin superconducting solenoid, electromagnetic and hadronic calorimeters, and a muon spectrometer incorporating three large superconducting toroid magnet systems.
The inner-detector system (ID) is immersed in a 2 T axial magnetic field and provides charged particle
tracking in the pseudorapidity range|η| < 2.51. The high-granularity silicon pixel detector covers the vertex region and it is followed by the silicon microstrip tracker and transition radiation tracker.
The calorimeter system covers the range|η| < 4.9. Within the region |η| < 3.2, electromagnetic calor- imetry is provided by barrel and end-cap high-granularity lead liquid-argon (LAr) calorimeters, with an additional thin LAr presampler covering|η| < 1.8. The most forward part of the ATLAS Calorimeter covering pseudorapidity intervals 3.1< |η| < 4.9 is called forward calorimeter (FCal).
The muon spectrometer (MS) comprises separate trigger and high-precision tracking chambers measuring the deflection of muons in a magnetic field generated by superconducting air-core toroids. The precision chamber system covers the region|η| < 2.7 with three layers of monitored drift tube chambers (MDT), complemented by cathode strip chambers (CSC) in the innermost layer of the forward region, where the background is highest.
The muon trigger system covers the range |η| < 2.4 with resistive plate chambers (RPC) in the barrel, and thin gap chambers (TGC) in the endcap regions. Muon candidates are first identified at the level one (L1) trigger based on signals from the fast-response RPC chambers in the region|η| <1.05 and the TGC chambers in the region 1.05 < |η| < 2.4. The L1 detector position information is then used by the high- level trigger (HLT) to reconstruct muon tracks in the region of interest around the muon found by the L1 trigger. In the HLT, the track parameters of each muon were recalculated by including the precision data from the MDT or CSC.
3 Datasets and simulation samples
The ppdata sample used in this analyses was obtained during the HI LHC run in November-December 2015. Thepprun had integrated luminosity of 24.7±1.3 pb−1at √
s=5.02 TeV. The average number of interactions per bunch crossing during the data taking was 1.3.
Events used in this analysis are obtained with the HLT trigger firing on the muons with online momentum estimate above 14 GeV. All events satisfying these conditions were recorded during the data taking.
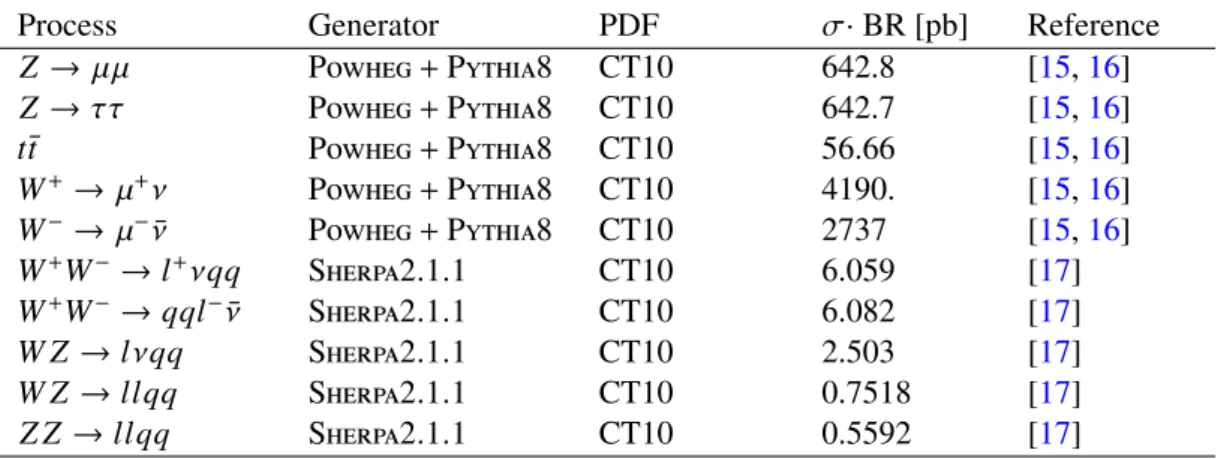
The physics processes have been simulated using three different Monte Carlo (MC) generators and traced through the ATLAS detector using Geant 4 [14]. The same offline reconstruction was used both for simulation and data and the simulation samples were produced with the same number of interactions per bunch crossing as in the data. Z → µµevents were generated in order to calculate the efficiency and acceptance of the ATLAS detector in measuringZbosons. In addition, several background processes were generated to assess their contribution to the measurement:Z →ττ,t¯t,W →µν, and several diboson samples from which the only significant contribution comes fromW bosonZ → llqq and Z Z → llqq samples. A summary of the simulated samples is given in Table1.
1The ATLAS reference system is a Cartesian right-handed coordinate system, with the nominal collision point at the origin.
The anticlockwise beam direction defines the positivez-axis, while the positivex-axis is defined as pointing from the collision point to the center of the LHC ring and the positivey-axis points upwards. The azimuthal angleφis measured around the beam axis, and the polar angleθis measured with respect to thez-axis. Pseudorapidity is defined asη=−ln(tan(θ/2)).
Process Generator PDF σ·BR [pb] Reference
Z →µµ Powheg+Pythia8 CT10 642.8 [15,16]
Z →ττ Powheg+Pythia8 CT10 642.7 [15,16]
t¯t Powheg+Pythia8 CT10 56.66 [15,16]
W+→µ+ν Powheg+Pythia8 CT10 4190. [15,16]
W−→µ−ν¯ Powheg+Pythia8 CT10 2737 [15,16]
W+W−→l+νqq Sherpa2.1.1 CT10 6.059 [17]
W+W−→qql−ν¯ Sherpa2.1.1 CT10 6.082 [17]
W Z→lνqq Sherpa2.1.1 CT10 2.503 [17]
W Z→llqq Sherpa2.1.1 CT10 0.7518 [17]
Z Z→llqq Sherpa2.1.1 CT10 0.5592 [17]
Table 1: Simulation samples used in the analysis.
4 Analysis
4.1 Event Selection
Events are selected for further analysis if they contain at least two reconstructed muons with at least one of them triggering the event. Both muons must satisfy the following criteria: pT > 20 GeV,|η| < 2.4, and reconstruction quality parameters which satisfy “medium” reconstruction quality [18]. The muons are also required to be isolated, i.e. the energy measured by the ATLAS calorimeters in the vicinity of the muon should not exceed a certain value, which depends on the muon momentum. The isolation requirement is tuned so that the muon identification efficiency varies smoothly in a gradient from 90% at pT = 25 GeV to 99% at pT = 60 GeV. Measured isolation efficiency for medium muons in 5 TeV data from 20-25 GeV range yields 94% efficiency for this working point.
All muons in the same event are paired together regardless of their charge, and pairs with invariant mass of 66< mµ µ <116 GeV are selected. There are 7293 opposite-charge pairs and 4 same-sign charge pairs found in the data that satisfy all above mentioned criteria. The opposite-charge pairs are considered as Zboson candidates for further analysis. The number of same-charge pairs is consistent with the level of charge misidentification expected from the MC simulation, nevertheless these pairs are not included in the analysis. TheZ candidates coming from different muons in the same event are not vetoed but such events are not found in the data.
Several background sources contribute to the opposite-sign pairs; multi-jet background contribution was studied with a data driven method and found to be negligible and the electroweak (EW) background con- tribution is estimated using the MC simulations mentioned in the previous section. The contribution from cosmic muons to the signal is estimated to be negligible. The invariant mass distributions of opposite sign pairs is shown in Fig.1. Signal simulation is normalised to NNLO predictions and different contributions are added together in forming the ratio of data to MC prediction. The contribution of ‘diboson events’, those in which in addition to a Z another EW boson is produced, make up about 0.08% of the selected data. This analysis is an inclusive measurement ofZ boson production and so these are not considered as coming from background process. Other diboson processes (such asW W) have no significant contri- bution to the background. Background processes are estimated to comprise about 0.3% of the selectedZ boson candidates.
[GeV]
µ- µ+
60 70 80 90 100 m110 120
] -1 dN/dm [GeV
10-1
1 10 102
103
104 pp, s= 5.02 TeV , 24.7 pb -1
data µ µ
→ Z diboson
τ τ
→ Z
t t →µν W ATLAS Preliminary
[GeV]
µ- µ+
60 70 80 90 100 110m 120
Data / MC
0.4 0.6 0.8 1 1.2 1.4 1.6
Figure 1: The invariant mass distribution of dimuon pairs selected asZ boson candidates. In addition to the data, MC simulations of theZ → µµand background sources are also shown. The MC estimated contribution of diboson events where one of the bosons is a Z boson decaying to two muons is also shown, and considered as contributing to the signal (see text).
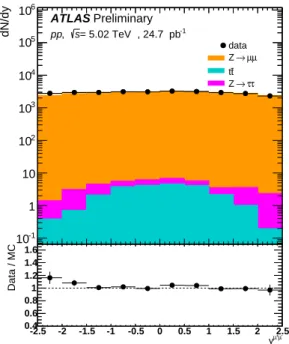
Figure 7 shows the rapidity distribution of the Z boson candidates along with the expectations from simulation for the Z boson production and the background.
µ- µ+
y -2.5 -2 -1.5 -1 -0.5 0 0.5 1 1.5 2 2.5
dN/dy
10-1
1 10 102
103
104
105
106
= 5.02 TeV s
,
pp , 24.7 pb -1
data µ µ
→ Z
t t
τ τ
→ Z ATLAS Preliminary
µ- µ+
y -2.5 -2 -1.5 -1 -0.5 0 0.5 1 1.5 2 2.5
Data / MC
0.4 0.6 0.8 1 1.2 1.4 1.6
Figure 2: Theydistribution of dimuon pairs selected asZboson candidates are shown. In addition to the data, MC simulations of theZ → µµand background sources are also shown.
4.2 Acceptance and efficiency correction factors
To measure theZ boson inclusive and differential cross sections, the data is corrected for detector accept- ance and efficiency based on the MC simulation. The acceptance correction is obtained as the inverse ratio of the generatedZbosons with kinematics corrected for QED radiative effects within the mass win- dow from 66 GeV to 116 GeV and inside the|yZ|<2.5 to the bosons having the decay muons inside the fiducial volume:pTµ>20 GeV and|ηµ| < 2.4. The efficiency correction factor accounts for muon trigger, reconstruction, and isolation. It is the inverse ratio of generatedZ bosons inside the fiducial volume to the reconstructedZ candidates.
To achieve the highest accuracy in the estimates of the efficiency, data-driven calculations are used to correct the MC simulation. The general method of measuring efficiency from data is the ‘tag-and-probe’
technique [18]. In this technique, a ‘tag’ is defined as a fully reconstructed high quality muon, whereas the ‘probe’ is a muon candidate unbiased by trigger, reconstruction, or other requirements. Selecting tag-and-probe pairs with invariant mass consistent withZ bosons or J/Ψresonances, gives a sample of probe muons that are both highly pure and unbiased from which the efficiency of the probe is calculated.
For example, the MS reconstruction efficiency is measured from probes of charged particle tracks in the ID without ana prioriMS signal requirement. The ratio of the efficiency calculated from data to the same quantity calculated from MC simulation, is a ‘scale factor’ which is used to correct the MC simulation.
More details about the procedure are found in [18]. Scale factors applied to the MC simulation for muon reconstruction and isolation are taken from the much larger data and MC simulation samples of pp collisions at √
s =13 TeV, taken under similar data taking and detector conditions as the presently discussed data sample (the difference in pile-up between the datasets has shown not to affect the muon performance). The trigger used in the current analysis is different than the one used in the 13 TeV data, therefore the trigger scale factors are calculated from the current dataset.
The product of the acceptance and efficiency factors is used for correcting the totalZboson yields in data.
The correction factor is roughly two; slightly decreasing as a function ofpTZ, and increasing at forward rapidity.
Correcting for efficiency as described above, intrinsically includes a bin-by-bin unfolding correction for the pTZand yZ resolutions of the detector. After integration over pTZfor the measurement of the rapid- ity differential cross section the effect of bin-by-bin correction in pTZis negligible. Imperfections in the rapidity pointing resolution are also found to be negligible.
4.3 Systematic Uncertainties
The main sources of systematic uncertainty are associated with the background subtraction and the cor- rection factors used in bin-by-bin unfolding. The second contribution arises from muon reconstruction correction factors (reconstruction, isolation, and trigger) and the statistical uncertainties of the MC simu- lation used for the evaluation of these correction factors.
The reconstruction and isolation uncertainties, like the scale factors, are estimated based on data and MC simulation samples at √
s =13 TeV. Due to the difference in pile-up between the datasets, isola- tion efficiency was evaluated in the present data sample and compared with the values obtained from
√s=13 TeV data. A slight discrepancy, at the level of approximately 0.5%, was found for the isolation
efficiency between the √
s=5.02 TeV and √
s=13 TeV datasets. The trigger reconstruction efficiency un- certainty is driven by the uncertainty associated with the limited statistics in the present dataset available for the tag-and-probe method.
The uncertainty associate with the background subtraction is estimated by varying the cross sections of each background process by 10%.
Uncertainty on the bin-by-bin unfolding is estimated by varying each bin of the unfolding matrix accord- ing to its statistical uncertainties. There is an additional uncertainty on the rapidity shape of the correction factor that comes to 4% in the most forward bin.
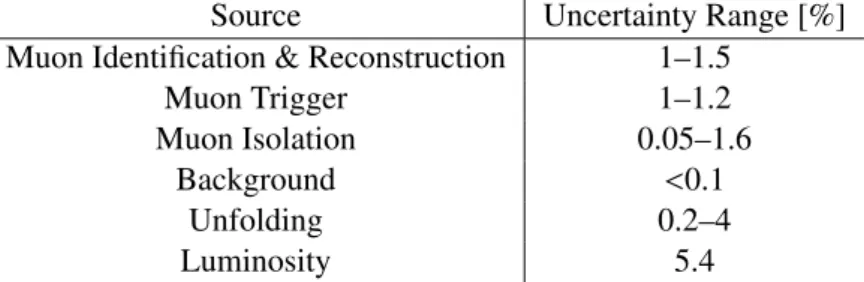
Each uncertainty source is calculated differentially in yZ. Table2summarises the systematic uncertain- ties.
Source Uncertainty Range [%]
Muon Identification & Reconstruction 1–1.5
Muon Trigger 1–1.2
Muon Isolation 0.05–1.6
Background <0.1
Unfolding 0.2–4
Luminosity 5.4
Table 2: Relative systematic uncertainties, in percent, in the measurement ofZ → µµ.
In addition there is a 5.4% systematic uncertainty associated with measuring the integrated luminosity of theppcollision dataset.
5 Results
The cross-section is defined for the mass window 66 < mµ µ < 116 GeV, the rapidity window |yZ| <
2.5, and the full decay lepton kinematic phase-space. It is measured to be 590 ±9 (stat.)±12 (syst.)±
32 (lumi.) pb. The simulated MC sample which is used for corrections, described in section 3, has a significantly lower cross section (as shown in Figs.1,7) of 537 pb. However, a similar but more accurate NNLO calculation using the CT14 PDF [19] and calculated using a version of DYNNLO 1.5 [20, 21]
yields a cross section of 573.77+13.94−15.96pb (where the uncertainties are largely coming from the scale,αS, and PDF), which agrees well with the measurement within its uncertainties.
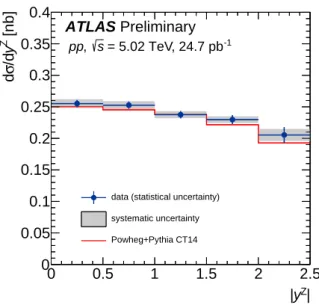
In addition to the integrated cross section, theyZ differential cross section is shown in Fig.3. Because of the symmetry in yZ, the data is shown in bins of|yZ|. The data are compared to the simulated MC generated with the CT10 PDF at NLO, scaled to the integrated cross section calculated at NNLO using the CT14 PDF. The scaled simulation is in good agreement with the data.
TheZ boson cross section measured inppcollisions may be used as a baseline to study nuclear modific- ations which may be present in the previously measured cross section inp+Pb collisions [8]. The nuclear modification factor,RpPb, is defined as the ratio of the cross sections, where theppcross section has been scaled by APb(=208):
RpPb= 1 APb
dσpPb/dy
dσp p/dy. (1)
Z| y
|
0 0.5 1 1.5 2 2.5
[nb]Z y/dσd
0 0.05 0.1 0.15 0.2 0.25 0.3 0.35 0.4
= 5.02 TeV s
,
pp , 24.7 pb -1
ATLAS Preliminary
data (statistical uncertainty) systematic uncertainty Powheg+Pythia CT14
Figure 3: The measured rapidity differential cross section. The data is compared to the simulated MC generated with the CT10 PDF at NLO, scaled to the integrated cross section calculated with DYNNLO at NNLO using the CT14 PDF set.
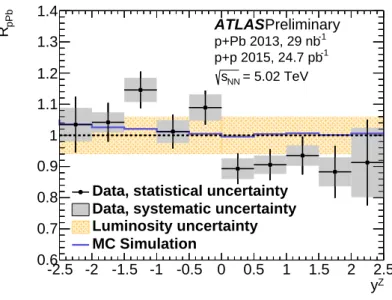
The nuclear modification factor as a function of yZ is shown in Fig. 4. In the p+Pb collision system the proton travels forward in the positive-rapidity direction and the lead ion travels backwards in the negative-rapidity direction. To calculate theRpPb, both positive and negative rapidity values from theyZ differentialp+Pb cross section are divided by the corresponding|yZ|value from the present analysis. In addition to the data, an expectedRpPbbased on the presence of protons and neutrons in the lead nucleus (pn→ Zhas a slightly different cross section thanpp→Z) is calculated from simulation as:
RMCpPb= 126σpn+82σp p
208σp p . (2)
The figure shows enhancement in the lead-going direction and suppression in the proton-going direction.
This is consistent with nuclear PDF modification present inside the lead nucleus as discussed in [8].
For a deeper understanding of the nuclear modification, we may study its effects as a function of thep+Pb centrality [8]. The centrality dependent nuclear modification factor yield is defined as:
RcentpPb= 1 hTpPbicent
1/NevtcentdNpPbcent/dy
dσp p/dy , (3)
where hTpPbi is the mean nuclear thickness function that measures nuclear flux (overlap) seen by the proton inp+Pb collisions, NpPbis the number ofZ boson candidates measured in p+Pb collisions, and Nevt is the total number of inelastic events. Using the rapidity differential yield ofZ boson candidates in different centrality classes measured inp+Pb collisions [8], the centrality dependent nuclear modification factor is calculated and plotted in Fig.5. Thep+Pb data are rebinned compared to Fig.4, because of the limited statistical precision in each centrality class.
Results suggest that the asymmetry seen in Fig.4 is more pronounced for more central collisions. To quantify the change in asymmetry in different centrality classes, each RcentpPb distribution is fit to a linear
yZ
-2.5 -2 -1.5 -1 -0.5 0 0.5 1 1.5 2 2.5
pPbR
0.6 0.7 0.8 0.9 1 1.1 1.2 1.3 1.4
Data, statistical uncertainty Data, systematic uncertainty Luminosity uncertainty MC Simulation
ATLAS Preliminary p+Pb 2013, 29 nb -1
p+p 2015, 24.7 pb -1
= 5.02 TeV sNN
Figure 4: The nuclear modification factor as a function ofZboson rapidity. The uncertainties on each point include statistical and systematic uncertainties fromp+Pb and ppmeasurements. The band around unity represents the uncertainty of the luminosities. The blue line shows an expectedRpPbbased on simulation (see text).
yZ
-2 -1.5 -1 -0.5 0 0.5 1 1.5 2
pPbR
0.6 0.7 0.8 0.9 1 1.1 1.2 1.3 1.4
Data, statistical uncertainty Data, systematic uncertainty
uncertainty Luminosity & TpPb
ATLAS Preliminary p+Pb 2013, 29 nb -1
p+p 2015, 24.7 pb -1
= 5.02 TeV sNN
40-90% Centrality
yZ
-2 -1.5 -1 -0.5 0 0.5 1 1.5 2
pPbR
0.6 0.7 0.8 0.9 1 1.1 1.2 1.3 1.4
Data, statistical uncertainty Data, systematic uncertainty
uncertainty Luminosity & TpPb
ATLAS Preliminary p+Pb 2013, 29 nb -1
p+p 2015, 24.7 pb -1
= 5.02 TeV sNN
10-40% Centrality
yZ
-2 -1.5 -1 -0.5 0 0.5 1 1.5 2
pPbR
0.6 0.7 0.8 0.9 1 1.1 1.2 1.3 1.4
Data, statistical uncertainty Data, systematic uncertainty
uncertainty Luminosity & TpPb
ATLAS Preliminary p+Pb 2013, 29 nb -1
p+p 2015, 24.7 pb -1
= 5.02 TeV sNN
0-10% Centrality
Figure 5: The nuclear modification factor in three different centrality classes. The uncertainties on each point include statistical and systematic uncertainties fromp+Pb andppmeasurements. The band around unity represents the uncertainty ofhTpPbiand luminosity.
function. The resultant slopes for 40-90%, 10-40% and 0-10% centrality bins are 0.02±0.04,−0.05± 0.03 and −0.14±0.04, respectively. The uncertainties come from the fitting and are dominated by the uncertainties of thep+Pb data.
6 Summary
Using the ATLAS detector,Zboson production has been studied inpp collisions at √
s=5.02 TeV using 24.7±1.3 pb−1of integrated luminosity collected in the 2015 LHC physics run. Within|yZ| < 2.5, and 66 < ml l < 116 GeV, a total of 7293 Z boson candidates are reconstructed in the Z → µµ channels.
The measured integrated cross section is 590±9 (stat.)±12 (syst.)±32 (lumi.) pb, consistent with the NNLO prediction using the CT14 PDF of 573.77+13.94−15.96 pb. The rapidity differential cross section has been studied, and it too is in good agreement with pQCD calculations. The results are used to form the nuclear modification factor of the previously measuredZ boson cross section in p+Pb collisions at
√sNN =5.02 TeV. The nuclear modification factor measured as a function of yZ, shows an asymmetry qualitatively consistent with nuclear modification of the PDF. This asymmetry is more pronounced in centralp+Pb collisions compared to peripheral events.
References
[1] ATLAS Collaboration,Phys. Rev. Lett.110(2013) 022301,arXiv:1210.6486.
[2] ATLAS Collaboration,Eur. Phys. J.C75(2015) 23,arXiv:1408.4674.
[3] CMS Collaboration,Phys. Rev. Lett.106(2011) 212301,arXiv:1102.5435.
[4] CMS Collaboration,Phys. Lett.B715(2012) 66–87,arXiv:1205.6334.
[5] ATLAS Collaboration,Phys. Rev.C93(2016) 034914,arXiv:1506.08552.
[6] CMS Collaboration,Phys. Lett.B710(2012) 256–277,arXiv:1201.3093.
[7] T. Sjostrand, S. Mrenna, and P. Z. Skands,JHEP0605(2006) 026,arXiv:hep-ph/0603175.
[8] ATLAS Collaboration,Phys. Rev.C92(2015) 044915,arXiv:1507.06232 [hep-ex].
[9] CMS Collaboration,Phys. Lett.B759(2016) 36–57,arXiv:1512.06461.
[10] CMS Collaboration,Phys. Lett.B750(2015) 565–586,arXiv:1503.05825.
[11] V. Guzey and M. Strikman,Phys. Lett.B633(2006) 245–252,arXiv:hep-ph/0505088.
[12] M. Alvioli and M. Strikman,Phys. Lett.B722(2013) 347–354,arXiv:1301.0728.
[13] ATLAS Collaboration,JINST3(2008) S08003.
[14] S. Agostinelli et al.,Nucl. Instrum. Meth.A506(2003) 250–303.
[15] T. Sjostrand, S. Mrenna, and P. Z. Skands,Comput. Phys. Commun.178(2008) 852–867, arXiv:0710.3820.
[16] S. Alioli, P. Nason, C. Oleari, and E. Re,JHEP0807(2008) 060,arXiv:0805.4802 [hep-ph].
[17] T. Gleisberg, S. Höche, F. Krauss, M. Schönherr, S. Schumann, F. Siegert, and J. Winter, Journal of High Energy Physics2009(2009) 007,
http://stacks.iop.org/1126-6708/2009/i=02/a=007.
[18] ATLAS Collaboration,The European Physical Journal C76(2016) 1–30, http://dx.doi.org/10.1140/epjc/s10052-016-4120-y.
[19] S. Dulat, T.-J. Hou, J. Gao, M. Guzzi, J. Huston, P. Nadolsky, J. Pumplin, C. Schmidt, D. Stump, and C.-P. Yuan,Phys. Rev. D93(2016) 033006,
http://link.aps.org/doi/10.1103/PhysRevD.93.033006.
[20] S. Catani and M. Grazzini,Phys. Rev. Lett.98(2007) 222002,
http://link.aps.org/doi/10.1103/PhysRevLett.98.222002.
[21] S. Catani, L. Cieri, G. Ferrera, D. de Florian, and M. Grazzini,Phys. Rev. Lett.103(2009) 082001, http://link.aps.org/doi/10.1103/PhysRevLett.103.082001.
Appendix
yZ
-2.5 -2 -1.5 -1 -0.5 0 0.5 1 1.5 2 2.5
pPbR
0.6 0.7 0.8 0.9 1 1.1 1.2 1.3 1.4
Data, statistical uncertainty Data, systematic uncertainty Luminosity uncertainty
ATLAS Preliminary p+Pb 2013, 29 nb -1
p+p 2015, 24.7 pb -1
= 5.02 TeV sNN
Figure 6: The nuclear modification factor as a function ofZboson rapidity. The uncertainties on each point include statistical and systematic uncertainties fromp+Pb and ppmeasurements. The band around unity represents the uncertainty of the luminosities.
µ- µ+
y -2.5 -2 -1.5 -1 -0.5 0 0.5 1 1.5 2 2.5
dN/dy
10-1
1 10 102
103
104
105
106
= 5.02 TeV s
,
pp , 24.7 pb -1
data µ µ
→ Z
t t
τ τ
→ Z ATLAS Preliminary
µ- µ+
y -2.5 -2 -1.5 -1 -0.5 0 0.5 1 1.5 2 2.5
Data / MC
0.4 0.6 0.8 1 1.2 1.4 1.6
Figure 7: The correctedydistribution of dimuon pairs selected asZ boson candidates are shown. MC simulations of theZ→ µµand background sources are also shown.