ATLAS-CONF-2016-063 24/08/2016
ATLAS NOTE
ATLAS-CONF-2016-063
21st August 2016
Search for Higgs boson production via weak boson fusion and decaying to b b ¯ in association with a high-energy photon using the
ATLAS detector
The ATLAS Collaboration
Abstract
A search has been conducted for thebb¯ decay of the Standard Model Higgs boson produced through vector boson fusion in association with a photon and two jets. The search in this bbγ¯ j j signature benefits from a large reduction of the QCD jet background relative to the inclusivebb j j¯ signature and from the presence of a high-tranverse-momentum photon for triggering. Results are reported from the analysis of 12.6 fb−1of LHC proton-proton collision data at
√s =13 TeVcollected with the ATLAS detector. The observed 95% confidence level upper limit on the production cross section times branching ratio for a Higgs mass of 125 GeV is 4.0times the Standard Model expectation, and the expected upper limit is 6.0+2−1..37. The observed signal strength is−3.9+2−2..87times the Standard Model value. The analysis methods are also used to search forZ+γvector boson fusion production in the samebbγ¯ j jsignature.
The observed upper limit on theZ +γ cross section times branching ratio is 2.0times the Standard Model expectation, and the expected limit is 1.8+0−0..75. The observed Z+γ signal strength is 0.3±0.8times the Standard Model value.
This updated version includes additional references to the NLO calculation ofH+γvector boson production. It supersedes the version of 3 August 2016.
© 2016 CERN for the benefit of the ATLAS Collaboration.
Reproduction of this article or parts of it is allowed as specified in the CC-BY-4.0 license.
1 Introduction
Although the Standard Model Higgs boson decays predominantly to abb¯ quark pair, the measurement of Higgs boson production and decay in this signature has proven to be challenging. The CDF and D0 collaborations reported a combined 3.3σsignal significance forH →bb¯inpp¯collisions at the Fermilab Tevatron [1]. The current combined ATLAS+CMS results quote a 2.6σsignal significance forH →bb¯ inppcollisions, with a signal strength µ=0.70+0−0..2927times the Standard Model signal prediction [2].
The large datasets expected during Run 2 at
√s =13 TeV invite new approaches in measuring this dominant Higgs boson decay for signs of new physics. One interesting possibility is Higgs boson production through vector (weak) boson fusion (VBF) [3], which has been measured by ATLAS and CMS in a variety of decay modes, including theH →bb¯decay produced in association with two jets. CMS measured a Higgs boson signal strength, defined as the ratio of the measured signal rate to the Standard Model prediction, ofµ= 2.8+1−1..64 for VBF production ofH →bb¯ at
√s = 8 and 13 TeV, using multivariate techniques for forward-jet identification and quark-gluon separation [4]. ATLAS measured µ = −0.8±2.3, also with multivariate techniques, in
√s=8 TeV data alone. The sensitivities of these analyses are limited by very large contributions from non-resonantbb j j¯ production and by difficulties in triggering on low-transverse- momentum (pT)b-jets [5].
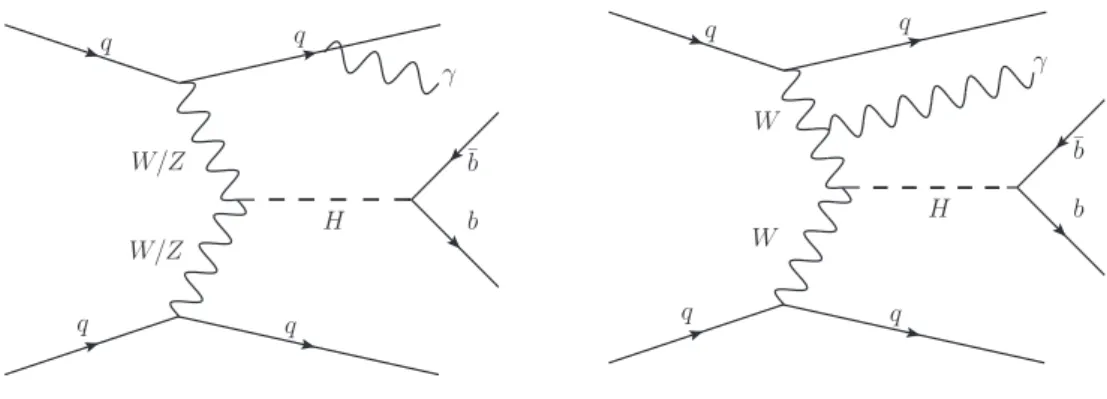
Recent studies have shown that requiring a high-pTphoton in the final state can dramatically enhance the signal-to-background ratio in the VBF production mode [6]. The photon may be radiated from an internal W±boson or from an incoming or outgoing quark, as shown in Figure1.
q q
q q
H b
¯b γ
W/Z
W/Z
q q
q q
W W
H b
¯b γ
Figure 1: Representative leading-order Feynman diagrams for Higgs boson production via vector boson fusion in association with a photon.
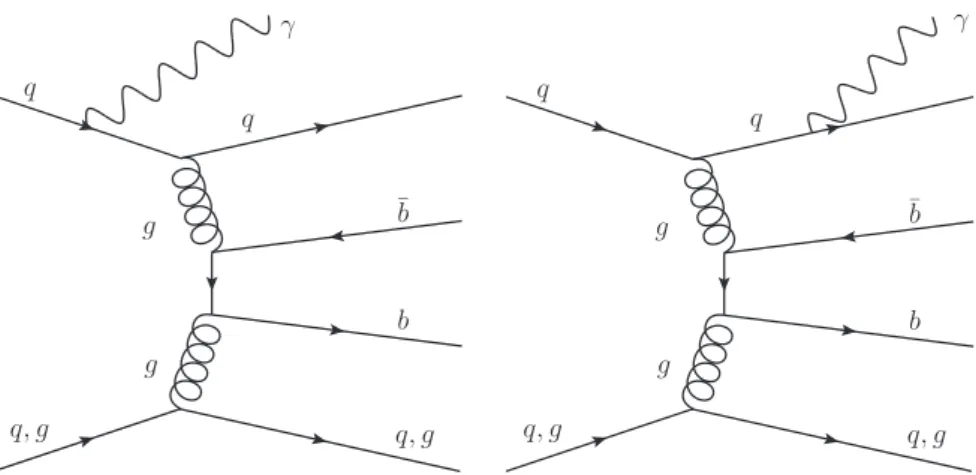
There are several advantages in considering this production mechanism, pp → Hγj j → bbγ¯ j j, even though the signal rate is reduced compared to inclusive VBF production. Firstly, the high-pT photon provides a clean signature for efficient triggering in the ATLAS first-level trigger. Secondly, the gluon- induced component of the dominant non-resonantbbγ¯ j jbackground is naturally suppressed because the gluons are not charged and do not radiate photons. Finally, destructive interference further suppresses central photon emission in the background processes [6]. The interference is between diagrams with hard central photons emitted from the initial-state quark and the final-state quark, as shown in Figure2.
Overall, the non-resonant bbγ¯ j j background is reduced by more than an order of magnitude below the simpleO(αEW) rescaling expected from the addition of the photon, where αEWis the electromagnetic fine stucture constant.
q
q
b
¯b γ
g
g
q, g q, g
q
q
b
¯b γ
g
g
q, g q, g
Figure 2: Representative leading-order Feynman diagrams for non-resonant bb¯ production in association with a photon and jets.
A search for VBF Higgs boson production in thebbγ¯ j j final state is presented in this note, along with a benchmark measurement ofZγj j production in the same signature. A brief overview of the ATLAS detector in Section2is followed by a description of the simulated samples in Section3. Details on the event selection and the background estimates are given in Sections4and5, respectively. The evaluation of systematic uncertainties is summarized in Section6, and the statistical interpretation and results are discussed in Section7.
2 ATLAS detector
ATLAS [7] is a multi-purpose particle detector with a forward-backward symmetric cylindrical geometry and nearly 4πcoverage in solid angle.1 The interaction point is surrounded by inner tracking devices, a calorimeter system, and a muon spectrometer.
The inner detector provides precision tracking of charged particles for pseudorapidities|η| < 2.5 and is surrounded by a superconducting solenoid providing a 2 T magnetic field. The inner detector consists of silicon pixel and microstrip detectors and a transition radiation tracker. One significant upgrade for the
√s =13 TeV run is the Insertable B-Layer [8], an additional pixel layer close to the interaction point. It provides high-resolution hits at small radius to improve tracking performance.
In the pseudorapidity region|η| < 3.2, high-granularity lead/liquid-argon (LAr) electromagnetic (EM) sampling calorimeters are used to measure EM showers from photons and electrons. An iron/scintillator tile calorimeter measures hadron energies for |η| < 1.7. The endcap and forward regions, spanning 1.5 < |η| <4.9, are also instrumented with LAr calorimeters for both EM and hadronic measurements.
The muon spectrometer consists of three large superconducting toroids with eight coils each, a system of trigger chambers, and precision tracking chambers, which provide triggering and tracking capabilities for muons in the ranges|η| <2.4 and|η| < 2.7, respectively.
1ATLAS uses a right-handed coordinate system with its origin at the nominal interaction point (IP) in the centre of the detector and thez-axis along the beam pipe. The x-axis points from the IP to the centre of the LHC ring, and the y-axis points upward. Cylindrical coordinates (r,φ) are used in the transverse plane,φbeing the azimuthal angle around the beam pipe.
The pseudorapidity is defined in terms of the polar angleθasη=−ln tan(θ/2).
A two-level trigger system is used to select events. The first-level trigger, implemented in hardware, is followed by the software-based high-level trigger system, which can run offline reconstruction and calibration software, reducing the event rate to less than 1 kHz.
This analysis uses LHCppcollision data at a centre-of-mass energy of 13 TeV collected with the ATLAS detector between September 2015 and July 2016. During this period, there were an average of 20 additional proton-proton collisions per bunch crossing. The dataset corresponds to an integrated luminosity of 12.6 fb−1.
3 Signal and background simulation
Events are generated at leading order (LO) in both QCD and QED with MadGraph5_aMC@NLO v2.3.3 [9] using the PDF4LHC_nlo_mc parton distribution function (PDF) [10] and massless bquarks in the 5-flavour PDF scheme. The difference in the cross-section between the full next-to-leading order (NLO) calculation [11–14] and the LO calculation with NLO PDFs is on the percent level. Higher-order (next-to-next-to-leading order) corrections are expected to be even smaller. Pythia 8.2 [15] is used for the parton shower, hadronization, and multiple partonic interactions, with the A14 parameter set [16] tuned to data. Multiple proton-proton collisions are simulated with the soft QCD processes of Pythia 8.186 [17]
using tune A2 [18] and the MSTW2008LO PDFs [19]. These events are overlaid on the hard-scatter interaction, according to the luminosity profile of the recorded data, to model contributions from both the same bunch crossing and neighbouring bunch crossings (“pileup”). The response of the ATLAS detector to these events is then calculated using full simulation software [20] based on Geant 4 [21].
Signal events are those with a final state containing twob-jets coming from the decay of a Higgs boson of mass 125 GeV, a photon, and two additional jets (VBF jets), and contain contributions from both vector- boson-fusion (VBF) and associated vector-boson (VH) production mechanisms. Contributions from other production mechanisms, e.g. gluon-gluon fusion and associatedt¯t production (both in association with a photon) were studied at particle level but found to be negligible in the phase space considered in this analysis. The H→bb¯ decay is modelled with Pythia 8.2.
The dominant source of background events is non-resonant QCD production of at least twob-jets, two other jets, and a photon. These events are modelled by requiring the same final state signature as the signal, but excluding diagrams containing on-shell Higgs orZbosons. A secondary source of background events is Z → bb¯ production in association with jets and a photon. Background events from this source are generated separately for strong and electroweak production mechanisms. Events produced via strong processes are generated at orderα2sα3
EW, while events produced via electroweak processes are generated at orderα5
EW. For these samples, theZ →bb¯decay is modelled with MadGraph.
4 Event selection
The final state of the signal consists of at least four high-pT jets and a high-pT photon. Among the jets there are twob-jets from the Higgs boson decay, and two high-energy forward jets characteristic of the VBF production process.
A dedicated trigger used to select data events requires an isolated electromagnetic object with high transverse energy pT > 22 GeV in the level-1 hardware-based trigger decision. The high-level trigger
requires a central photon candidate withpT > 25 GeV, four jets withpT >35 GeV, and a maximum dijet massmj j > 700 GeV.
Photon reconstruction [22] is seeded from clusters of energy deposits in the electromagnetic calorimeter.
The initial loose cut-based selection is based on shower shapes in the second layer of the electromagnetic calorimeter and on the energy deposits in the hadronic calorimeter. The tight identification adds inform- ation from the finely-segmented strip layer of the calorimeter, which provides good rejection of hadronic jets in which a neutral meson carries most of the jet energy. Both tight converted and unconverted photon candidates withpT >30 GeV are used in this analysis.
To further suppress hadronic background from jets and neutral pions, an isolation requirement is applied to the photon candidates. The calorimeter isolation variableEiso
T is estimated by summing the transverse energy of three-dimensional positive-energy topological clusters [23] reconstructed in the electromagnetic and hadronic calorimeters in a cone of∆R= 0.4 around the photon candidate, where the region within 0.125×0.175 inη×φaround the photon barycentre is excluded. The cut applied on the fully corrected isolation variable isEiso
T <2.45 GeV+0.022×Eγ
T, which guarantees a signal efficiency around 98% over theETrange expected for this signature.
Jets are reconstructed from topological calorimeter-cell clusters calibrated using the EM calorimeter scale. These clusters are then used as input to the anti-kt algorithm [24] with a radius parameter of R=0.4 to reconstruct jets. Jets originating from pileup collisions are suppressed with a likelihood-based discriminant, the Jet Vertex Tagger [25], which uses information about the primary vertex, jet pT, and trackpT for jets withpT < 50 GeV and |η| < 2.4. In simulated Z boson events, this tagger retains 97%
of jets withpT > 40 GeV originating from the primary vertex. Pileup subtraction algorithms and energy correction factors are applied to account for pileup contributions in the calorimeter response to jets [26].
After energy corrections and calibration [27], jets are required to have pT > 40 GeV and |η| < 4.5 to ensure high trigger efficiency. Because the invariant massmbb is an important discriminant against the non-resonant background, additional energy corrections are applied to jets with decays ofb-hadrons after the jet selection and generic energy calibration to account for semileptonic decays and for biases in the response due to resolution effects [28].
A flavour-tagging algorithm tags jets containing decays ofb-hadrons. The algorithm uses log-likelihood ratios from 3-D impact parameter significance distributions, secondary vertex information, and the jet pT andη. This information is used as input to a boosted decision tree (BDT) that calculates the final discriminant output [29, 30]. Jets are considered to be b-tagged if the BDT output exceeds a certain reference value, set in this search to correspond to an averageb-tagging efficiency of 77% and a light- flavour rejection of 130 in simulatedt¯tevents.
Double-counting of photons, leptons, and jets is avoided by applying an overlap removal algorithm based on the∆R=p
(∆φ)2+(∆η)2distance metric. Jets within∆R< 0.2 of the photon direction are removed, and photons with 0.2< ∆R<0.4 from the jet axis are removed. Photons within∆R<0.4 of an identified muon are removed, and electrons within ∆R < 0.4 of an identified photon are removed. Jets within
∆R<0.4 of an identified electron are removed from the event selection.
Candidate bbγ¯ j j events must contain at least four selected jets, at least two of which must be in the central detector (|η| <2.5) with inner detector coverage. The two central jets with the highestb-tagging discriminant outputs are identified as thebb¯ system, nominally from the Higgs boson decay. These two jets are tagged asb-jets if theirb-tagging discriminant outputs are greater than the BDT output reference value defined above. Thebb¯ system must havepT > 80 GeV, to reduce distortion of the low part of the invariant mass distribution due to the jetpTrequirement in the trigger. Among the remaining jets in the
event, the pair with the largest invariant mass is identified as the VBF jet pair. The invariant mass of the VBF pair must satisfymj j > 800 GeV, well above the invariant mass cut in the trigger. A total of 1028 events satisfy the requirements in the 2015 data, and 4562 satisfy the requirements in the 2016 data.
After the preselection requirements have been applied, a BDT discriminant output is formed from a set of variables chosen to maximize the separation between the signal and the non-resonant multijet background.
The BDT is implemented using the Toolkit for Multivariate Data Analysis (TMVA) package [31].
The simulated signal and the non-resonant multijet background samples are used to train the BDT. The input variables for the BDT training are chosen to have minimal correlation with thebb¯invariant mass.
• ∆R(jet, γ): angular separation between one of the selected jets and the photon, with thepT-ordered VBF jets labelledj1andj2, and thepT-orderedb-jets labelledb1andb2
• mj j: invariant mass of the VBF-jet pair
• ∆ηj j: separation inηbetween the VBF jets
• jet width for the VBF jets, sensitive to differences between quark and gluon jets [32]
• pbalance
T : transverse-momentum balancing variable for the selected final state objects:
pbalance
T = (pb1+pb2+pj1+pj2+pγ)T pb1
T +pb2
T +pj1
T +pj2
T +pγ
T
, (1)
wherepb1refers to the momentum 3-vector of the firstb-jet, etc., and the numerator is the transverse component of the 3-vector sum over the four jet momenta and the photon momentum. For events produced via electroweak processes, where there is minimal QCD radiation, the final state objects should be more balanced than in the non-resonant background, where wide-angle radiation is more likely and more final-state objects are expected.
• centrality of the photon with respect to the VBF jets:
centrality(γ) =
yγ− yj1+yj2
2
yj1−yj2
, (2)
where, for example,yj1is the rapidity of the first VBF jet.
• Hsoft
T : scalarpTsum over the track-jets withpT > 7 GeV. The track-jets used to calculateHsoft
T are clustered with the anti-kt (R=0.2) algorithm using tracks as input instead of calorimeter clusters.
The track-jets must not overlap with the selected photon nor the VBF jets (∆R> 0.4) and must not lie in the region between theb-jets, which is dominated by gluon radiation. The region between the b-jets is defined as an ellipse in the (η, φ) plane, centred on the midpoint between the twob-jets, with major axis of length∆R(bb)+0.8, oriented along the direction connecting the twob-jets, and with minor axis of length 0.8.
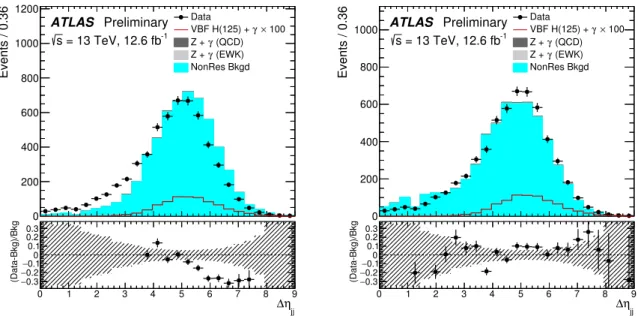
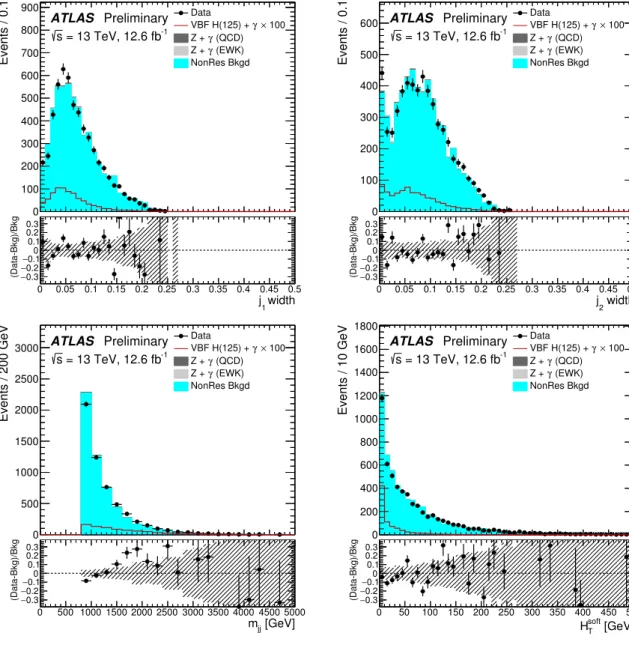
The agreement between data and simulation is good for all of the BDT input variables, except∆ηj j, which is shifted toward higher values in simulation. This distribution is therefore reweighted using a function derived from a fit to the ratio of the predicted non-resonant background to data in thembbsideband regions (mbb < 100 GeV andmbb > 150 GeV). Comparisons between data and simulation before and after the reweighting, are shown in Figure3. Distributions of the BDT input variables for signal and background simulation and data, after the reweighting in∆ηj jare shown in Figures4,5, and6, where the shaded band
in the lower panel of each plot is the relative statistical uncertainty of the total simulated background.
Because data are used for the final estimate of the non-resonant background, any residual mis-modelling in simulation affects only the performance of the BDT, but not the final results.
ηjj
∆
0 1 2 3 4 5 6 7 8 9
(Data-Bkg)/Bkg 0.3−
0.2
− 0.1
−0.20.30.10
Events / 0.36
0 200 400 600 800 1000 1200
ATLAS Preliminary = 13 TeV, 12.6 fb-1
s
Data
100
× γ VBF H(125) +
(QCD) γ Z +
(EWK) γ Z + NonRes Bkgd
ηjj
∆
0 1 2 3 4 5 6 7 8 9
(Data-Bkg)/Bkg 0.3−
0.2
− 0.1
−0.20.30.10
Events / 0.36
0 200 400 600 800
1000 ATLAS Preliminary = 13 TeV, 12.6 fb-1
s
Data
100
× γ VBF H(125) +
(QCD) γ Z +
(EWK) γ Z + NonRes Bkgd
Figure 3: Comparison of the ∆ηjj distributions in signal, background, and data before (left) and after (right) reweighting. The signal distributions are scaled by a factor of 100. The shaded band in the lower panel shows the statistical uncertainty on the simulated background. Points in the ratio outside the shown range are not displayed.
The BDT is trained with simulatedHγj j events as the signal sample and non-resonantbbγ¯ j jevents as the background sample. Distributions of the BDT output for the signal and background samples are shown in Figure7.
The signal extraction is performed by fitting the bb¯ invariant mass distribution in the selected event sample. The discrimination power of the BDT is exploited by performing the fit simultaneously in the three following regions of the BDT output: low (−1.0 < BDT < −0.1), medium (−0.1 < BDT < 0.1), and high (0.1 < BDT < 1.0). A total of 772 events populate the high-BDT region, 2009 the mid-BDT region, and 2809 the low-BDT region. In the high-BDT region, the Higgs boson andZ boson signals are expected to contribute 4.4 and 8.9 events, respectively.
5 Background estimates and signal extraction
The main sources of background contributing to the final state with four or more jets (two of which are tagged asb-jets) and a high-pTphoton are the following:
• Z+γ+jets, dominated by the resonantZ →bb¯ contribution,
• W+γ+jets, dominated by the resonantW →cscontribution,
• tt¯+γandt+γ, with non-resonant heavy-flavour jet pairs, and
• multijet production of non-resonant heavy-flavour jet pairs in association with a photon.
γ)
1,
∆R(b
0 1 2 3 4 5 6 7 8 9
(Data-Bkg)/Bkg 0.3−
0.2
− 0.1
−0.20.30.10
Events / 0.4
0 200 400 600 800 1000 1200
1400 ATLAS Preliminary = 13 TeV, 12.6 fb-1
s
Data
100
× γ VBF H(125) +
(QCD) γ Z +
(EWK) Z + γ NonRes Bkgd
γ)
2,
∆R(b
0 1 2 3 4 5 6 7 8 9
(Data-Bkg)/Bkg 0.3−
0.2
− 0.1
−0.20.30.10
Events / 0.4
0 200 400 600 800 1000
1200 ATLAS Preliminary = 13 TeV, 12.6 fb-1
s
Data
100
× γ VBF H(125) +
(QCD) γ Z +
(EWK) Z + γ NonRes Bkgd
γ)
1,
∆R(j
0 1 2 3 4 5 6 7 8 9
(Data-Bkg)/Bkg 0.3−0.2−0.1− 00.10.20.3
Events / 0.4
0 200 400 600 800 1000
ATLAS Preliminary = 13 TeV, 12.6 fb-1
s
Data
× 100 VBF H(125) + γ
(QCD) Z + γ
(EWK) Z + γ NonRes Bkgd
γ)
2,
∆R(j
0 1 2 3 4 5 6 7 8 9
(Data-Bkg)/Bkg 0.3−0.2−0.1− 00.10.20.3
Events / 0.4
0 100 200 300 400 500 600 700 800 900
ATLAS Preliminary = 13 TeV, 12.6 fb-1
s
Data
× 100 VBF H(125) + γ
(QCD) Z + γ
(EWK) Z + γ NonRes Bkgd
Figure 4: Distributions of the input variables for the BDT training, for signal, background, and data after∆ηj j reweighting. The∆R(jet, γ)variables represent the distances in (η, φ)between the jets and photon in the event.
The signal distributions are scaled by a factor of 100. The shaded band in the lower panel shows the statistical uncertainty on the simulated background. Points in the ratio outside the shown range are not displayed.
width j1 0 0.05 0.1 0.15 0.2 0.25 0.3 0.35 0.4 0.45 0.5 (Data-Bkg)/Bkg 0.3−
0.2
− 0.1
− 0 0.1 0.2 0.3
Events / 0.1
0 100 200 300 400 500 600 700 800 900
ATLAS Preliminary = 13 TeV, 12.6 fb-1
s
Data
100
× VBF H(125) + γ
(QCD) Z + γ
(EWK) Z + γ NonRes Bkgd
width j2 0 0.05 0.1 0.15 0.2 0.25 0.3 0.35 0.4 0.45 0.5 (Data-Bkg)/Bkg 0.3−
0.2
− 0.1
− 0 0.1 0.2 0.3
Events / 0.1
0 100 200 300 400 500
600 ATLAS Preliminary = 13 TeV, 12.6 fb-1
s
Data
100
× VBF H(125) + γ
(QCD) Z + γ
(EWK) Z + γ NonRes Bkgd
[GeV]
mjj 0 500 1000 1500 2000 2500 3000 3500 4000 4500 5000 (Data-Bkg)/Bkg 0.3−
0.2
− 0.1
− 0 0.1 0.20.3
Events / 200 GeV
0 500 1000 1500 2000 2500
3000 ATLAS Preliminary = 13 TeV, 12.6 fb-1
s
Data
100
× VBF H(125) + γ
(QCD) Z + γ
(EWK) Z + γ NonRes Bkgd
[GeV]
soft
HT
0 50 100 150 200 250 300 350 400 450 500 (Data-Bkg)/Bkg 0.3−
0.2
− 0.1
− 0 0.1 0.20.3
Events / 10 GeV
0 200 400 600 800 1000 1200 1400 1600 1800
ATLAS Preliminary = 13 TeV, 12.6 fb-1
s
Data
100
× VBF H(125) + γ
(QCD) Z + γ
(EWK) Z + γ NonRes Bkgd
Figure 5: Distributions of the input variables for the BDT training, for signal, background, and data after∆ηj j reweighting. The jets labelledj1andj2are the VBF jets. The signal distributions are scaled by a factor of 100. The shaded band in the lower panel shows the statistical uncertainty on the simulated background. Points in the ratio outside the shown range are not displayed.
balance
pT 0 0.1 0.2 0.3 0.4 0.5 0.6 0.7 0.8 0.9 1 (Data-Bkg)/Bkg 0.3−
0.2
− 0.1
− 0 0.1 0.20.3
Events / 0.04
0 200 400 600 800 1000 1200
1400 ATLAS Preliminary = 13 TeV, 12.6 fb-1
s
Data
100
× VBF H(125) + γ
(QCD) Z + γ
(EWK) Z + γ NonRes Bkgd
Centrality
0 0.5 1 1.5 2 2.5 3
(Data-Bkg)/Bkg 0.3−
0.2
− 0.1
− 0 0.1 0.20.3
Events / 0.067
0 200 400 600 800
1000 ATLAS Preliminary = 13 TeV, 12.6 fb-1
s
Data
100
× VBF H(125) + γ
(QCD) Z + γ
(EWK) Z + γ NonRes Bkgd
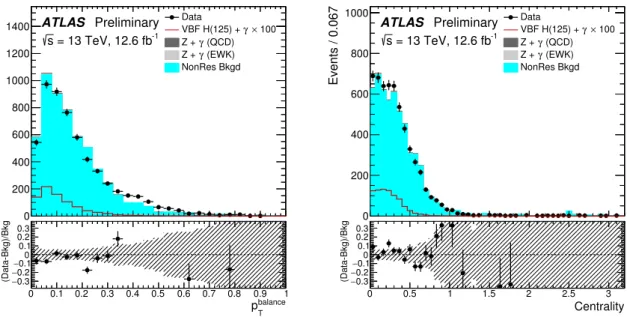
Figure 6: Distributions of the input variables for the BDT training, for signal, background, and data after∆ηj j reweighting. The shaded band in the lower panel shows the statistical uncertainty on the simulated background. The signal distributions are scaled by a factor of 100. Points in the ratio outside the shown range are not displayed.
BDT response 0.6
− −0.4 −0.2 0 0.2 0.4 0.6
Events
0 0.02 0.04 0.06 0.08 0.1
0.12 VBF H(125) + γ
NonRes Bkgd
ATLAS Simulation Preliminary = 13 TeV
s
Figure 7: Distribution of the BDT output response in simulated Hγj j signal events and non-resonant bbγj j background events. The distributions are normalized to unit area.
The extraction of the final Higgs boson signal strength µrelies on a fit to thembb dijet invariant mass spectrum in data. The non-resonant background contributions are fitted with a smoothly-falling polynomial function, and theZ+γ andH+γ signals are modelled with Crystal Ball functions. Polynomials of up to order 4 are tested for the background fit, and a signal injection test is performed to check the signal fraction bias for a particular fit. During the injection tests, the parameters of the Crystal Ball functions are fixed to parameters derived from simulation, but the normalization is allowed to float. During the final fits to data, the peak position and width are also allowed to float, to account for uncertainties in energy scale and resolution.
The statistical analysis of the data uses a binned likelihood function (Equation3) built as the product of Poisson probability terms across all analysis bins, with penalty terms for systematic uncertainties implemented as nuisance parameters (NPs, labelledθ). The NPs describe the systematic uncertainties discussed in Section6, and they are parameterized by log-normal priors fX. Each prior constrains an NP to its nominal value ¯θi,lwithin its associated uncertaintyσθi,l.
L(µ,θ)= YN
j=1
(µsj(θ)+bj(θ))nj nj!
e−(µsj(θ)+bj(θ))
Q
Y
i=1
fX(θi|θ¯i, σθi) (3)
The best fit value of the parameter of interest, denoted ˆµ, is obtained by maximimizing the likelihood function over all the NPs and µ. Each term is maximized when the expected number of signal and background events, µsj(θ) +bj(θ), is equal to the measured number of events in data, nj. Thus, in maximizing L, the fit adjusts the values of µ and θ to bring the measured and expected yields into agreement. The values ofθthat maximize the likelihood are denotedθˆ.
For the signal injection tests, 10,000 pseudo-experiments are generated from the simulated background mbbdistributions, including the non-resonant background and theZ+γprocess. The Higgs boson signal strengthµHandZboson signal strengthµZare varied from 0 to 5 in a series of pseudo-experiments, and the extractedµvalues are compared with the inputs. The tests confirm the linearity of the fitting procedure, with biases of less than 5% due to nonlinearity of the output. The signal injection tests show that the second-order polynomial fit gives the smallest bias in the high-BDT output region, so it is chosen as the baseline fit function. Differences in the fit result due to the choice of polynomial order are considered as systematic uncertainties on the final signal fraction [33]. The signal injection tests also show that the correlation between the fittedµH andµZ values fits is small, resulting in a bias of less than 5% in either case due to the remaining correlation.
The background polynomial fit is performed as an unbinned likelihood fit in thembb sideband regions (50 GeV<mbb < 80 GeV andmbb >140 GeV). The results of this non-resonant background fit are used to predict the background contribution in eachmbbbin, which is then used in the binned likelihood fit to extract the Higgs boson andZboson signal contributions.
6 Systematic uncertainties
The major systematic uncertainties for the background contributions and signal expectations are divided into experimental uncertainties and theory uncertainties. The uncertainties are propagated to the BDT input variables and then to the final likelihood fits. Each systematic uncertainty is associated with a nuisance parameter in the likelihood function. The impact of the uncertainty on the final signal strength
µis derived by varying the nuisance parameter value by ±1σ and evaluating the change in the signal strength.
The most prominent sources of jet-related uncertainty are the uncertainties from the jet energy scale (JES) and jet energy resolution (JER). They are estimated by smearing and scaling the energy of jets in simulated signal events according to known uncertainties [34]. No systematic uncertainties for theb-jet energy correction procedure are found to be necessary.
The modelling of jet width is studied for quark jets by selectingtt¯candidate events and using the two jets most likely to have originated from the decay of theW boson, based on the dijet invariant mass and b-tagging weight [35]. The jet width is studied as a function of jetpT, |η|, and the number of primary vertices in the event. In the forward region of the detector, there is at most a 10% difference in the mean of the jet width distribution between data and simulation. A systematic uncertainty has been assigned by varying the width of each jet by±10% and re-evaluating the BDT response. The modelling of jet width has also been checked in thembbsideband region of this analysis, which is expected to contain a mixture of quark and gluon jets. There is good agreement in the jet width distribution between data and simulation within the statistical uncertainties.
The modelling ofHsoft
T , particularly the dependence on the track-jet reconstruction, is checked by selecting Z+jets candidate events with two jets and a Z boson decaying to a pair of leptons. A VBF-like phase space for the Z +jets events is defined by requiring a large maximum invariant mass mj j for the jet pair. For each event, the Hsoft
T quantity is reconstructed with track-jets composed of tracks satisfying differentpT thresholds, and theHsoft
T distributions are compared in data and simulation. The modelling has been checked in different jet multiplicity events, with differentmj j thresholds, and with simulated events from different generators. There is good agreement in the Hsoft
T distribution between data and simulation. Experimental uncertainties have been assigned to Hsoft
T using uncertainties derived from the missing transverse momentum track soft terms [36]. These include the energy scale and resolution uncertainties.
The uncertainties on theb-tagging efficiencies have been derived from calibrations carried out in dedicated control samples [37, 38]. The resulting uncertainties are implemented as event-weight scale factors, constructed jet-by-jet but applied to the event as a whole.
The experimental uncertainties on the photon reconstruction efficiencies are derived from differences in Monte Carlo events before and after shower shape corrections have been applied. These include shifts in the reconstructed electromagnetic cluster energy due to the shower shape corrections. The energy scale and resolution uncertainties for the photons are determined from local corrections to the calorimeter energy measurement, intercalibration of calorimeter regions, and measurement of the absolute energy scale fromZ boson decays [39].
The trigger efficiency is studied in data and simulation by factorizing the trigger into the photon pT component, the jet pT component, and the dijet mass component. A closure test has been performed in simulation, verifying that the overall combined efficiency is in agreement with the product of the factorized efficiencies. A small non-closure term is found since a high-pT photon is likely to pass both photon selection criteria and jet selection criteria in the high-level trigger algorithm, creating a weak correlation between the photon pT trigger component and the jet pT component. After correcting for this effect, residual differences between data and simulation translate to a negligible uncertainty on the results.
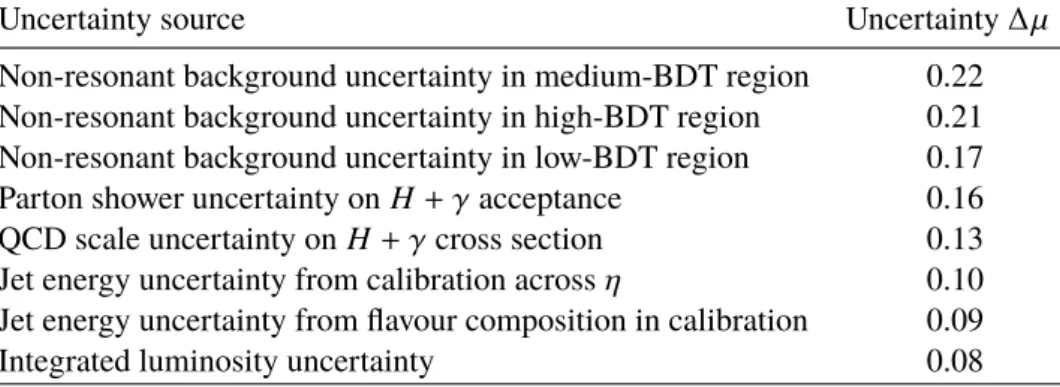
Uncertainty source Uncertainty∆µ Non-resonant background uncertainty in medium-BDT region 0.22 Non-resonant background uncertainty in high-BDT region 0.21 Non-resonant background uncertainty in low-BDT region 0.17 Parton shower uncertainty onH+γacceptance 0.16 QCD scale uncertainty onH+γcross section 0.13 Jet energy uncertainty from calibration acrossη 0.10 Jet energy uncertainty from flavour composition in calibration 0.09
Integrated luminosity uncertainty 0.08
Table 1: Summary of systematic uncertainties affecting the measurement of the Higgs boson signal strengthµ. Each absolute uncertainty is defined as the shift in the fittedµvalue when the corresponding nuisance parameter is varied by±1σ.
The uncertainty on the integrated luminosity of the collisions at
√s = 13 TeV has been measured to be 2.1% for data collected in 2015 and 4% for data collected in 2016. Pileup modelling uncertainties are estimated by reweighting simulated events so that the average number of interactions per crossing hµi varies by +7% and −16%. These variations have a negligible contribution to the total systematic uncertainty.
Theory uncertainties on the signal cross section and acceptance due to the choice of renormalization and factorization scale have been evaluated by varying the choice of scale for both parameters together by factors of 0.5 and 2.0 during the event generation. A particle-level analysis has been implemented on simulated events to evaluate the uncertainty on the acceptance due to the choice of scale. Events are selected using the same object and preselection cuts as the full analysis, and this procedure has been validated by verifying that changing a selection cut threshold has the same effect on the acceptance of both the particle-level and the full analysis. The nominal and scale-varied samples are passed through the particle-level analysis, and the acceptance is calculated as the fraction of events passing the selection cuts. Uncertainties due to the choice of PDF have been evaluated using a PDF reweighting scheme. In particular, the cross section and acceptance have been recalculated, relative to values for the nominal PDF, with a PDF reweighting procedure for the 100 error members of the PDF4LHC_nlo_mc PDF set. For both the cross section and the acceptance, the assigned uncertainty is the standard deviation of the set of relative values across all 100 error members of the PDF set.
The impact of theory uncertainties on the shape of each BDT input variable is assessed by calculating the ratio of particle-level distributions with and without the variations described above. The full simulation signal sample is then reweighted to study the impact of the uncertainty on the BDT inputs and output.
Among the BDT input variations, only the change in pbalance
T has a significant effect on the BDT output classification.
A summary of the systematic uncertainties and their absolute effects on the fitted signal strength parameter is shown in Table1. Only absolute uncertainties greater than 0.08 are included in the table.
7 Results
A test statistic based on the profile likelihood function in Equation3is used to quantify the compatibility of the dataset with the signal hypothesis of Higgs boson orZ boson production. Distributions of the test statistic under the signal and null hypotheses are estimated using asymptotic approximations [40]. In the absence of an observation in this dataset, a 95% CL upper limit is defined and presented using theC Ls technique [41].
Two different fit configurations are used to perform independent searches forH →bb¯+γandZ →bb¯+ γ production. WhenH+γ is the signal of interest, the electroweak Zγj j contribution, the strong Zγj j contribution, and the non-resonant bbγj j contribution are all treated as background. In the search for Z+γ, both the electroweak and strong production comprise the signal of interest, while theHγj jand non- resonant production are treated as background. In this case, the Higgs boson signal-strength parameter µis set to the SM prediction with a 50% uncertainty on the normalisation. The relative contributions of signal and background are controlled in the fit by the signal strength parameter, µ, which multiplies the signal sample yield in each analysis bin. The results for the signal significance and production cross section limit use bins defined in two dimensions:
• BDT discriminant output: three bins between−1.0 and 1.0 with boundaries at−0.1 and 0.1,
• mbb : bins 10 GeV wide in different ranges for each BDT region: 50 to 450 GeV (low), 50 to 350 GeV (medium), 50 to 250 GeV (high).
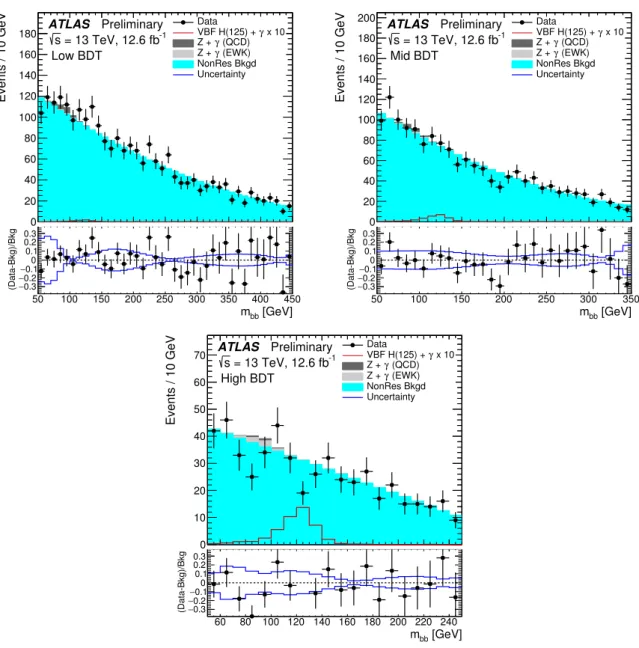
Invariant mass distributions from the three BDT bins are shown in Figure8.
Results from the likelihood fit to thembb distributions are shown in Table2. Fewer events than expected are observed near 125 GeV in the high-BDT signal region, while the numbers of events in the other BDT regions are consistent with expectations. This observation leads to a negative value of ˆµand an observed limit stronger than the expected limit. A similar effect is observed in the Z + γ fit. The results are consistent whether the fit is performed independently for theH+γandZ+γsignal strengths or the fit is performed for both signals simultaneously.
Result H(→bb)¯ +γj j Z(→bb)¯ +γj j
Expected significance 0.4 1.3
Expectedp-value 0.4 0.1
Observed p-value 0.9 0.4
Expected limit 6.0 +2−1..37 1.8 +0−0..75
Observed limit 4.0 2.0
Observed signal strength µ −3.9 +2−2..87 0.3 ±0.8
Table 2: Results from the statistical interpretation of search results, combining the three BDT bins.
[GeV]
mbb
50 100 150 200 250 300 350 400 450 (Data-Bkg)/Bkg 0.3−
0.2
− 0.1
− 0 0.1 0.20.3
Events / 10 GeV
0 20 40 60 80 100 120 140 160 180
ATLAS Preliminary = 13 TeV, 12.6 fb-1
s Low BDT
Data
x 10 VBF H(125) + γ
(QCD) Z + γ
(EWK) Z + γ NonRes Bkgd Uncertainty
[GeV]
mbb
50 100 150 200 250 300 350
(Data-Bkg)/Bkg 0.3−
0.2
− 0.1
− 0 0.1 0.20.3
Events / 10 GeV
0 20 40 60 80 100 120 140 160 180
200 ATLAS Preliminary = 13 TeV, 12.6 fb-1
s Mid BDT
Data
x 10 VBF H(125) + γ
(QCD) Z + γ
(EWK) Z + γ NonRes Bkgd Uncertainty
[GeV]
mbb
60 80 100 120 140 160 180 200 220 240 (Data-Bkg)/Bkg 0.3−
0.2
− 0.1
− 0 0.1 0.2 0.3
Events / 10 GeV
0 10 20 30 40 50 60
70 ATLAS Preliminary = 13 TeV, 12.6 fb-1
s High BDT
Data
x 10 VBF H(125) + γ
(QCD) Z + γ
(EWK) Z + γ NonRes Bkgd Uncertainty
Figure 8: Invariant mass distributions for each of the three BDT regions considered in the likelihood fit. Contributions are included from the Higgs boson signal,Z+γproduction through strong and electroweak processes, and non- resonantbb¯background. The Higgs boson signal distributions are scaled to signal strengthµ=10. The blue line in the lower panels shows the statistical and systematic uncertainties combined.
8 Conclusion
A search for vector boson fusion production of the Higgs boson in association with a high-pTphoton has been conducted with 12.6 fb−1of ppcollision data at
√s = 13 TeV collected with the ATLAS detector.
Background and potential signal contributions are fitted to thebb¯invariant mass spectrum in three different regions of BDT output. The observed and expected 95% CL upper limits on the Higgs boson production cross section times branching ratio are 4.0 and 6.0+2−1..37 times the Standard Model expectation. The measured signal strength ofH+γ production is µ= −3.9+2−2..87. The observed and expected upper limits onZ+γproduction in the same final state signature are 2.0 and 1.8+0−0..75times the Standard Model value, and the measured signal strength is 0.3±0.8 times the Standard Model value.
References
[1] T. Aaltonen et al.,Evidence for a particle produced in association with weak bosons and decaying to a bottom-antibottom quark pair in Higgs boson searches at the Tevatron,
Phys. Rev. Lett.109(2012) 071804, arXiv:1207.6436 [hep-ex]. [2] ATLAS and CMS Collaborations,
Measurements of the Higgs boson production and decay rates and constraints on its couplings from a combined ATLAS and CMS analysis of the LHCppcollision data at√
s=7 and 8 TeV, (2016), arXiv:1606.02266 [hep-ex].
[3] R. N. Cahn and S. Dawson,Production of Very Massive Higgs Bosons, Phys. Lett.B136(1984) 196, [Erratum: Phys. Lett. B138, 464 (1984)].
[4] CMS Collaboration,Search for the standard model Higgs boson produced through vector boson fusion and decaying tobb¯ with proton-proton collisions at√
s=13TeV, CMS-PAS-HIG-16-003, 2016, url:http://cds.cern.ch/record/2160154.
[5] ATLAS Collaboration,Search for the Standard Model Higgs boson produced by vector-boson fusion in 8 TeVppcollisions and decaying to bottom quarks with the ATLAS detector, (2016), arXiv:1606.02181 [hep-ex].
[6] E. Gabrielli et al.,
Higgs Boson Production in Association with a Photon in Vector Boson Fusion at the LHC, Nucl. Phys.B781(2007) 64, arXiv:hep-ph/0702119.
[7] ATLAS Collaboration,The ATLAS Experiment at the CERN Large Hadron Collider, JINST3(2008) S08003.
[8] ATLAS Collaboration,ATLAS Insertable B-Layer Technical Design Report, CERN-LHCC-2010-013, 2010, url:http://cds.cern.ch/record/1291633.
[9] J. Alwall et al.,The automated computation of tree-level and next-to-leading order differential cross sections, and their matching to parton shower simulations,JHEP07(2014) 079,
arXiv:1405.0301 [hep-ph].
[10] M. Botje et al.,The PDF4LHC Working Group Interim Recommendations, (2011), arXiv:1101.0538 [hep-ph].
[11] K. Arnold et al.,Next-to-leading order QCD corrections to Higgs boson production in association with a photon via weak-boson fusion at the LHC,JHEP08(2010) 088,
arXiv:1006.4237 [hep-ph].
[12] K. Arnold et al.,VBFNLO: A Parton level Monte Carlo for processes with electroweak bosons, Comput. Phys. Commun.180(2009) 1661, arXiv:0811.4559 [hep-ph].
[13] K. Arnold et al.,VBFNLO: A Parton Level Monte Carlo for Processes with Electroweak Bosons – Manual for Version 2.5.0, (2011), arXiv:1107.4038 [hep-ph].
[14] J. Baglio et al.,Release Note - VBFNLO 2.7.0, (2014), arXiv:1404.3940 [hep-ph].
[15] T. Sjöstrand et al.,An Introduction to PYTHIA 8.2,Comput. Phys. Commun.191(2015) 159, arXiv:1410.3012 [hep-ph].
[16] ATLAS Collaboration,ATLAS Pythia 8 tunes to7TeV data, ATL-PHYS-PUB-2014-021, 2014, url:http://cdsweb.cern.ch/record/1966419.
[17] T. Sjöstrand, S. Mrenna and P. Z. Skands,A Brief Introduction to PYTHIA 8.1, Comput. Phys. Commun.178(2008) 852, arXiv:0710.3820 [hep-ph].
[18] ATLAS Collaboration,Summary of ATLAS Pythia 8 tunes, ATL-PHYS-PUB-2012-003, 2012, url:http://cds.cern.ch/record/1474107.
[19] A. D. Martin et al.,Parton distributions for the LHC,Eur. Phys. J.C63(2009) 189, arXiv:0901.0002 [hep-ph].
[20] ATLAS Collaboration,The ATLAS Simulation Infrastructure,Eur. Phys. J. C70(2010) 823, arXiv:1005.4568 [hep-ex].
[21] S. Agostinelli et al.,GEANT4: A Simulation toolkit,Nucl. Instrum. Meth.A506(2003) 250.
[22] ATLAS Collaboration,Measurement of the photon identification efficiencies with the ATLAS detector using LHC Run-1 data, (2016), arXiv:1606.01813 [hep-ex].
[23] ATLAS Collaboration,
Topological cell clustering in the ATLAS calorimeters and its performance in LHC Run 1, (2016), arXiv:1603.02934 [hep-ex].
[24] M. Cacciari, G. P. Salam and G. Soyez,The anti-ktjet clustering algorithm,JHEP04(2008) 063, arXiv:0802.1189 [hep-ph].
[25] ATLAS Collaboration,Tagging and suppression of pileup jets with the ATLAS detector, ATLAS-CONF-2014-018, 2014, url:http://cdsweb.cern.ch/record/1700870. [26] ATLAS Collaboration,Pile-up subtraction and suppression for jets in ATLAS,
ATLAS-CONF-2013-083, 2013, url:http://cdsweb.cern.ch/record/1570994.
[27] ATLAS Collaboration,Jet Calibration and Systematic Uncertainties for Jets Reconstructed in the ATLAS Detector at√
s=13TeV, ATL-PHYS-PUB-2015-015, 2015, url:https://cds.cern.ch/record/2037613.
[28] ATLAS Collaboration,Search for a CP-odd Higgs boson decaying to Zh in pp collisions at
√s =13TeV with the ATLAS detector, ATLAS-CONF-2016-015, 2016, url:http://cds.cern.ch/record/2141003.
[29] ATLAS Collaboration,Performance ofb-Jet Identification in the ATLAS Experiment, JINST11(2016) P04008, arXiv:1512.01094 [hep-ex].
[30] ATLAS Collaboration,Optimisation of the ATLASb-tagging performance for the 2016 LHC Run, ATL-PHYS-PUB-2016-012, 2016, url:http://cds.cern.ch/record/2160731.
[31] A. Hoecker et al.,TMVA - Toolkit for Multivariate Data Analysis, PoSACAT(2007) 040, arXiv:physics/0703039.
[32] ATLAS Collaboration,
ATLAS measurements of the properties of jets for boosted particle searches, Phys. Rev. D86(2012) 072006, arXiv:1206.5369 [hep-ex].
[33] ATLAS Collaboration,Search for the Standard Model Higgs boson produced by vector-boson fusion in 8 TeVppcollisions and decaying to bottom quarks with the ATLAS detector, (2016), arXiv:1606.02181 [hep-ex].
[34] ATLAS Collaboration,Jet energy measurement and its systematic uncertainty in proton–proton collisions at√
s=7TeV with the ATLAS detector,Eur. Phys. J. C75(2015) 17, arXiv:1406.0076 [hep-ex].
[35] ATLAS Collaboration,Measurements of thet¯tproduction cross-section in the dilepton and lepton-plus-jets channels and of the ratio of thet¯tandZ boson cross-sections in pp collisions at
√s =13TeV with the ATLAS detector, ATLAS-CONF-2015-049, 2015, url:http://cdsweb.cern.ch/record/2052605.
[36] ATLAS Collaboration,Expected performance of missing transverse momentum reconstruction for the ATLAS detector at√
s=13TeV, (2015), url:http://cds.cern.ch/record/2037700. [37] ATLAS Collaboration,Calibration ofb-tagging using dileptonic top pair events in a
combinatorial likelihood approach with the ATLAS experiment, ATLAS-CONF-2014-004, 2014, url:http://cdsweb.cern.ch/record/1664335.
[38] ATLAS Collaboration,
Calibration of the performance ofb-tagging forcand light-flavour jets in the 2012 ATLAS data, ATLAS-CONF-2014-046, 2014, url:http://cdsweb.cern.ch/record/1741020.
[39] ATLAS Collaboration,
Electron and photon energy calibration with the ATLAS detector using LHC Run 1 data, Eur. Phys. J. C74(2014) 3071, arXiv:1407.5063 [hep-ex].
[40] G. Cowan et al.,Asymptotic formulae for likelihood-based tests of new physics, Eur. Phys. J.C71(2011) 1554, [Erratum: Eur. Phys. J.C73,2501(2013)], arXiv:1007.1727 [physics.data-an].
[41] A. L. Read,Presentation of search results: TheC Lstechnique,J. Phys.G28(2002) 2693.