ATLAS-CONF-2013-012 06March2013
ATLAS NOTE
ATLAS-CONF-2013-012
March 5, 2013
Measurements of the properties of the Higgs-like boson in the two photon decay channel with the ATLAS detector using 25 fb
−1of proton-proton
collision data
The ATLAS Collaboration
Abstract
Measurements of the mass and couplings of the Higgs-like boson in the two photon de- cay channel with the ATLAS detector at the LHC are presented. The proton-proton collision datasets used correspond to integrated luminosities of 4.8 fb
−1collected at √ s = 7 TeV and 20.7 fb
−1collected at √
s = 8 TeV. The updated measurements benefit from an increased data sample and an improved analysis. The measured value of the mass of the Higgs-like boson is 126.8 ± 0.2(stat) ± 0.7(syst) GeV and the fitted number of signal events is found to be 1.65 ± 0.24(stat)
+0.25−0.18(syst) times the value predicted by the Standard Model. Measurements of the signal strengths in different production processes and a fiducial cross section for the observed particle are also presented.
c Copyright 2013 CERN for the benefit of the ATLAS Collaboration.
Reproduction of this article or parts of it is allowed as specified in the CC-BY-3.0 license.
1 Introduction
According to the Standard Model (SM) of particle physics, elementary particles acquire their mass through a mechanism that spontaneously breaks the electroweak symmetry. A consequence of this model is the existence of a scalar particle, the SM Higgs boson [1–3]. In July 2012, the ATLAS and CMS col- laborations independently reported observations of a new particle that seems compatible with the SM Higgs boson, using pp collisions from the 2011 and 2012 datasets collected at the LHC until the end of June 2012 [4, 5]. More detailed and precise measurements of the properties of this new boson are essential to further elucidate its role in electroweak symmetry breaking and mass generation.
The results of the previous ATLAS Higgs boson searches and property measurements in the diphoton decay channel were obtained with a combination of 4.8 fb
−1of data recorded at √
s = 7 TeV and 13.0 fb
−1of data recorded at √
s = 8 TeV [6]. They established the observation of the new boson in the diphoton channel alone.
The results reported here are obtained from the whole data sample collected in 2012 at √
s = 8 TeV, enlarged to a total of 20.7 fb
−1by including data recorded between October and December 2012. The analysis strategy has been improved to be more sensitive to different signal production processes allowing a more precise measurement of their strengths. The mass measurement is also updated with the full 2012 dataset and a first measurement of the fiducial cross section of the new particle is presented. The 8 TeV analysis is combined with the previous 7 TeV analysis, which is unchanged with respect to Ref. [6].
This note is organised as follows: the ATLAS detector is briefly described in Section 2, followed by the event selection, object selection and event categorisation in Sections 3 and 4. The signal and background modelling are presented in Section 5. Systematic uncertainties are summarised in Section 6.
The statistical procedures and the results of the combination of the √
s = 7 TeV and √
s = 8 TeV data are discussed in Section 7. The conclusions of this study are reported in Section 8.
2 The ATLAS detector
The ATLAS detector [7] is a multipurpose apparatus with a forward-backward symmetric cylindrical geometry with close to 4π coverage in solid angle
1.
The inner tracking detector (ID), covering a pseudo-rapidity range of | η | < 2.5, consists of a silicon pixel detector, a silicon microstrip detector and a transition radiation tracker in the range | η | < 2.0. The ID is surrounded by a superconducting solenoid providing a 2 T magnetic field. The inner detector allows an accurate reconstruction of the primary proton-proton collision region, as well as tracks from secondary vertices, thus permitting an efficient reconstruction of tracks from photons converting into an electron-positron pair in the inner detector material up to a radius of ∼ 800 mm.
The electromagnetic (EM) calorimeter (ECAL) provides a measurement of the kinematics of EM objects. It is a lead/liquid-argon (LAr) sampling calorimeter with an accordion geometry. The ECAL is divided into a barrel section, covering the pseudorapidity region | η | < 1.475, and two end-cap sections, covering the pseudorapidity regions 1.375 < | η | < 3.2. It consists of three longitudinal layers up to
| η | = 2.5 and two layers in the rest of the coverage. The first one is segmented, in the ranges | η | < 1.4 and 1.5 < | η | < 2.4, into high granularity ”strips” in the η direction, sufficient to provide an event-by-event discrimination between single photon showers and two overlapping showers generated by the decay of a π
0meson. The second layer collects most of the energy deposited by a photon shower. A third layer is
1ATLAS uses a right-handed coordinate system with its origin at the nominal interaction point (IP) in the centre of the detector, and thez-axis along the beam line. Thex-axis points from the IP to the centre of the LHC ring, and they-axis points upwards. Cylindrical coordinates (r, ϕ) are used in the transverse plane,ϕbeing the azimuthal angle around the beam line.
Observables labelled “transverse” are projected into thex−yplane. The pseudorapidity is defined in terms of the polar angle θasη=−ln tan(θ/2). The transverse momentum is defined aspT = psinθ= p/coshη, and the transverse energyET has a similar definition.
used to correct leakage beyond the ECAL for high energy showers. In front of the accordion calorimeter a thin presampler layer, covering the pseudorapidity interval | η | < 1.8, is used to correct for energy losses before the calorimeter.
The hadronic calorimeter (HCAL), surrounding the ECAL, consists of steel and scintillating tiles in the range | η | < 1.7, and two copper/LAr detectors spanning 1.5 < | η | < 3.2. The acceptance is extended by two copper-tungsten/LAr forward calorimeters up to | η | < 4.9.
The muon spectrometer, located beyond the calorimeters, consists of three large air-core supercon- ducting toroid systems, precision tracking chambers providing accurate muon tracking over | η | < 2.7, and fast detectors for triggering over | η | < 2.4.
A three-level trigger system is used to select events containing two photon candidates. The first level trigger is hardware based and exploits a coarse cell granularity (0.1 × 0.1 in η × ϕ) to search for electromagnetic deposits with transverse energies above a programmable threshold. The second and third level triggers are implemented in software and exploit the full granularity and energy calibration of the calorimeter.
3 Event selection
The data sample was recorded with a diphoton trigger with 35 GeV and 25 GeV transverse energy (E
T) thresholds for the leading (highest E
T) and sub-leading photons, respectively. The trigger uses clusters of energy in the EM calorimeter. At the final trigger level these EM clusters are required to match loose criteria according to expectations for EM showers initiated by photons. This trigger has a signal efficiency above 99% for events fulfilling the final event selection. After application of data quality requirements, the 8 TeV data sample corresponds to a total integrated luminosity of 20.7 ± 0.7 fb
−1.
In the offline event selection at least two photons satisfying tight identification criteria based on the shapes of the EM showers [8] are required. The transverse energies for the leading and sub-leading photons are required to be larger than 40 GeV and 30 GeV, respectively, and both need to be within the fiducial calorimeter region of | η | < 2.37 (excluding the transition region between the barrel and the end- cap calorimeters, 1.37 < | η | < 1.56). The photon identification efficiency for the tight criteria is typically 85% at low E
Tand reaches a plateau of 95% around E
T= 100 GeV.
Both photons are also required to be isolated through the use of criteria based on both the inner tracker and the calorimeter. The first is the scalar sum of the transverse momenta of all tracks with
p
T> 1 GeV in a cone of size ∆R = q
(∆η)
2+ (∆ϕ)
2= 0.2 around each photon, and is required to be less than 2.6 GeV. Only tracks consistent with originating from the diphoton production vertex (its selection is outlined below) are used, and tracks associated to converted photon candidates are excluded.
The second variable is the transverse energy sum of positive-energy topological clusters [9] deposited in the calorimeter around each photon in a cone of ∆R = 0.4, and is required to be less than 6 GeV.
The energy sum excludes deposits in in the core region of the photon shower, and corrections for the small estimated energy leakage outside this region are applied. The effects of the underlying event and of additional minimum bias interactions (pile-up) occurring in the same or neighbouring bunch crossings are corrected on an event-by-event basis [10, 11].
For the precise measurement of the diphoton invariant mass (m
γγ), as well as for the computation of
track-based quantities (e.g. track isolation, selection of jets associated to the hard interaction), the precise
location of the diphoton production vertex is necessary. The determination of this vertex is based on the
so-called ‘photon pointing’, where the vertex position along the beam axis is obtained by combining the
trajectories of each photon, measured using the longitudinal segmentation of the calorimeter, with a con-
straint from the average beam spot position. For converted photons, the position of the conversion vertex
is also used if tracks from the conversion have hits in the silicon detectors. The diphoton production
vertex is selected among all the reconstructed primary vertices using a Neural Network algorithm which
combines the photon pointing with, for each reconstructed vertex: the conversion information, the sum of the squared momentum P p
2Tand the scalar sum of the momentum P p
Tof the tracks associated with each reconstructed vertex, and the difference in azimuthal angle ∆ϕ between the direction defined by the vector sum of the tracks momenta and that of the diphoton system. The vertex selection was studied with Z → ee events in data and Monte Carlo (MC) simulation by removing the electron tracks from the events and verifying the efficiency of finding the vertex associated to them. Corrections were applied in order to mimic the Higgs boson signal, by matching the dielectron and diphoton p
Tspectra in the MC and the fraction of events with zero, one or two EM objects in the barrel region of the calorimeter. The efficiency of finding the primary vertex within 0.3 mm of the true one is higher than 75%.
The photon energy calibration is obtained from a detailed simulation of the detector geometry and response independently for converted and unconverted photons. For the purpose of calibration, converted photons are defined as those with a conversion vertex reconstructed in the inner detector at a radius of less than 800 mm, and tracks matched to the calorimeter cluster. The calibration is refined by applying η-dependent correction factors determined in situ. These go from ± 0.5% to ± 1.5% depending on the pseudorapidity of the photon and are obtained from studies of Z → ee decays in data [12]. The energy response of the calorimeter shows a stability within 0.1% with time and with different pile-up conditions, the mean number of interactions per bunch crossing for 2012 being around 20, and spanning up to 40.
A total of 118893 (23788) collisions events at 8 TeV (7 TeV) were selected with a diphoton invariant mass between 100 GeV and 160 GeV. Using methods based on photon identification quality and iso- lation [13], the fraction of genuine diphoton events is found to be (75
+3−4)% [6]. The rest of the events contain one or more jets misidentified as photons, except for a small contribution from the Drell-Yan process where both electrons pass the photon selection. Conversion candidates with tracks crossing in- active regions of the innermost pixel layer are rejected to reduce the contamination from misidentified electrons. The study of the sample composition demonstrates the high purity of the diphoton selection, although the Higgs boson analysis and properties measurements do not rely on the determination of the background composition.
4 Event categorisation
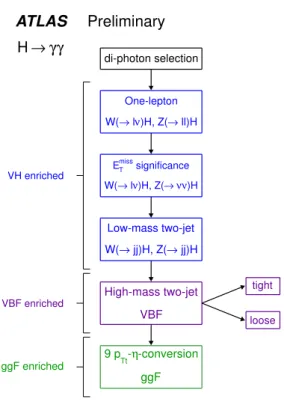
The selected events are divided into 14 exclusive categories based on event properties. The categories differ in signal-to-background ratio as well as invariant mass resolution and thus increase the sensitiv- ity of the measurement. Gluon fusion (ggF) is the dominant production mode of Higgs bosons at the LHC, contributing 87% of the total production cross section at m
H= 126.5 GeV, while vector boson fusion (VBF) and associated production with vector bosons (VH) contribute only 7% and 5% respec- tively. Several categories are designed to increase the sensitivity to the VBF and VH processes. An order of preference is applied when sorting events into categories (Figure 1). Compared to the previous analysis [6], new categories enriched in associated production with vector bosons have been introduced and a multivariate analysis is performed to improve the sensitivity to the VBF production mode. The selection of the different objects needed to define the categories are described in this section, followed by the description of the categories.
4.1 Object selection 4.1.1 Leptons
Electron candidates are reconstructed from clusters of energy deposits in the electromagnetic calorimeter associated with a track reconstructed in the inner detector. A transverse energy greater than 15 GeV and
| η | < 2.47 are required. Identification criteria based on electromagnetic shower shapes and track quality
are applied [12]; shower shapes criteria are similar to but somewhat looser than those for photons.
di-photon selection
One-lepton ll)H
→ )H, Z(
ν
→ l W(
significance
miss
ET
ν)H ν
→ )H, Z(
ν
→ l W(
Low-mass two-jet jj)H
→ jj)H, Z(
→ W(
High-mass two-jet VBF
tight
loose
-conversion -η
9 pTt
ggF ggF enriched
VBF enriched VH enriched
ATLAS Preliminary γ
γ
→ H
Figure 1: Flow-chart of the event categorisation, giving the order of selection of the different categories.
Muon candidates are reconstructed from tracks in the inner detector and the muon spectrometer, and in the forward region (2.5 < | η | < 2.7) from the muon spectrometer alone. A transverse momentum larger than 10 GeV is required.
Both electron and muon candidates are required to be isolated in the tracker and calorimeter with algorithms similar to the photon isolation requirements. The track-isolation divided by the total muon p
T(electron E
T) is required to be less than 0.15 and the calorimetric isolation divided by the total muon p
T(electron E
T) is required to be less than 0.2.
4.1.2 Jets
Jets are reconstructed from three-dimensional clusters of energy in the electromagnetic and hadronic calorimeters using the anti-k
talgorithm [14] with a distance parameter of R = 0.4. Jet candidates are required to have a transverse energy greater than 25 GeV (30 GeV) for | η
jet| < 2.4 (2.4 ≤ | η
jet| < 4.5).
The energy dependence on the additional interactions in the same bunch crossing (in-time pile-up), as well as from multiple interactions in surrounding bunch crossings (out-of-time pile-up), is mitigated by applying a data-driven correction based on the event p
Tdensity in the jet area [11]. Corrections from in-situ measurements are then applied to refine the jet calibration [15]. To remove jets originating from pile-up interactions, jets with | η
jet| ≤ 2.4 and p
T< 50 GeV
2must fulfil the requirement, based on tracking information, that they originate from the diphoton production vertex. A jet vertex fraction (JVF) is calculated for each primary vertex using tracks associated to the jet and is defined as the ratio of the p
Tsum of the jet tracks associated to the selected vertex and the p
Tsum of all jet tracks. The JVF for the primary vertex selected in the analysis is required to be greater than 0.25. The efficiency of selecting the
2Jets withpT>50 GeV have a small probability to be produced by pile-up interactions.
correct jets from VBF H → γγ events is larger than 95% with this cut. The two highest p
Tjets passing all the jet selection cuts are used for the categorisation.
To prevent potential double-counting, the reconstructed objects are required to have a minimal spatial separation. The two leading photons are always kept. Electrons overlapping with one of those photons within a cone of ∆R(e, γ) = p
∆η
2+ ∆ϕ
2< 0.4, jets within ∆R(jet, e) < 0.2 or ∆R(jet, γ) < 0.4, and muons within a cone of ∆R(µ, jet) < 0.4 or ∆R(µ, γ) < 0.4 are removed.
4.1.3 Missing transverse energy
The measurement of the missing transverse energy, E
missT, is based on the transverse energy of all photon, electron and muon candidates, all jets after overlap removal, and all calorimeter energy clusters not as- sociated to such objects. The objects entering the E
Tmissdefinition are selected with the criteria described above.
The E
missTsignificance is defined as E
Tmiss/σ
EmissT
where σ
EmissT
= 0.67 [ GeV
1/2] √
ΣE
T, ΣE
Tbeing the scalar sum of the transverse energy of all objects [16]. Using a E
missTsignificance requirement instead of a direct E
missTrequirement allows the rejection of multijet events where the E
missTarises from energy resolution effects, while still retaining high efficiency for signal events with E
missTcoming from particles which do not interact with the detector.
4.2 Categories sensitive to the associated production with a vector boson
In the first step of the categorisation, events with with features expected from the associated production of the Higgs particle with a vector boson are selected. Categories are described in the order they are selected.
4.2.1 One-lepton category
Events where the vector boson decays leptonically are sought by identifying either an electron or a muon candidate. In order to remove the background coming from the Z( → ee)γ process, events having 84 < m
eγ< 94 GeV, where m
eγis the diphoton mass of the reconstructed electron and one of the two photons, are vetoed. If one of the selected photons also passes the electron identification requirements, the event is rejected to reduce the background from electroweak processes, particularly from W( → eν)γ where the electron is misidentified as a photon.
4.2.2 E
Tmisssignificance category
In order to select Z bosons decaying into two neutrinos or W bosons decaying leptonically but with a lepton which was not reconstructed, events with a E
missTsignificance larger than 5 are selected, which corresponds to E
missT> 70 − 100 GeV depending on ΣE
T. Events with at least one photon passing electron identification requirements are also rejected from this category to reduce the electroweak background.
4.2.3 Low mass two-jet category
Events with a signature of hadronically decaying vector bosons are found by requiring the presence
of two reconstructed jets with a dijet invariant mass in the range of 60-110 GeV and a pseudorapidity
separation between the two jets of less than 3.5 units. The difference between the pseudorapidities of
the diphoton and the dijet systems is required to be lower than 1. In addition, the diphoton transverse
momentum orthogonal to the diphoton thrust axis in the transverse plane
3( p
Tt) [17, 18] is required to be larger than 70 GeV.
4.3 Categories sensitive to the vector boson fusion process
Vector-boson fusion events are characterised by two forward jets with little hadronic activity between the two jets. A multivariate analysis is performed to improve the sensitivity to this process. It exploits the full event topology and the correlations of jets and photons kinematic quantities to maximize the discrimination of the VBF signal from the relevant backgrounds, which include: non-resonant processes such as γγ pairs produced in association with at least two jets, direct single γ events with at least three jets (with one jet faking a photon) and multi-jet events where two jets are misidentified as photons, as well as resonant backgrounds such as Higgs bosons production via gluon fusion and in association with at least two jets. Eight discriminating variables are used to build a boosted decision tree (BDT) [19]:
the invariant mass of the two leading jets m
j j, their pseudorapidity η
j1and η
j2, their pseudorapidity separation ∆η
j j, p
Ttof the diphoton system, the azimuthal angle difference between the diphoton and the dijet systems ∆φ
γγ;j j, the diphoton system pseudorapidity in the frame of the tagging jet pseudorapidity, defined as η
∗= η
γγ−
ηj1+η2 j2[20], and the minimal ∆R between one of the photons and one of the two leading jets ∆R
γminj.
For the BDT training, a Monte Carlo sample generated with S is used to emulate the diphoton component of the background while data events in which one of the photon candidates fails the isolation criteria are used to emulate the photon-jet and two-jet components of the background. Each component is weighted according to the background composition measured in data. The BDT responses to the data excluding the signal region (sidebands) and to the expected background are shown in Figure 2(a).
Two categories are defined according to the BDT output value, leading to tight (BDT ≥ 0.74) and loose (0.44 < BDT < 0.74) “high-mass two-jet” categories. They are determined by maximizing the VBF signal significance against ggF and non-resonant backgrounds using a statistically independent subset of the training sample. Figure 2(b) shows the BDT response for the non-resonant background, and the ggF and VBF samples. A clear separation between the VBF signal and the other processes can be seen.
Although to derive the final results the background is not obtained from the MC simulation, the dis- tributions of the BDT input variables in the data sidebands and in the training sample were compared before and after the cuts on the BDT output value. They were found to be in reasonable agreement. To further check the performance of the BDT, the output for a high statistics, high purity, Z → ee + jet sample was compared between data and MC. A good agreement was observed over the full range of the BDT output. The diphoton MC sample at the generator level was used to verify that the shape of the diphoton invariant mass spectrum is not affected by the cuts on the BDT discriminant.
4.4 Other categories
The remaining events are classified by whether both photon candidates are unconverted photons (“un- converted”) or at least one photon candidate is a converted photon (“converted”), whether both photon candidates are within | η | < 0.75 (“central”) or at least one photon candidate is outside of this region (“rest”), and whether the p
Ttof the diphoton system is greater (“high-p
Tt”) or smaller (“low-p
Tt”) than 60 GeV. For events with at least one converted photon candidate, a separate “converted transition” cat- egory is defined, where at least one photon candidate has 1.3 < | η | < 1.75. The energy resolution
3pTt=|~pγγT ×bt|, wherebt= ~p
γ1 T−~pγT2
|~pγT1−~pγT2|denotes the transverse thrust,~pγT1and~pγT2are the transverse momenta of the two photons, and~pγγT =~pγT1+~pγT2is the transverse momentum of the diphoton system.
Events (normalized to unity) 0 0.05 0.1 0.15 0.2
0.25 Data 2012 (sidebands)
γ γ
+ jj γ j + j γ
ATLAS Preliminary Ldt = 20.7 fb-1
∫
= 8 TeV, s γ
γ
→ H
BDT Response -1 -0.8 -0.6 -0.4 -0.2 0 0.2 0.4 0.6 0.8 1
Data/Bkg 0.81
1.2
(a)
BDT Response -1 -0.8 -0.6 -0.4 -0.2 0 0.2 0.4 0.6 0.8 1
Events (normalized to unity)
0 0.05 0.1 0.15 0.2
0.25 =125 GeV)
VBF (mH
=125 GeV) ggF (mH
+ jj γ j + j γ γ + γ
ATLAS Preliminary Ldt = 20.7 fb-1
∫
= 8 TeV, s
γ γ
→ H
(b)
Figure 2: (a) The response of the VBF BDT to the data in the signal sidebands (excluding the m
γγ∈ [120- 130] GeV region) and to the expected background after selection cuts, normalized to unity. (b) The response of the VBF BDT to the VBF signal sample, to the ggF signal sample, and to the expected background after selection cuts, normalized to unity.
is degraded in this region because of the large amount of material in front of the calorimeter. No p
Ttclassification is applied to this last category.
5 Signal and background modelling
5.1 Signal modelling
The Higgs boson signal produced through the gluon fusion and vector boson fusion processes is sim- ulated with the P [21, 22] generator interfaced to P [23] for showering and hadronisation.
Higgs boson production in association with a vector boson or a top quark pair (ttH) is simulated with P . The Higgs boson production cross sections are computed up to next-to-next-to-leading order (NNLO) [24–29] in QCD for the gluon fusion process. Soft-gluon resummation up to next-to-next- to-leading logarithm order [30] is adopted. The finite quark-mass effects are taken into account in P [31]. Next-to-leading order (NLO) EW corrections are applied [32, 33]. These results are com- piled in [34–36] assuming factorization between QCD and EW corrections. The cross sections for the VBF process are calculated with full NLO QCD and EW corrections [37–39], and approximate NNLO QCD corrections [40]. The W /ZH processes are calculated at NLO [41] and NNLO [42], and NLO EW radiative corrections [43] are applied. The full NLO QCD corrections for ttH are used [44–47].
The yields for gluon fusion are, in the following, corrected for destructive interference with the gg → γγ process [48]. These corrections range between − 2% and − 5%, depending on the diphoton invariant mass.
The theoretical uncertainty on the Higgs boson production cross section mainly comes from renor- malisation and factorisation scale variations and parton distribution functions (PDF) [49–52]. The Higgs boson decay branching fractions are taken from Refs. [53–56] and their uncertainties are compiled in Refs. [57, 58].
Signal MC samples are generated in steps of 5 GeV for hypothesised Higgs boson masses in the
range 100-150 GeV and passed through a full ATLAS detector simulation [59] based on the GEANT4
program [60]. Pile-up effects are simulated by overlaying each MC event with a number of additional
simulated inelastic pp collisions. The number of extra interactions is adjusted according to the measured
multiplicity in each data-taking period. In the simulation, the photon energy resolution is broadened (by approximately 1% in the barrel calorimeter and 1.5-2.5% in the end-cap regions) to account for differences in energy resolution observed between Z → ee data and MC events. In the pseudorapidity region 0.8 − 1.37, the energy resolution broadening applied for the 2012 analysis is larger due to aditionnal differences between data and simulation for the Z → ee invariant mass distribution. This broadens the predicted diphoton mass resolution, which is based on the resolution extracted from Z → ee events, and increases its uncertainty.
A Crystal Ball [61] plus a Gaussian function is used to describe the diphoton invariant mass distri- bution from the signal MC samples. The parameters of this function, as well as the signal yield, are parameterised as a function of hypothesised Higgs boson mass, and a simultaneous fit to signal MC sam- ples at different masses is performed to interpolate the signal shape and yield to the intermediate mass values where MC samples are not available. Small effects of signal-background interference on the mass position, as discussed in Ref. [62], have not been taken into account.
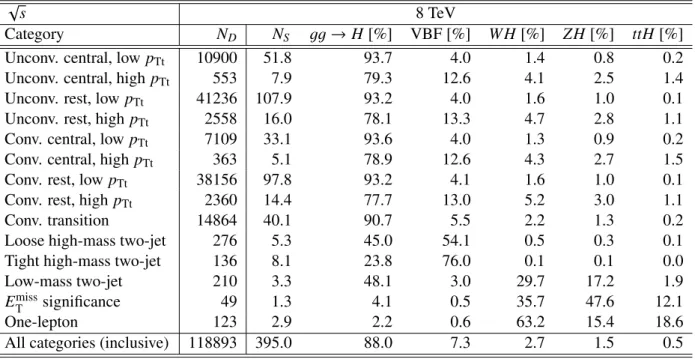
Table 1 summarises the number of events observed in the data and the expected number of signal events for each of the 14 categories. The breakdown of expected signal events from the different produc- tion processes is also detailed. The total efficiency for the signal selection is expected to be 37.5% for a Higgs boson with m
H= 125 GeV.
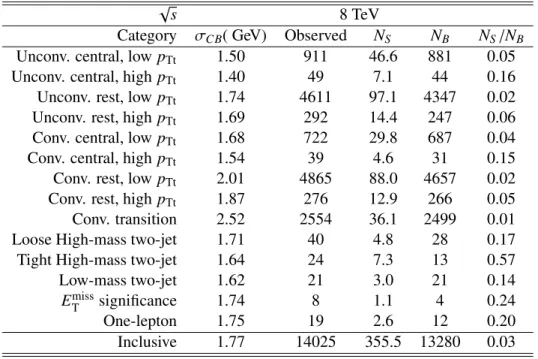
Table 2 gives the mass resolution and signal over background ratio in a mass window around m
H= 126.5 GeV containing 90% of the expected signal events for the 14 categories of the 8 TeV data analysis.
The resolution of the reconstructed diphoton mass (σ
CB) is dominated by the photon energy resolution.
It is 1.77 GeV for the inclusive analysis, with values varying from 1.40 GeV for the unconverted central high p
Ttto 2.52 GeV for the converted transition categories defined in Section 4.
Table 1: Number of events in the data (N
D) and expected number of SM Higgs signal events (N
S) for m
H= 126.5 GeV from the H → γγ analysis, for each category in the mass range 100-160 GeV at
√ s = 8 TeV. Numbers for the 7 TeV analysis can be found in Ref. [4]. The statistical uncertainties in N
Sare less than 1%. The fractions of expected signal events from the gg → H, VBF, WH, ZH, ttH processes are detailed.
√ s 8 TeV
Category N
DN
Sgg → H [%] VBF [%] W H [%] ZH [%] ttH [%]
Unconv. central, low p
Tt10900 51.8 93.7 4.0 1.4 0.8 0.2
Unconv. central, high p
Tt553 7.9 79.3 12.6 4.1 2.5 1.4
Unconv. rest, low p
Tt41236 107.9 93.2 4.0 1.6 1.0 0.1
Unconv. rest, high p
Tt2558 16.0 78.1 13.3 4.7 2.8 1.1
Conv. central, low p
Tt7109 33.1 93.6 4.0 1.3 0.9 0.2
Conv. central, high p
Tt363 5.1 78.9 12.6 4.3 2.7 1.5
Conv. rest, low p
Tt38156 97.8 93.2 4.1 1.6 1.0 0.1
Conv. rest, high p
Tt2360 14.4 77.7 13.0 5.2 3.0 1.1
Conv. transition 14864 40.1 90.7 5.5 2.2 1.3 0.2
Loose high-mass two-jet 276 5.3 45.0 54.1 0.5 0.3 0.1
Tight high-mass two-jet 136 8.1 23.8 76.0 0.1 0.1 0.0
Low-mass two-jet 210 3.3 48.1 3.0 29.7 17.2 1.9
E
Tmisssignificance 49 1.3 4.1 0.5 35.7 47.6 12.1
One-lepton 123 2.9 2.2 0.6 63.2 15.4 18.6
All categories (inclusive) 118893 395.0 88.0 7.3 2.7 1.5 0.5
Table 2: Signal mass resolution (σ
CB), number of observed events, number of expected signal events (N
S), number of expected background events (N
B) and signal to background ratio (N
S/N
B) in a mass window around m
H= 126.5 GeV containing 90% of the expected signal for each of the 14 categories of the 8 TeV data analysis. The numbers of background events are obtained from the background + signal fit to the m
γγdata distribution.
√ s 8 TeV
Category σ
CB( GeV) Observed N
SN
BN
S/N
BUnconv. central, low p
Tt1.50 911 46.6 881 0.05
Unconv. central, high p
Tt1.40 49 7.1 44 0.16
Unconv. rest, low p
Tt1.74 4611 97.1 4347 0.02
Unconv. rest, high p
Tt1.69 292 14.4 247 0.06
Conv. central, low p
Tt1.68 722 29.8 687 0.04
Conv. central, high p
Tt1.54 39 4.6 31 0.15
Conv. rest, low p
Tt2.01 4865 88.0 4657 0.02
Conv. rest, high p
Tt1.87 276 12.9 266 0.05
Conv. transition 2.52 2554 36.1 2499 0.01
Loose High-mass two-jet 1.71 40 4.8 28 0.17
Tight High-mass two-jet 1.64 24 7.3 13 0.57
Low-mass two-jet 1.62 21 3.0 21 0.14
E
Tmisssignificance 1.74 8 1.1 4 0.24
One-lepton 1.75 19 2.6 12 0.20
Inclusive 1.77 14025 355.5 13280 0.03
5.2 Background modelling
The invariant mass distribution of the background in each category is parameterised with analytic func- tions. The parameters of these analytic functions are determined from fits to the data in the 100-160 GeV diphoton invariant mass range. The choice of the functional form for the categories is based on stud- ies on MC samples where the γ-γ (S [63], D [64], M G [65]), γ-jets (S ), jet-jet (P [66]), and Drell-Yan (P ) components are combined according to the fractions determined from data-driven measurements [13]. In the S and P samples, detector effects are taken into account, including photon identification efficiency, photon energy resolution, jets misidentified as pho- tons and the fraction of converted photons in the different detector regions. In the D samples, photon identification efficiency is taken into account.
The choice of the function follows the method described in Ref. [6]. Depending on the category, it is either a fourth-order Bernstein polynomial, the exponential of a second-order polynomial, or a single exponential. For the inclusive data sample a fourth-order Bernstein polynomial is used. The systematic uncertainty on the background model (Table 4) is defined as the largest absolute signal component fitted anywhere in the full mass range studied [110-150] GeV with the background samples described above.
Because of the small number of events in the E
missTsignificance category, the background uncertainty is estimated with the inclusive m
γγspectrum using the ratio of yields between the inclusive and the E
missTsignificance selections.
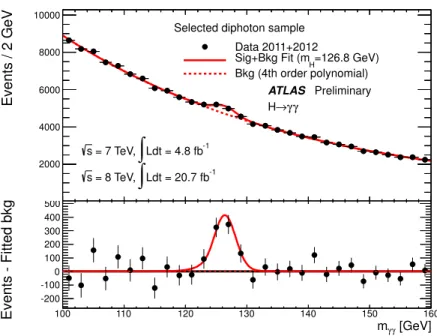
The inclusive invariant mass distribution of the diphoton candidates for the combined √
s = 7 TeV and √
s = 8 TeV data sample is shown in Figure 3 with overlaid signal-plus-background fit.
The excess of events around m
H= 126.5 GeV is discussed in detail in Section 7.
100 110 120 130 140 150 160
Events / 2 GeV
2000 4000 6000 8000 10000
ATLAS Preliminary γ
γ
→ H
Ldt = 4.8 fb-1
∫
= 7 TeV, s
Ldt = 20.7 fb-1
∫
= 8 TeV, s
Selected diphoton sample Data 2011+2012
=126.8 GeV) Sig+Bkg Fit (mH
Bkg (4th order polynomial)
[GeV]
γ
mγ
100 110 120 130 140 150 160
Events - Fitted bkg
-200 -100 0 100 200 300 400 500
Figure 3: Invariant mass distribution of diphoton candidates for the combined √ s = 7 TeV and √ s
= 8 TeV data samples. The result of a fit to the data of the sum of a signal component fixed to m
H= 126.8 GeV and a background component described by a fourth-order Bernstein polynomial is su- perimposed. The bottom inset displays the residuals of the data with respect to the fitted background component.
6 Systematic uncertainties
Most of the systematic uncertainties of this analysis are discussed in Ref. [6] and [13]. These will be only briefly described and updated here, while new systematic uncertainties arising from the introduction of additional categories will be adressed in more detail. All uncertainties are treated as fully correlated between 7 and 8 TeV data except that on the luminosity. The uncertainties can affect the signal yield, the signal resolution, the migration of events between categories and the mass measurement.
6.1 Uncertainties on the signal yield
The systematic uncertainties affecting the signal yield are the following:
• The uncertainty on the integrated luminosity is ± 3.6% for the 8 TeV data. It is obtained, following the same methodology as that detailed in Ref. [67], from a preliminary calibration of the luminos- ity scale derived from beam-separation scans performed in April 2012. For the 7 TeV data this uncertainty has been updated to 1.8%.
• The uncertainty on the trigger efficiency is 0.5% per event;
• The uncertainty on the photon identification efficiency for the 8 TeV analysis has decreased with
respect to Ref. [6]. It is based on the comparison of the efficiency obtained using MC and the
combination of data-driven measurements: extrapolation from Z → ee events, a method using
an inclusive photon sample and relying on a sideband technique, and radiative photons Z → ℓℓγ
studies based on more than 10 fb
−1of data. It also benefits from a better treatment of the multi- photon correlations. The resulting uncertainty on the event yield is 2.4%;
• The isolation cut efficiency, estimated by comparing data and MC for Z → ee events, introduces an uncertainty of 1%;
• The uncertainty on the photon energy scale leads to an uncertainty on the signal yield amounting to 0.25%;
• The theoretical uncertainties on the Higgs boson production, including PDF, missing higher or- der perturbative QCD corrections, and branching ratio, are unchanged from [13]. The followed prescriptions are detailed in [57, 58, 68];
• The theoretical uncertainty on the ggF+2 jet cross section prediction affects the high-mass two-jet category in particular. The uncertainty due to missing higher orders has been determined using a new approach [69], based on the MCFM [70] calculation. The new procedure uses an infrared sensitive variable, ∆Φ
γγ;j j, and the change of its distribution after the VBF selection to estimate the uncertainty. The uncertainty determined in this way was compared to the estimate using MCFM and was found to be in good agreement. These uncertainties are 48% (28%) in the tight (loose) high-mass two-jet categories. For the low-mass two-jet category MCFM based uncertainties are used, resulting in a 30% uncertainty.
These uncertainties are summarized in Table 5. The uncertainty on the background modelling is addressed in Section 5.2.
6.2 Uncertainties on the signal resolution The uncertainties affecting the mass resolution are:
• The calorimeter energy resolution uncertainty together with the uncertainty arising from the ex- trapolation from the electron to photon response, evaluated separately for each category, is found to be between 14 and 23% depending on the category. This uncertainty is larger than in the previous analysis [6] because it now takes into account additional differences observed between Z → ee data and MC events, as described in Section 5.1.
• Pile-up mis-modelling gives a ± 1.5% uncertainty;
• The uncertainty associated with the primary vertex selection, at the level of 0.2%, is considered negligible.
6.3 Migration uncertainties
The following sources produce uncertainties in the fraction of events being classified in different cate- gories (migration). They are summarized in Table 6.
• The material mis-modelling impact is at the level of -4% for unconverted photons categories and +3.5% for converted photons categories;
• The uncertainty in the population of the p
Ttcategories due to the modelling of the Higgs boson
kinematic properties is estimated by varying scales and PDFs used by HqT2 [58, 71] and has a
1.3% impact on the low- p
Ttcategories, 10.2% on the high-p
Ttcategories, 10.4% (8.5%) on the
tight (loose) high-mass two-jet categories, 12.5% on the low-mass two-jet category, 2.0% on the
E
missTcategory, and 4.0% on the one-lepton category;
• The uncertainties on the jet energy scale induce an effect of up to 11.8% (10.7%) for the tight (loose) high-mass two-jet category, a 6.7% effect on the low-mass two-jet category and up to 0.7%
for the other categories. The impact of the uncertainty on the jet energy resolution is found to be up to 3.8% (3.4%) on the tight (loose) high-mass two-jet category, 3.4% on the low-mass two-jet category, and up to 0.9% on the other categories;
• The uncertainty due to the modelling of the underlying event is estimated by comparing simula- tions with and without multi-parton interaction (MPI). The AU2-CT10 [72] tune is used for the default results, while samples without MPI are used for systematics studies. For the tight high- mass two-jet category, 8.8% uncertainty is assigned to ggF, VH and ttH and 2.0% to VBF. For the loose high-mass two-jet category, these uncertainties are 12.8% and 3.3% respectively. For the low-mass two-jet category, the uncertainty is found to be 12% for the ggF, VH and ttH processes and 3.9% for VBF;
• A systematic uncertainty is assigned to the modelling of the two-jet variables, in particular ∆φ
γγ;j j, in P for the ggF process, which is described with NLO QCD accuracy. P distributions are compared to those from LO S with matrix element matching for up to three partons in the final state, and reweighted. The resulting systematic uncertainties are 12.1% (8.5%) in the tight (loose) high-mass two-jet categories respectively;
• The systematic uncertainty coming from the modelling of the η
∗variable (defined in Section 4.3) in P for the ggF process is estimated by reweighting the jet distribution at the MC generator level to the MCFM distribution. The corresponding uncertainty for the tight (loose) high-mass two-jet category is 7.6% (6.2%);
• A systematic uncertainty is associated to the cut on the jet vertex fraction JVF, amounting to 0.3(1.2)% in the loose high-mass two-jet category for ggF (VBF), and 2.3(2.4)% in the low-mass two-jet category for ggF (VBF);
• The electron reconstruction and identification efficiency (< 1%), electron energy scale and resolu- tion (< 1%); the muon reconstruction efficiency, tracker resolution (< 1%) and muon spectrometer resolution (negligible). These uncertainties are only applied to the WH, ZH and ttH processes;
• E
missTuncertainties are assessed by shifting the transverse energy of each of the input objects (pho- tons, electrons, jets, soft terms) up and down by the uncertainties on their resolution and scale.
The resulting uncertainty on the E
missTcategory is 66.4% for gluon fusion production, 30.7% for VBF production and 1.2% for the associated production. The largest contributions come from the soft terms. The jet related terms are correlated to the jet energy scale and jet energy resolution uncertainties.
6.4 Mass uncertainties
The main sources of uncertainties on the mass measurement are evaluated separately for the different categories. They arise from the extrapolation of the photon energy scale from the Z → ee electron energy scale (0.3%), the material modelling (0.3%) and the presampler energy scale (0.1%). These systematic uncertainties amount to a total of 0.45% (0.6 GeV).
Dedicated cross checks have been performed on the mass measurement and additional systematic
uncertainties have been quantified in Ref. [6]. They are not treated as category-dependent. With respect
to this previous result, the uncertainty of 0.15% coming from varying the signal resolution within its
uncertainties was removed after more checks. These additional uncertainties on the mass measurement
amount to a total of 0.32% (0.4 GeV).
The total systematic uncertainty on the mass measurement is estimated to be 0.55% (0.7 GeV).
It has been checked that the mass measurements in subsets of the data, namely in the different cate- gories of photon p
Tand η, or events with different numbers of primary vertices, give consistent results within the statistical errors.
7 Results
7.1 Statistical procedure
The data are interpreted following the statistical procedure summarized in Ref. [73]. The signal strength parameter µ, defined as a scale factor of the number of signal events expected from the SM Higgs boson hypothesis, is the parameter of interest. A profile likelihood ratio based test statistic λ(µ) is used to test different hypothesised values of µ. The background-only hypothesis is tested with λ(0) and a signal plus background hypothesis is tested with λ(µ). A likelihood function, describing the probability distribution function of m
γγunder a µ-times-signal plus background hypothesis as well as the systematic uncertain- ties, is used to build λ(µ). The likelihood function from the analysis of the 8 TeV data is combined with the likelihood function from the analysis of the 7 TeV data.
The statistical tests are carried out at a series of values of m
Hfrom 110 GeV to 150 GeV in which the step size is 0.5 GeV.
The local p
0value, the probability of the background fluctuating beyond the observation in the data at a particular m
H, is calculated to quantify the significance of an excess. It is also converted to the number of standard deviations from the background-only hypothesis and referred to as the local significance.
7.2 Signal significance
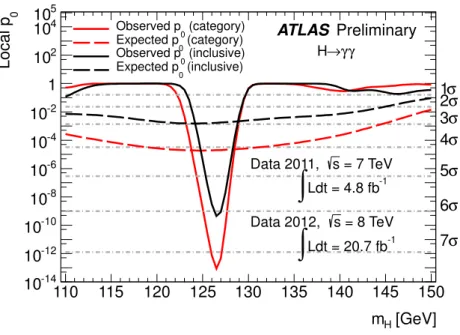
The observed local p
0values, as well as the expected p
0values corresponding to a SM Higgs boson signal plus background hypothesis, are shown in Figure 4 as a function of m
H. The largest local significance in the combination of 7 TeV and 8 TeV data is found to be 7.4 σ at m
H= 126.5 GeV, where the expected significance is 4.1 σ. The largest observed (expected) local significance for the inclusive analysis is 6.1(2.9) σ.
7.3 Mass measurement and signal strength 7.3.1 Mass measurement
The parameter of interest in the test statistic is changed to m
Hin order to estimate the mass of the observed new particle, and the signal strength parameter µ is treated as a free parameter in the fits. The best-fit m
Hvalue is found to be 126.8 GeV, and its statistical and systematic uncertainties are ± 0.2 GeV and ± 0.7 GeV, respectively. With this larger data sample, the value of the measured mass increases by 200 MeV compared to Ref [6]. The dominant contribution to the systematic uncertainty comes from the uncertainties on the photon energy scale.
7.3.2 Signal strength
The best-fit values of the signal strength µ and m
Hare shown in Figure 5. At the best-fit value m
H= 126.8 GeV, µ is found to be 1.65
+0.34−0.30. The µ uncertainty of
+0.34−0.30is further broken down to
+0.24−0.24(stat) and
+0.25−0.18
(syst). The systematic uncertainty includes the signal yield, signal resolution and migration
uncertainties and the uncertainties on the inclusive Higgs boson production cross section and decay
branching ratio.
[GeV]
m
H110 115 120 125 130 135 140 145 150
0
Local p
10
-1410
-1210
-1010
-810
-610
-410
-21 10
210
410
5σ 1 σ 2 σ 3
σ 4
σ 5
σ 6
σ 7
(category) Observed p0
(category) Expected p0
(inclusive) Observed p0
(inclusive) Expected p0
= 7 TeV s
Data 2011,
Ldt = 4.8 fb-1
∫
= 8 TeV s
Data 2012,
Ldt = 20.7 fb-1
∫
ATLAS Preliminary
γγ H→
Figure 4: The observed local p
0value as a function of m
Hfor the combination of √ s = 7 TeV and
√ s = 8 TeV data for the inclusive case (black) and for the analysis using categories (red). The expected local p
0under the SM Higgs boson signal plus background hypothesis is shown by the dashed curves.
The compatibility in the signal strength parameter between the data and the SM Higgs boson signal plus background hypothesis is estimated with the test statistic λ(µ) with µ = 1
4, and is found to be at the 2.3 σ level.
The results reported above are extracted from a fit in which the mass resolution uncertainty, which is ∼ 20%, is treated as a nuisance parameter with a Gaussian constraint. As a check, the fit was repeated with no constraint on the mass resolution parameter, giving µ = 1.49 ± 0.33 (1.8 σ compatibility with the SM Higgs boson signal hypothesis). This fit prefers a narrower mass resolution than the nominal one by 1.8 σ, which is better than the resolution corresponding to a perfectly uniform calorimeter. Dedicated studies revealed no indication that the systematic uncertainty on the resolution is underestimated; the large pull in this test fit can also be a statistical effect arising from background fluctuations.
The effects of systematic uncertainties, in particular the photon energy scale, on the measurement of mass and signal strength are shown in Figure 5.
7.4 Couplings and production modes
As discussed in Section 4, several categories targeting different production modes have been introduced.
Two of them (loose and tight high-mass two-jet) are enriched in VBF events, and three of them (low- mass two-jet, E
missTsignificance and one-lepton) are enriched in VH events. Such an analysis provides constraints on the signal strength of individual production modes.
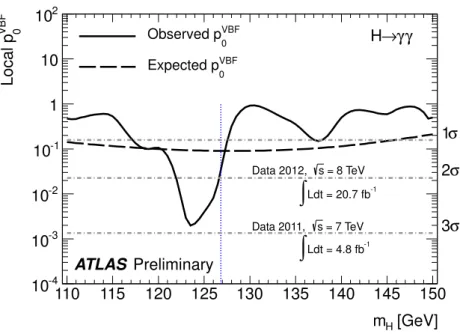
First, the observed and expected local p
V BF0value corresponding to a SM Higgs boson signal pro- duced in VBF plus background hypothesis is computed as a function of m
H. The ggF, WH, ZH and ttH processes are considered as background here and their respective signal strengths are treated as nuisance parameters. The resulting local p
V BF0value from the combination of 7 TeV and 8 TeV data is shown in Figure 6. The largest local significance is found to be 2.9 σ at m
H= 123.5 GeV where the expected
4The unconditional maximum likelihood estimatorµis restricted to be equal to or larger than 1 inλ(1).
[GeV]
mH
124 125 126 127 128 129 130
µ
0.5 1 1.5 2 2.5
3 All systematics
Without mass scale uncertainties Without systematic
Best fit
Ldt=4.8 fb-1
∫
=7 TeV, s
Ldt =20.7 fb-1
∫
=8 TeV, s 68% CL
95% CL
ATLAS
Preliminary γ γ→ H
Figure 5: The best-fit values of m
Hand µ, and their 68% (blue) and 95% (red) CL contours. Results when photon energy scale systematic uncertainties are removed (dashed), and results when all systematic uncertainties are removed (dotted), are also shown.
significance is 1.3 σ. The expected (observed) significances at m
H= 126.8 GeV are 1.3 σ (2.0 σ) respectively.
In a second step, signal strength parameters for different Higgs boson production modes are intro- duced to characterise their contributions to the observed excess. To further enhance the sensitivity, the ggF and ttH processes are grouped together to share the same signal strength parameter, µ
ggF+ttH, as they both involve the coupling between a Higgs boson and top quarks. Similarly, the VBF and VH pro- cesses are grouped together to share the same signal strength parameter µ
V BF+V H. The fitted µ
ggF+ttHand µ
VBF+VHare muliplied by a common scale factor B/B
SM, where B is the branching ratio for H → γγ and B
SMis the branching ratio for H → γγ predicted by the SM. The simultaneously fitted values of µ
ggF+ttH× B/B
SMand µ
VBF+VH× B/B
SMin data are presented in Figure 7, where the 68% and 95%
CL contours are also shown. A simultaneous fit is also performed to determine the signal strengths of µ
ggF+ttH× B/B
SM, µ
VBF× B/B
SM, and µ
VH× B/B
SM, where the VBF and VH production modes are separated, and the best-fit values are:
• µ
ggF+ttH× B/B
SM= 1.6
+0.3−0.3(stat)
+0.3−0.2(syst);
• µ
VBF× B/B
SM= 1.7
+0.8−0.8(stat)
+0.5−0.4(syst). The total expected uncertainty is improved by 32% with respect to the analysis described in Ref. [6] for the same integrated luminosity;
• µ
VH× B/B
SM= 1.8
+1.5−1.3(stat)
+0.3−0.3(syst). The total expected uncertainty is improved by 27% with respect to the analysis described in Ref. [6] for the same integrated luminosity.
These results are also shown in Figure 8.
7.5 Fiducial cross section
The cross section in the fiducial region, σ
fid, for the production of the observed particle at a mass of 126.8 GeV was measured with the √
s = 8 TeV data corresponding to an integrated luminosity of 20.7 fb
−1. The
[GeV]
m
H110 115 120 125 130 135 140 145 150
VBF 0
Local p
10
-410
-310
-210
-11 10 10
2VBF
Observed p0 VBF
Expected p0
= 8 TeV s Data 2012,
Ldt = 20.7 fb-1
∫
= 7 TeV s Data 2011,
Ldt = 4.8 fb-1
ATLAS Preliminary ∫
σ 1
σ 2
σ 3 γ γ
→ H
Figure 6: The observed local p
V BF0value for VBF H → γγ production as a function of m
Hfor the combination of √
s = 7 TeV and √
s = 8 TeV data (solid black). The corresponding expected local p
V BF0value for the SM Higgs boson signal plus background hypothesis are shown by the dashed curve. A vertical line is drawn at the best-fit mass m
H= 126.8 GeV.
B/B
SM ggF+ttH×
-1 -0.5 0 0.5 1 1.5 2 2.5 µ 3 3.5 4
SM
B/B ×
VBF+VHµ
-2 -1 0 1 2 3 4 5 6 7
Preliminary ATLAS
2011-2012 = 126.8 GeV mH
= 7 TeV s
-1, Ldt = 4.8 fb
∫
= 8 TeV s
-1, Ldt = 20.7 fb
∫
Best fit 68% CL 95% CL SM
γ γ
→ H
Figure 7: The best-fit values (+) of µ
ggF+ttH× B/B
S Mand µ
V BF+V H× B/B
S Mfrom a simultaneous fit to
the data and their 68% (solid) and 95% (dashed) CL contours. The expectation for a SM Higgs boson is
also shown ( × ).
Signal strength
0 1 2 3 4 5 6
Preliminary ATLAS
2011-2012 = 126.8 GeV mH
γ γ
→ H
= 7 TeV s
-1, Ldt = 4.8 fb
∫
= 8 TeV s
-1, Ldt = 20.7 fb
∫
Total Stat.
Syst.
µ
ggH+ttH
![Figure 2: (a) The response of the VBF BDT to the data in the signal sidebands (excluding the m γγ ∈ [120- [120-130] GeV region) and to the expected background after selection cuts, normalized to unity](https://thumb-eu.123doks.com/thumbv2/1library_info/4023499.1541924/8.892.116.776.124.372/figure-response-sidebands-excluding-expected-background-selection-normalized.webp)