A TLAS-CONF-2016-060 08 August 2016
ATLAS NOTE
ATLAS-CONF-2016-060
8th August 2016
Search for resonances in the mass distribution of jet pairs with one or two jets identified as b-jets with the ATLAS detector with
2015 and 2016 data
The ATLAS Collaboration
Abstract
Searches for resonances in the dijet invariant mass spectrum with one or two jets identified as b-jets are presented. The dataset consists of an integrated luminosity of 13.3 fb
−1of proton–proton collisions with a centre-of-mass energy of √
s = 13 TeV recorded in 2015 and 2016 by the ATLAS detector at the Large Hadron Collider. No evidence of new phenomena is found in the data. Excited b
∗quarks with masses up to 2.3 TeV at leading- order in QCD are excluded at 95% credibility level. Contributions of a Gaussian signal shape with effective cross sections ranging from approximately 0.2 to 0.001 pb are also excluded in the mass range 1.4–5.5 TeV.
© 2016 CERN for the benefit of the ATLAS Collaboration.
Reproduction of this article or parts of it is allowed as specified in the CC-BY-4.0 license.
1. Introduction
Many extensions to the Standard Model (SM) predict the existence of new massive particles that couple to quarks (q) or gluons (g). If produced in proton–proton (pp) collisions at the Large Hadron Collider (LHC), these new beyond-the-SM (BSM) particles would decay, creating resonant excesses in the two- jet (dijet) invariant mass distributions [1–6]. If the new particle couples to the b-quark it would decay into b b, ¯ bq or bg pairs. A dedicated search for dijet resonances with one or both jets identified as originating from a b-quark (“b-jet”) increases the signal sensitivity in this scenario.
Resonance searches using events containing two b-jets have been performed by the CDF [7] and CMS [8, 9] experiments, probing the mass ranges of 200–750 GeV and 1–4 TeV respectively. The increase in the centre-of-mass energy √
s to 13 TeV of the pp collisions at the LHC provides a new energy regime. Heavy resonances in the mass range 1.1–5.0 TeV decaying to b-jets have been probed by the ATLAS experiment using 3.2 fb
−1of pp collisions at √
s = 13 TeV [10]. Searches not requiring b-tagging have also been performed. Using 8 TeV pp collision data, CMS excluded excited quarks and Z
0in the mass range 500–1600 GeV using data scouting [11]. ATLAS used a trigger-level analysis to perform a search for narrow resonances in the dijet mass spectrum [12] and set limits on Gaussian cross sections ranging from 3 pb at 450 GeV to 0.7 pb at 850 GeV. A new strategy for inspecting dijet masses as low as 0.6 TeV based on identifiying b-jets at the trigger level was recently reported by the ATLAS experiment [13].
In this note a search for new narrow resonances decaying to b-quarks, using 13.3 fb
−1integrated lu- minosity of pp collisions at √
s = 13 TeV collected with the ATLAS detector, is reported. The search is based on the strategy outlined in Ref. [10] and profits from an enlarged dataset and an improved algorithm for the identification of b-jets [14].
b
g b
g b*
q
q b
b Z'
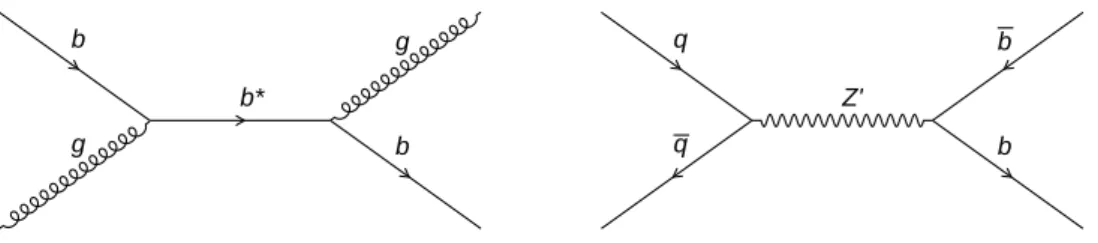
Figure 1: Leading-order Feynman diagrams for the two processes considered: g b → b
∗→ bg and q q ¯ → Z
0→ b b. ¯
The results are interpreted in the context of two benchmark processes shown in Figure 1: an ex- cited heavy-flavour quark b
∗and a new gauge boson Z
0. Excited quarks are a consequence of quark compositeness models that were proposed to explain the generational structure and mass hierarchy of quarks [15, 16]. The Z
0boson arises in many extensions to the SM as an additional U(1) symmetry group. Two Z
0models, the Sequential Standard Model (SSM) with SM-like fermion couplings and the leptophobic Z
0model [17, 18], are considered with a production cross-section computed at the next- to-leading (NLO) order in perturbative QCD (pQCD). The benchmark models are expected to result in a narrow resonance superimposed on a smoothly falling dijet invariant mass distribution.
This search divides the events into categories with at least one or two jets identified as b-jets to enhance
the signal sensitivity to the two b
∗and Z
0benchmark models. Results are also interpreted in the context
of generic Gaussian-shaped signals with widths of up to 15% of the resonance mass.
2. The ATLAS detector
The ATLAS experiment [19] at the LHC is a multi-purpose particle detector with a forward-backward symmetric cylindrical geometry and a near 4π coverage in solid angle.1 It consists of an inner tracking detector surrounded by a thin superconducting solenoid providing a 2 T axial magnetic field, electro- magnetic and hadronic calorimeters, and a muon spectrometer. The inner tracking detector covers the pseudorapidity range |η | < 2.5. It consists of, in ascending order of radius from the beam-line, silicon pixel, silicon microstrip, and transition radiation tracking detectors. The pixel detectors are crucial for b-jet identification. For the second LHC data-taking period, at √
s = 13 TeV, a new inner pixel layer, the Insertable B-Layer (IBL) [20, 21], was added at a mean sensor radius of 3.2 cm from the beam-line.
Lead / liquid-argon (LAr) sampling calorimeters provide electromagnetic (EM) energy measurements with high granularity. A hadronic (steel / scintillator-tile) calorimeter covers the central pseudorapidity range (|η | < 1.7). The end-cap and forward regions are instrumented with LAr calorimeters for EM and hadronic energy measurements up to |η | = 4.9. A two-level trigger system, using custom hardware followed by a software-based level, is used to reduce the event rate to a maximum of around 1 kHz for offline storage.
3. Data and simulated event samples
The data were collected by the ATLAS detector in pp collisions at the LHC with a centre-of-mass en- ergy of 13 TeV during 2015 and 2016. Events were recorded using a single-jet trigger with a threshold on the transverse momentum p
Tof 360 GeV in 2015 data and of 380 GeV in 2016 data. The full data- set corresponds to an integrated luminosity of 3.2 fb
−1in 2015 data and 10.1 fb
−1in 2016 data after applying good quality criteria.
Monte Carlo (MC) simulated event samples are used to model the expected signals and study the composition of SM background processes. The QCD dijet process is simulated with P ythia 8 [22] using the A14 parameter set [23] for the modelling of the parton shower, hadronization and underlying event.
The leading-order parton distribution function (PDF) set NNPDF2.3 [24] is used for the generation of events. The renormalisation and factorisation scales are set to the average p
Tof the two leading jets.
The E vt G en decay package [25] is used for bottom and charm hadron decays.
All the signal models are generated with the same generator, parameter set and PDF set as the QCD dijet samples. Z
0boson signal events are simulated with masses in steps of 250 GeV between 1.5 and 2 TeV, steps of 500 GeV between 2 and 3 TeV and steps of 1 TeV for signal points above 3 TeV. The intrinsic Z
0width is set to 3% of the resonance mass; only decays to b-quark pairs are simulated. In the SSM Z
0model, the same couplings to SM fermions as the SM Z boson are assumed for the interpretation,
1
ATLAS uses a right-handed coordinate system with its origin at the nominal interaction point (IP) in the centre of the detector and the z-axis along the beam pipe. The x-axis points from the IP to the centre of the LHC ring, and the y-axis points upwards. Cylindrical coordinates (r, φ) are used in the transverse plane, φ being the azimuthal angle around the z-axis. The pseudorapidity is defined in terms of the polar angle θ as η = −ln tan(θ/2). Angular distance is measured in units of ∆R ≡
q (∆η)
2+ (∆φ)
2.
resulting in a decay branching ratio (BR) to bottom quarks of 13.8%. The leptophobic Z
0model di ff ers by having vanishing couplings to leptons. This results in a decay branching ratio to bottom quarks of 18.9% (assuming the coupling of Z
0→ W W is 0). The Z
0signals are normalised to NLO pQCD predictions [26–28]. For the b
∗model the same mass points are simulated. The compositeness scale is set to the excited-quark mass. The dominant decay mode is to bg with a BR of 85% while the remaining decay modes are to W t, bZ and bγ with BRs of 10%, 4.5% and 0.5% respectively. The intrinsic b
∗width is 0.6% of the resonance mass.
The generated samples are processed with the ATLAS detector simulation [29], which is based on the GEANT4 package [30]. To account for additional pp interactions from the same or close-by bunch crossings, a number of minimum-bias interactions generated using P ythia 8 and the MSTW2008LO PDF set [31] are superimposed onto the hard scattering events.
4. Object reconstruction and event selection
Jets are reconstructed from noise-suppressed topological clusters [32] of energy deposited in the calor- imeters using the anti-k
talgorithm [33] with a radius parameter of 0.4. Jet calibrations are used to correct the jet energies and directions to those of the particles from the hard-scatter interaction. This calibration procedure is improved by a data-derived correction to the relative calibration of jets in the forward regions compared to central jets [34]. The analysis is then performed in the dijet mass range of m
jj> 1.38 TeV.
Charged-particle tracks are reconstructed with a p
Tthreshold of 400 MeV. Event vertices are formed from these tracks and are required to have at least two tracks. The primary vertex is chosen as the vertex with the largest Σp
T2of the associated tracks.
The b-jets are identified (b-tagged) by exploiting the relatively long lifetime and large mass of b- hadrons. The b-tagging methods are based on the presence of tracks with large impact parameters, the presence and properties of displaced secondary vertices, and the reconstructed flight paths of b- and c-hadrons associated with the jet [35]. This information is combined into a single discriminant by employing a multivariate algorithm. The b-tagging algorithm has been optimised for the 2016 LHC run as described in Ref. [14]. The b-tagging working point with 85% efficiency, as determined when integrating over all jets in a simulated sample of t¯ t events, is chosen. As the average jet energies in this analysis are larger than in t¯ t events, the e ffi ciency is below 85% and is roughly 60% for jets with a p
Tof 1 TeV. The light-flavour jet rejection at the same p
Tis approximately 20.
Events where any of the three leading jets with p
T> 60 GeV is compatible with non-collision back- ground or calorimeter noise are removed. The p
Tof the leading and sub-leading jets is required to be greater than 430 GeV and 60 GeV respectively. A requirement on the jet pseudorapidity, |η | < 2.4, is made on the two leading jets to ensure full tracker coverage for b-jet identification purposes. The rapidity di ff erence y
∗= ( y
1− y
2)/2 between the two leading jets is required to be |y
∗| < 0.6. Here y
1and y
2are the rapidities of the leading and sub-leading jet respectively. This requirement favours s-channel production and reduces the large background contribution from t-channel multijet processes.
The b-jet identification algorithm is applied to the two leading jets, and events are categorised as “1b”,
if at least one jet is b-tagged, or “2b”, if both jets are b-tagged. The “1b” category, being defined in-
clusively, includes events from the “2b” category. The same event selection is applied to both 2015 and
2016 data.
[TeV]
m
jj1.5 2 2.5 3 3.5 4 4.5 5
Event Tagging Efficiency
0 0.2 0.4 0.6 0.8 1
1 b-tag
≥ Z'
1 b-tag
≥ b*
Z' 2 b-tag ATLAS Simulation Preliminary
= 13 TeV m = 1.5 TeV s
m = 2 TeV
m = 2.5 TeV m = 3 TeV
m = 4 TeV m = 5 TeV
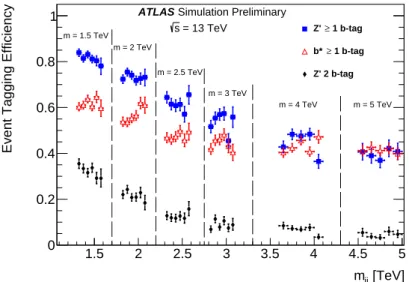
Figure 2: The per-event b-tagging e ffi ciencies after the event selection as a function of the reconstructed invariant mass, m
jj, for simulated event samples with six di ff erent b
∗and Z
0resonance masses.
Simulated Mass [TeV]
1.5 2 2.5 3 3.5 4 4.5 5
trigger eff. × Acceptance
0 0.1 0.2 0.3 0.4 0.5 0.6 0.7 0.8 0.9 1
b* inclusive Z’ inclusive 1-btag
≥ b*
Z’ 2 b-tag = 13 TeV
s
ATLAS Simulation Preliminary
Figure 3: Signal acceptance times trigger e ffi ciency without applying b-tagging (inclusive) and for ≥1 b-tag and 2 b-tag categories as a function of the simulated b
∗and the Z
0masses.
The per-event b-tagging e ffi ciencies as functions of the reconstructed invariant mass are shown in Fig- ure 2. E ffi ciencies are for benchmark models with di ff erent b
∗and Z
0resonance masses, after the event selection is applied. The per-event b-tagging efficiency for Z
0events in the inclusive “1b” category is higher than for b
∗events because this process has more b-quarks in the final state. At high mass, the gluon from the decay of the b
∗has a higher probability to produce a b b-pair, which causes the event ¯ tagging efficiency to be comparable for the Z
0and b
∗.
Correction factors are applied to the simulated event samples to compensate for di ff erences between
data and simulation in b-tagging efficiencies and mis-identification rates. The correction for the b-
tagging efficiency on b-jets is derived from a calibration analysis in a b-quark enriched sample of tt
events in the dilepton channel.
The signal acceptance times trigger efficiency is shown in Figure 3 for the b
∗and Z
0benchmarks. The maximum combined acceptance and e ffi ciency is 7% at 2 TeV for the Z
0signal in the “2b” category and 24% at 2.5 TeV for the b
∗signal in the “1b” category.
5. Dijet mass spectrum
The m
jjspectrum is predominantly composed of jets arising from QCD interactions. The multijet background estimation does not rely on the simulation as it is obtained directly from a fit to the m
jjdistribution. The following parametrization ansatz is adopted to fit the m
jjdistribution:
f ( x) = p
1(1 − x)
p2x
p3, (1)
where p
iare free parameters, and x = m
jj/ √
s. This ansatz was used in various previous searches [5, 10, 13]. Employing Wilks’ theorem [36], a log-likelihood statistic is used to confirm that no additional parameters are needed to describe the shape of the distribution. A significant improvement when ad- opting an additional degree of freedom in the fit function is delineated as a Wilk’s p-value less than 0.05. Eq. (1) is found to be adequate for the dataset being considered.
The considered m
jjrange is from 1.38 TeV up to the last data point of the inclusive “1b” and “2b” mass distributions. The lower bound of the mass range is chosen considering both trigger turn-on effects and fit stability. The fit stability is addressed by employing the Wilks’ theorem as in the fit function choice.
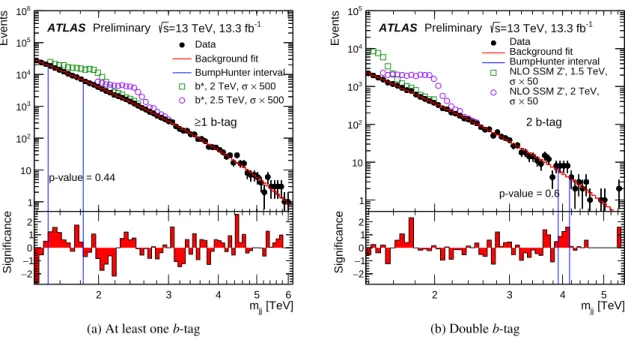
The fits are overlaid on the data in Figure 4. The bin widths, which range from 3% at 1.5 TeV to 2% at 5.0 TeV, are chosen to approximate the m
jjresolution as derived from simulated QCD processes. The lower panels of Figure 4 show the significances of bin-by-bin di ff erences between the data and the fit.
These equivalent Gaussian significances are calculated from the Poisson probability, considering only statistical uncertainties. The statistical significance of localised excesses in the dijet mass distribution is quantified using the B ump H unter algorithm [37]. The algorithm compares the binned m
jjdistribution of the data to the fitted background estimate, considering contiguous mass intervals in all possible locations, from a width of two bins to one-half of the distribution. For each interval in the scan, it computes the significance of any excess found. The most discrepant intervals found by the B ump H unter algorithm are indicated by the vertical lines in Figure 4. Without considering systematic uncertainties, p-values of 0.75 and 0.62 are found for the “1b” and “2b” categories respectively. The p-value is calculated as a goodness-of-fit measure using a χ
2test statistic determined from pseudo-experiments.
Thus, there is no evidence of localised contributions to the mass distribution from BSM phenomena.
6. Systematic uncertainties
The systematic uncertainties on the background estimate take into account the uncertainty in the choice of the fit function in Eq. (1) and the uncertainty in the parameters of the fit. The former is estimated by adding a multiplicative factor to the the fit function, x
p4log(x), with p
4as fourth floating parameter.
The latter is estimated by fitting pseudo-experiments generated with Poisson statistics around the back-
ground predicted by the fit function.
[TeV]
mjj
Events
1 10 102
103
104
105
106
[TeV]
mjj
Significance 2−1−
0 1 2
2 3 4 5 6
ATLAS Preliminary s=13 TeV, 13.3 fb-1 Data Background fit BumpHunter interval
× 500 σ b*, 2 TeV,
× 500 σ b*, 2.5 TeV,
1 b-tag
≥
p-value = 0.44
(a) At least one b-tag
[TeV]
mjj
Events
1 10 102
103
104
105
[TeV]
mjj
Significance 2−1−
0 1 2
2 3 4 5
ATLAS Preliminary s=13 TeV, 13.3 fb-1 Data
Background fit BumpHunter interval NLO SSM Z', 1.5 TeV,
× 50 σ
NLO SSM Z', 2 TeV,
× 50 σ
2 b-tag
p-value = 0.6
(b) Double b-tag
Figure 4: Dijet mass spectra overlaid with the fits to the background function together with the results from B ump H unter and benchmark signals. The most discrepant region is indicated by the two blue lines. The lower panels show the significances per bin of the data with respect to the background fit, in terms of the number of standard deviations, considering only the statistical uncertainties. The distributions are shown for the (a) “1b”
and (b) “2b” categories.
The uncertainty on the combined 2015 and 2016 integrated luminosity is 2.9%. It is derived, following a methodology similar to that detailed in Ref. [38], from a preliminary calibration of the luminosity scale using x–y beam-separation scans performed in August 2015 and May 2016.
The uncertainty in the jet energy scale and resolution is estimated using untagged jets in 13 TeV data and simulation by following the methods described in Ref. [34]. The total uncertainty is found to be approximately 1% for both the jet energy scale and the jet energy resolution across the investigated mass range.
The additional uncertainty in the energy scale of b-tagged jets is estimated using the MC samples and verified with data following the method described in Ref. [39]. The ratio r
trkof the sum of track transverse momenta inside the jet to the total jet transverse momentum measured in the calorimeter is used for this estimate. The double ratio of r
trkfrom data and simulation is formed and compared for inclusive jets and b-jets. The estimated relative additional uncertainty is found to be at most 2.6% in the jet p
Tspectrum of interest. This relative uncertainty is applied in addition to the nominal jet energy scale uncertainty.
Uncertainties on the correction factors for the b-tagging identification response are applied to the sim-
ulated event samples [35, 40] and are the largest uncertainties in this analysis. The uncertainty in the
measured tagging efficiency of b-jets is estimated by studying t¯ t events in 13 TeV data. An additional
term is included to extrapolate the measured uncertainties to the high-p
Tregion of interest. This term
is calculated from simulated events by considering variations on the quantities a ff ecting the b-tagging
performance such as the impact parameter resolution, percentage of poorly measured tracks, descrip-
tion of the detector material, and track multiplicity per jet. The dominant effect on the uncertainty when
extrapolating to high-p
Tis related to the di ff erent tagging e ffi ciency when smearing the track impact parameters based on the resolution measured in data and simulation. The impact of the b-tagging effi- ciency uncertainty increases with jet p
Tand reaches 50% above 2 TeV. The corresponding uncertainty on the m
jjspectrum varies between 20% and 50% for the b
∗benchmark and between 10% and 70% for the Z
0benchmark.
7. Results
In the absence of a signal, 95% credibility-level upper limits are set on the cross sections of the bench- mark models being considered. The limits are obtained using a Bayesian method [41]. The Bayesian credibility intervals are calculated using a posterior probability density from the likelihood function for the observed mass spectrum obtained by the fit to the background in Eq. (1), while the signal shape is taken as provided by the simulated samples. The limits are interpolated between discrete values of the mass to create a continuous curve. The systematic uncertainties associated with the integrated lumin- osity, jet energy scale, jet energy resolution, b-tagging, and alternative fit functions are included in the limit setting. The dominant contribution of the systematic uncertainties to the limit setting is the jet energy scale. The jet energy resolution e ff ect is minimized by the binning.
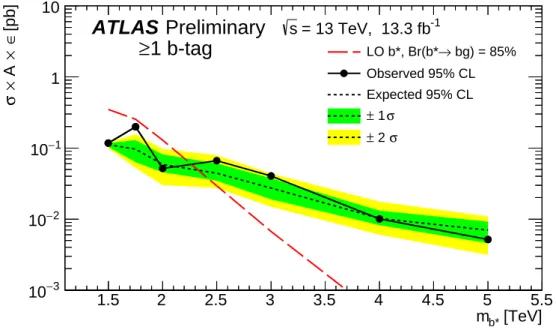
The limits on b
∗and Z
0cross sections are shown in Figures 5 and 6. The b
∗model is excluded for b
∗masses from 1.38 TeV up to 2.3 TeV at leading-order in QCD. The b
∗model is simulated to decay to bg with a branching ratio of 85%. The other decays are also taken into account when computing the limits.
1.5 2 2.5 3 3.5 4 4.5 5 5.5
−3
10
−2
10
−1
10 1 10
1.5 2 2.5 3 3.5 4 4.5 5 5.5
−3
10
−2
10
−1
10 1 10
[TeV]
m
b*1.5 2 2.5 3 3.5 4 4.5 5 5.5
[pb] ∈ × A × σ
−3
10
−2
10
−1
10 1 10
bg) = 85%
→ LO b*, Br(b*
Observed 95% CL Expected 95% CL
σ
± 1 σ
± 2
= 13 TeV, 13.3 fb
-1ATLAS Preliminary s
1 b-tag
≥
Figure 5: Observed (filled circles) and expected (dotted line) 95% credibility-level upper limits on the cross
section (σ) times acceptance (A) times b-tagging e ffi ciency () for the b
∗model with BR(b
∗→ bg) = 85%. The
dashed line shows the cross section calculated from theory.
1.5 2 2.5 3 3.5 4 4.5 5 5.5
−3
10
−2
10
−1
10 1
1.5 2 2.5 3 3.5 4 4.5 5 5.5
−3
10
−2
10
−1
10 1
[TeV]
m
Z’1.5 2 2.5 3 3.5 4 4.5 5 5.5
[pb] ∈ × A × σ
−3
10
−2
10
−1
10 1
NLO SSM Z’
NLO Leptophobic Z’
Observed 95% CL Expected 95% CL
σ
± 1 σ
± 2
= 13 TeV, 13.3 fb
-1ATLAS Preliminary s
2 b-tag
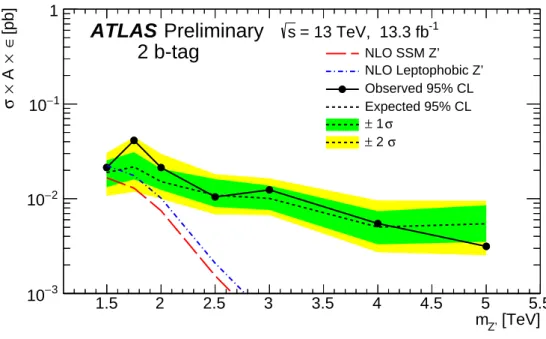
Figure 6: Observed (filled circles) and expected (dotted line) 95% credibility-level upper limits on the cross section (σ) times acceptance (A) times b-tagging e ffi ciency () times branching ratio (BR) for the SSM Z
0model with BR(Z
0→ b b) ¯ = 13.8% and leptophobic Z
0model with BR(Z
0→ b b) ¯ = 18.9%, assuming the coupling of Z
0→ W W is 0. The dashed lines show the cross section calculated from theory.
The SSM Z
0model with BR(Z
0→ b b) ¯ = 13.8% can not be excluded in this analysis at next-to-leading- order in QCD. The observed (expected) limit of the leptophobic Z
0model with BR(Z
0→ b b) ¯ = 18.9%, assuming the coupling of Z
0→ W W is 0, is 1.5 (1.6) TeV at next-to-leading-order in QCD.
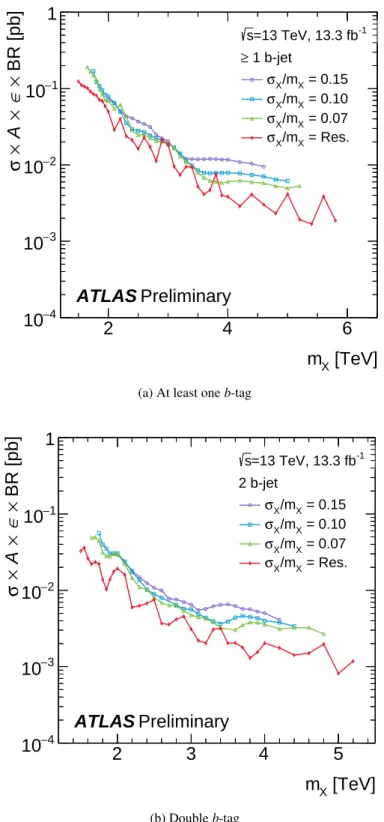
Narrow resonance contributions of various widths with cross sections σ × BR ranging from approx- imately 0.2 to 0.001 pb are excluded in the mass range 1.4–5.5 TeV, as shown in Figure 7. The limits are calculated assuming that the width of the Gaussian signal is 15%, 10% and 7% of the mass of the signal. In addition a width defined by the dijet mass resolution, which is roughly 2% for the dijet mass near 4 TeV, is also considered. The limits include systematic uncertainties due to the luminos- ity uncertainty, the alternative fit function, and an additional 10% uncertainty to incorporate sources of experimental systematic uncertainties related to signal modeling. These limits are applicable when low-mass off-shell tails and non-perturbative effects on the narrow resonance signal shape can be neg- lected and, after applying the selection performed in this search, the reconstructed mass distribution approximates a Gaussian distribution.
8. Summary
A search for new resonances decaying to one or two b-jets in pp collisions with the ATLAS detector at the LHC is presented. The dataset corresponds to an integrated luminosity of 13.3 fb
−1collected at √
s = 13 TeV in 2015 and 2016. The studies use the dijet mass range of m
jj> 1.38 TeV with b-
tagging applied to the leading and sub-leading jets and categorise the events according to their b-jet
[TeV]
m
X2 4 6
BR [pb] × ∈ × A × σ
−4
10
−3
10
−2
10
−1
10 1
ATLAS Preliminary
=13 TeV, 13.3 fb
-1s 1 b-jet
≥
= 0.15 /m
Xσ
X= 0.10 /m
Xσ
X= 0.07 /m
Xσ
X= Res.
/m
Xσ
X(a) At least one b-tag
[TeV]
m
X2 3 4 5
BR [pb] × ∈ × A × σ
−4
10
−3
10
−2
10
−1
10 1
ATLAS Preliminary
=13 TeV, 13.3 fb
-1s 2 b-jet
= 0.15 /m
Xσ
X= 0.10 /m
Xσ
X= 0.07 /m
Xσ
X= Res.
/m
Xσ
X(b) Double b-tag
Figure 7: The 95% credibility-level upper limits on the cross section (σ) times acceptance (A) times b-tagging
e ffi ciency () times branching ratio (BR) for resonances exhibiting a generic Gaussian shape. The circles, squares
and triangles correspond to the cases where the width of the Gaussian signal (σ
x) is 15%, 10% or 7% of the signal
mass. The diamonds correspond to the case where the width is given by the dijet mass resolution. The plots show
the limits obtained, applying (a) at least one b-tag and (b) double b-tag.
multiplicity.
No evidence of a significant excess of events is found compared to the expectations of the Standard Model. The expected contribution from the b
∗model is excluded in the mass range 1.38–2.3 TeV at leading-order in QCD using the inclusive single b-jet channel. The expected contribution from the SSM Z
0can not be excluded in this analysis at next-to-leading-order in QCD using the double b-jet channel.
The observed (expected) limit of the leptophobic Z
0model is 1.5 (1.6) TeV at next-to-leading-order in QCD using the double b-jet channel.
This analysis excludes generic high-mass particles decaying to two jets, where one or two jets originate from b-quarks, with visible cross sections ranging from 0.2 to 0.001 pb in the mass range 1.4–5.5 TeV.
The exclusion limits are applicable for resonances exhibiting a Gaussian shape with widths ranging
from the dijet mass resolution, being roughly 2% near 4 TeV, to 15%.
References
[1] R. M. Harris and K. Kousouris, Searches for dijet resonances at hadron colliders, Int. J. Mod. Phys. A 26 (2011) 5005, arXiv: 1110.5302 [hep-ex].
[2] UA1 Collaboration, C. Albajar et. al.,
Two–jet mass distributions at the CERN proton–antiproton Collider, Phys. Lett. B 209 (1988) 127.
[3] UA2 Collaboration, P. Bagnaia et al.,
Measurement of jet production properties at the CERN p p Collider, ¯ Phys. Lett. B 144 (1984) 283.
[4] CDF Collaboration, T. Aaltonen et al.,
Search for new particles decaying into dijets in proton-antiproton collisions at √
s = 1.96 TeV, Phys. Rev. D 79 (2009) 112002, arXiv: 0812.4036 [hep-ex].
[5] ATLAS Collaboration, Search for new phenomena in dijet mass and angular distributions from pp collisions at √
s = 13 TeV with the ATLAS detector, Phys. Lett. B 754 (2016) 302, arXiv: 1512.01530 [hep-ex].
[6] CMS Collaboration,
Search for narrow resonances decaying to dijets in proton–proton collisions at √
s = 13 TeV, Phys. Rev. Lett. 116 (2016) 071801, arXiv: 1512.01224 [hep-ex].
[7] CDF Collaboration, F. Abe et al.,
Search for new particles decaying to b b in p ¯ p collisions at ¯ √
s = 1.8 TeV, Phys. Rev. Lett. 82 (1999) 2038, arXiv: hep-ex/9809022 [hep-ex].
[8] CMS Collaboration, Search for narrow resonances and quantum black holes in inclusive and b-tagged dijet mass spectra from pp collisions at √
s = 7 TeV, JHEP 01 (2013) 013, arXiv: 1210.2387 [hep-ex].
[9] CMS Collaboration, Search for resonances and quantum black holes using dijet mass spectra in proton-proton collisions at √
s = 8 TeV, Phys. Rev. D 91 (2015) 052009, arXiv: 1501.04198 [hep-ex].
[10] ATLAS Collaboration,
Search for resonances in the mass distribution of jet pairs with one or two jets identified as b-jets in proton–proton collisions at √
s = 13 TeV with the ATLAS detector, Phys. Lett. B 759 (2016) 229, arXiv: 1603.08791 [hep-ex].
[11] CMS Collaboration, Search for narrow resonances in dijet final states at √
s = 8 TeV with the novel CMS technique of data scouting, (2016), arXiv: 1604.08907 [hep-ex].
[12] ATLAS Collaboration, Search for light dijet resonances with the ATLAS detector using a Trigger-Level Analysis in LHC pp collisions at √
s = 13 TeV, ATLAS-CONF-2016-030, 2016, url : http://cds.cern.ch/record/2161135.
[13] ATLAS Collaboration, Search for resonances below 1.2 TeV from the mass distribution of b-jet pairs in proton-proton collisions at √
s = 13 TeV with the ATLAS detector, ATLAS-CONF-2016-031, 2016, url: http://cds.cern.ch/record/2161136.
[14] ATLAS Collaboration,
Optimisation of the ATLAS b-tagging performance for the 2016 LHC Run,
ATL-PHYS-PUB-2016-012, 2016, url : http://cds.cern.ch/record/2160731.
[15] U. Baur, I. Hinchli ff e and D. Zeppenfeld, Excited Quark Production at Hadron Colliders, Int. J. Mod. Phys. A 2 (1987) 1285.
[16] U. Baur, M. Spira and P. M. Zerwas, Excited-quark and -lepton production at hadron colliders, Phys. Rev. D 42 (1990) 815.
[17] P. Langacker, The Physics of Heavy Z
0Gauge Bosons, Rev. Mod. Phys. 81 (2009) 1199, arXiv: 0801.1345 [hep-ph].
[18] C.-W. Chiang, T. Nomura and K. Yagyu,
Phenomenology of E6-inspired leptonphobic Z
0boson at the LHC, JHEP 05 (2014) 106, arXiv: 1402.5579 [hep-ph].
[19] ATLAS Collaboration, The ATLAS Experiment at the CERN Large Hadron Collider, JINST 3 (2008) S08003.
[20] ATLAS Collaboration, ATLAS Insertable B-Layer Technical Design Report, (2010), CERN-LHCC-2010-013, ATLAS-TDR-019,
url : http://cds.cern.ch/record/1291633.
[21] ATLAS Collaboration, ATLAS Insertable B-Layer Technical Design Report Addendum, (2012), CERN-LHCC-2012-009. ATLAS-TDR-19-ADD-1,
url: http://cds.cern.ch/record/1451888.
[22] T. Sjöstrand, S. Mrenna and P. Z. Skands, A Brief Introduction to PYTHIA 8.1, Comput. Phys. Commun. 178 (2008) 852, arXiv: 0710.3820 [hep-ph].
[23] ATLAS Collaboration, ATLAS Run 1 Pythia 8 tunes, ATLAS-PHYS-PUB-2014-021, 2014, url : http://cds.cern.ch/record/1966419.
[24] NNPDF Collaboration, R. D. Ball et al., Parton distributions with LHC data, Nucl. Phys. B 867 (2013) 244, arXiv: 1207.1303 [hep-ph].
[25] D. J. Lange, The EvtGen particle decay simulation package, Nucl. Instrum. Meth. A 462 (2001) 152 .
[26] A. Alloul et al., FeynRules 2.0 - A complete toolbox for tree-level phenomenology, Comput. Phys. Commun. 185 (2014) 2250, arXiv: 1310.1921 [hep-ph].
[27] C. Degrande, Automatic evaluation of UV and R
2terms for beyond the Standard Model Lagrangians: a proof-of-principle, Comput. Phys. Commun. 197 (2015) 239,
arXiv: 1406.3030 [hep-ph].
[28] J. Alwall et al., The automated computation of tree-level and next-to-leading order di ff erential cross sections, and their matching to parton shower simulations, JHEP 07 (2014) 079,
arXiv: 1405.0301 [hep-ph].
[29] ATLAS Collaboration, The ATLAS Simulation Infrastructure, Eur. Phys. J. C 70 (2010) 823, arXiv: 1005.4568 [physics.ins-det].
[30] S. Agostinelli et al., GEANT4: A simulation toolkit, Nucl. Instrum. Meth. A 506 (2003) 250.
[31] A. D. Martin et al., Parton distributions for the LHC, Eur. Phys. J. C 63 (2009) 189, arXiv: 0901.0002 [hep-ph].
[32] ATLAS Collaboration,
Topological cell clustering in the ATLAS calorimeters and its performance in LHC Run 1,
(2016), arXiv: 1603.02934 [hep-ex].
[33] M. Cacciari, G. P. Salam and G. Soyez, The anti-k
tjet clustering algorithm, JHEP 04 (2008) 063, arXiv: 0802.1189 [hep-ph].
[34] ATLAS Collaboration, Jet calibration and systematic uncertainties for jets reconstructed in the ATLAS detector at √
s = 13 TeV, ATL-PHYS-PUB-2015-015, 2015, url : http://cds.cern.ch/record/2037613.
[35] ATLAS Collaboration, Performance of b-Jet Identification in the ATLAS Experiment, JINST 11 (2016) P04008, arXiv: 1512.01094 [hep-ex].
[36] S. S. Wilks,
The large-sample distribution of the likelihood ratio for testing composite hypotheses, Ann. Math. Statist. 9 (1938) 60.
[37] G. Choudalakis, On hypothesis testing, trials factor, hypertests and the BumpHunter, (2011), arXiv: 1101.0390 [physics.data-an].
[38] ATLAS Collaboration, Improved luminosity determination in pp collisions at √
s = 7 TeV using the ATLAS detector at the LHC, Eur. Phys. J. C 73 (2013) 2518,
arXiv: 1302.4393 [hep-ex].
[39] ATLAS Collaboration, Jet energy measurement and its systematic uncertainty in proton–proton collisions at √
s = 7 TeV with the ATLAS detector, Eur. Phys. J. C 75 (2015) 17, arXiv: 1406.0076 [hep-ex].
[40] ATLAS Collaboration,
Commissioning of the ATLAS b-tagging algorithms using t t events in early Run 2 data, ¯ ATL-PHYS-PUB-2015-039, 2015, url: http://cdsweb.cern.ch/record/2047871.
[41] ATLAS Collaboration, Search for New Physics in Dijet Mass and Angular Distributions in pp Collisions at √
s = 7 TeV Measured with the ATLAS Detector, New J. Phys. 13 (2011) 053044,
arXiv: 1103.3864 [hep-ex].
A. Mass spectrum without a signal overlaid
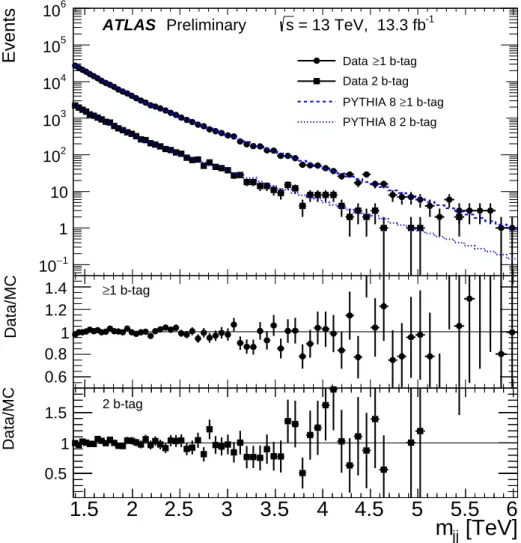
Figure 8 shows the comparison between data and QCD MC.
1500 2000 2500 3000 3500 4000 4500 5000 5500 6000
Events
−1
10 1 10 10
210
310
410
510
61 b-tag
≥ Data Data 2 b-tag
1 b-tag
≥ PYTHIA 8 PYTHIA 8 2 b-tag
= 13 TeV, 13.3 fb
-1s ATLAS Preliminary
1500 2000 2500 3000 3500 4000 4500 5000 5500 6000
Data/MC
0.6 0.8 1 1.2
1.4 ≥ 1 b-tag
[TeV]
m jj
1.5 2 2.5 3 3.5 4 4.5 5 5.5 6
Data/MC
0.5 1
1.5
2 b-tagFigure 8: The dijet mass (m
jj) in the “1b” (circles) and “2b” (square) categories in data compared with P ythia 8
simulation (“1b” blue dashed line, “2b” blue dotted line). The P ythia 8 distributions are normalised to the cor-
responding distributions in data. Ratios between data and simulation are shown in the lower panels. Error bars
indicate statistical uncertainties.
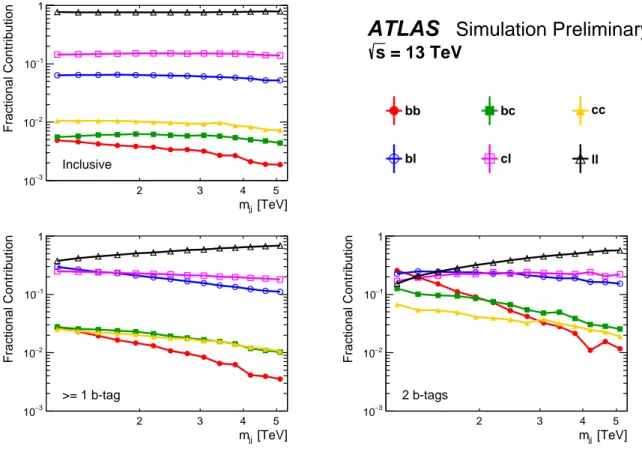
B. Background flavour composition
Figure 9 shows the QCD background flavour composition as a function of the reconstructed mass.
[TeV]
mjj
2 3 4 5
Fractional Contribution
−3
10
−2
10
−1
10 1
Inclusive
bb bc cc
bl cl ll
[TeV]
mjj
2 3 4 5
Fractional Contribution
−3
10
−2
10
−1
10 1
>= 1 b-tag
[TeV]
mjj
2 3 4 5
Fractional Contribution
−3
10
−2
10
−1
10 1
2 b-tags