ATLAS-CONF-2016-047 08August2016
ATLAS NOTE
ATLAS-CONF-2016-047
3rd August 2016
Measurement of the prompt J/ψ pair production cross-section in pp collisions at √
s = 8 TeV with the ATLAS detector
The ATLAS Collaboration
Abstract
The production of two prompt J/ψ mesons with transverse momenta pT > 8.5 GeV and rapidity |y| < 2.1 is studied using a sample of proton-proton collisions at
√s = 8 TeV, corresponding to an integrated luminosity of 11.4 fb−1 collected in 2012 with the ATLAS detector at the LHC. The differential cross-section is measured as a function of the transverse momentum of the lower-pT J/ψ meson, di-J/ψ pT, and di-J/ψ mass, the difference in the rapidity between the two J/ψmesons, and the difference in the azimuthal angle between the two J/ψmesons. The total and double parton cross-sections are compared with predictions.
The fraction of prompt pair events due to double parton scattering is determined by studying kinematic correlations between the two J/ψ mesons. The effective cross-section of double parton scattering is measured to beσeff =8.7±1.1(stat)±1.4(syst)±0.1(BF)±0.3(lumi)mb.
© 2016 CERN for the benefit of the ATLAS Collaboration.
Reproduction of this article or parts of it is allowed as specified in the CC-BY-4.0 license.
1 Introduction
The study of the production of di-J/ψ events offers the opportunity to test our understanding of non- perturbative QCD. These events are also sensitive to next-to-leading-order (NLO) and higher order corrections, in addition to providing an opportunity to study and compare J/ψ production models. The production of di-J/ψevents via double parton scattering presents a unique insight into the structure of the proton. The study of double parton scattering gives a better comprehension of backgrounds to searches such for new phenomena in "Z+4-jets andW+W−+2-jets final states [1–6]. Although the di-J/ψprocess has a low production rate in hadron collisions, the high luminosity and energy of the LHC allows a more detailed study than previously possible [7–14].
The J/ψ meson can be produced promptly or non-promptly through weak decays ofbhadrons [15–21].
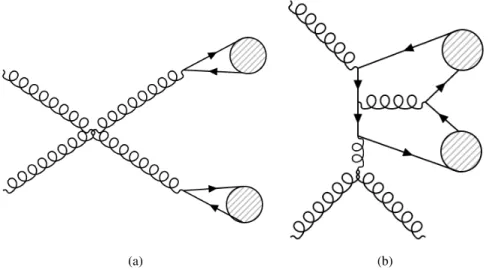
Non-prompt events can be identified by their displaced decay vertex. Prompt production refers to a J/ψ meson that is created directly in proton-proton interactions [22] or via feed-down from a higher mass state, such as χc →J/ψ orψ(2S) →J/ψ. These feed-down events cannot be distinguished from direct gluon-fusion J/ψ production. The focus of this paper is on prompt-prompt (PP) di-J/ψproduction with the decay J/ψ →µ+µ−. This decay channel has the advantage of a clean four-muon signal. Examples of prompt-prompt di-J/ψproduction graphs are shown in Fig.1.
(a) (b)
Figure 1: Examples of Feynman diagrams of prompt-prompt J/ψpair production inppcollisions for(a)leading-order production, where the circles represent acc¯pair in a color octet state, and(b)next-to-leading-order production in which the circle represents the J/ψmeson produced in a color singlet state.
Di-J/ψ events can be produced from a single gluon-gluon collision via single parton scattering (SPS) or from two independent parton-parton scatters in a single proton-proton collision, known as double parton scattering (DPS). Although the SPS is dominant, it is expected that DPS plays a larger role at high energies and could be increasingly important forccc¯ c¯production [23]. DPS is also necessary to explain the cross- section of multi-jet production and the large rapidity1 differences in hard diffraction [24]. As di-J/ψ
1ATLAS uses a right-handed coordinate system where the nominal Interaction Point (IP) is defined as the origin, thez-axis defines the beam direction, and thex−yplane is transverse to the beam direction. The positivex-axis is defined to point from the IP to the center of the LHC ring, and the positivey-axis points upward. The azimuthal angle,φ, is measured around the
production is dominated by gluon interactions, it gives complementary information to recent effective cross-section measurements from quark-dominated interactions. Correlations of non-perturbative origin between the partons can play a role in DPS, and so understanding DPS could lead to a better comprehension of non-perturbative QCD [25].
DPS has been studied in multiple final-states such asγ+3-jets [26],Wv → lν+2-jets [27, 28], and 4- jets [29–32]. Studying di-J/ψevents provides additional information to determine the process dependence of DPS and the effective cross-section. The production of di-J/ψevents via DPS and SPS is described in Refs. [33–37].
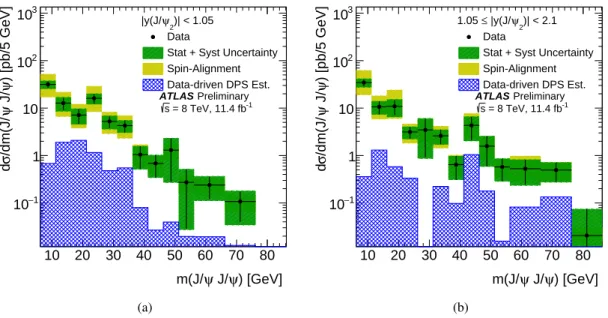
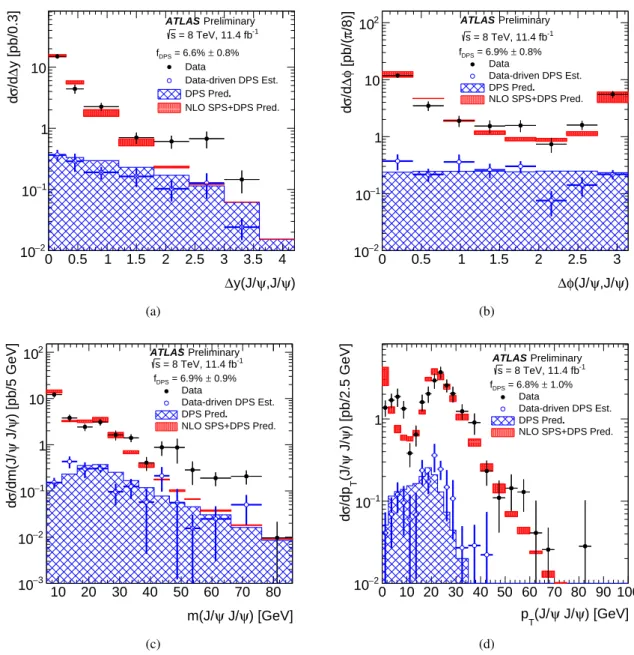
In this paper, the double-differential cross-section for PP J/ψ pairs is measured as a function of the transverse momentum of the lower transverse momentum J/ψ (sub-leading, J/ψ2) meson, the di-J/ψ transverse momentum, and the di-J/ψ mass. Measurements are presented in two regions of the sub- leading J/ψmeson rapidity both within the muon pT acceptance and extrapolated to the full acceptance by integrating the muon transverse momentum to zero. Additionally the differential cross-section over the full J/ψrapidity region within the muon selection criteria is measured for these variables along with the differences in rapidity and the azimuthal angle between the two J/ψ mesons. The sub-leading J/ψmeson is used as it is less likely to fire the trigger used to select events containing J/ψmesons with the di-muon final state and therefore a wider range of the muon volume can be explored. The cross-section is measured in the rapidity regions|y(J/ψ2)| <1.05 and 1.05≤ |y(J/ψ2)| <2.1.
A data-driven method is used to produce background-subtracted SPS-weighted and DPS-weighted dis- tributions of several kinematic variables. The measured distributions are compared with both DPS and NLO SPS predictions in the same fiducial volume. Finally, using the PP di-J/ψcross-section, the fraction of DPS events, and the prompt J/ψcross-section [38], the effective cross-section of DPS is measured and compared to previous measurements.
In an analysis of
√s= 7 TeV 2011 data, the CMS experiment measured the extrapolated prompt J/ψpair production cross-section under the assumption of unpolarized J/ψ mesons[39]. The D0 experiment also measured the fiducial prompt J/ψpair cross-section using data collected at
√s= 1.96 TeV [40]. The preset ATLAS measurement of PP di-J/ψproduction uses a different kinematic range and a larger dataset.
The rest of this document is organized as follows. In Section2a brief description of the ATLAS detector and the samples used in this study is provided. In Section3the methods used in the event reconstruction as well as the selection criteria used in this analysis are reported. Section4focuses on the removal of non-J/ψ, non-prompt J/ψ, and pile-up backgrounds as well as the calculation of the detector and selection efficiencies used in the signal yields. In Section5, double parton scattering and the data-driven method to extract the fraction of DPS events from various kinematic variables are discussed. Section6reports the systematic uncertainties. In Section7the results for the cross-section measurements and DPS study are presented. Finally, in Section8the findings are summarized.
2 ATLAS detector
A full and detailed description of the ATLAS detector can be found in Ref. [41]. The inner detector (ID)is composed of the pixel detector, the semi-conductor tracker (SCT), and the transition radiation tracker
beam axis and the polar angle,θ, is measured from the beam axis. The pseudorapidity is defined asη=−ln[tan(θ/2)] and for massive particles the rapidityy=1/2·ln[(E+pz)/(E−pz)] is used.
(TRT). The pixel and SCT detectors cover a range of|η| <2.5. The barrel is constructed from concentric cylinders around the beam axis and in the end-caps the disks are perpendicular to the beam axis. The TRT is made up of straws filled with gas. It covers a range of|η| ≤ 2.0. The TRT surrounds the SCT and providesR−φinformation as well as electron identification information from transition-radiation photons.
The ID is surrounded by a solenoid which provides a uniform 2 T axial magnetic field. The calorimeter has both electromagnetic and hadronic components. The muon spectrometer (MS) consists of monitored drift tubes (MDT) (|η| ≤ 2.0) and cathode strip chambers (2.0< |η| < 2.7). The Run-1 ATLAS trigger has three levels (Level-1, Level-2, Event Filter) [42]. The Level-1 muon trigger uses information from dedicated muon trigger chambers. Information from the ID and MS is included in the Level-2 and Event Filter triggers.
The dataset used was collected during 2012 at
√s =8 TeV. The total integrated luminosity of the dataset is about 14.1 fb−1 in the corresponding data period and about 11.4 fb−1 after firing the prescaled J/ψ di-muon trigger.
3 Event Reconstruction and Selection
Events are selected that satisfy a J/ψdi-muon trigger requiring two muons withpT>4 GeV and invariant mass 2.5<M(µµ) < 4.3 GeV. Two J/ψcandidates reconstructed through their decay to a pair of oppositely charged muons are required. The reconstruction of the muon tracks is described in Ref. [43]. The muon pairs which make up the J/ψ candidates must have an invariant mass within the range 2.8 ≤ M(µµ) ≤ 3.4 GeV.
The two J/ψ candidates in each event are ordered by transverse momentum. The primary vertex is the reconstructed vertex which is closest to the J/ψ decay vertex along the beam direction. The following kinematic and geometrical requirements on the muons and J/ψmesons were applied:
• |ηµ| <2.3 andpµ
T >2.5 GeV.
• At least one ID track matched to a MS track from each J/ψcandidate.
• |yJ/ψ| <2.1 andpJ/ψ
T >8.5 GeV.
• For the triggered J/ψ, each reconstructed muon must have an ID track matched to a MS track.
• The distance between the two J/ψ decay vertices along the beam direction is required to be,
|dz| <1.2 mm. This is to ensure that the two J/ψmesons come from the same primary vertex.
• The uncertainty of the measurement of decay length,Lxy, which is defined as the signed measured distance in the laboratory frame between the decay vertex and primary vertex in the transverse plane, is required to be less than 0.3 mm.
Although the requirement on |dz| is correlated with the decay length, there is a negligible bias of the measurement for PP signal events due to the narrow dz distribution of prompt J/ψ. This is discussed further in Section6.
A total of 1210 events pass the above selection criteria.
4 Signal Extraction
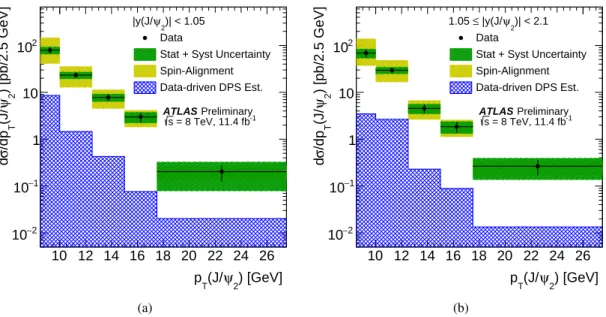
The PP differential cross-section is measured as a function of the pT of the sub-leading J/ψ meson in two rapidity regions based on the sub-leading J/ψ rapidity: the central region, |y(J/ψ2)| <1.05, and the forward region, 1.05≤ |y(J/ψ2)| <2.1.
dσ(pp→J/ψJ/ψ+X)
dx = Ni
sig
ai×i×BF(J/ψ → µ+µ−)2×∆x× L. (1) In this equation the components are reported in the bin,i, of size,∆x, of the kinematic variable x; the number of PP di-J/ψ signal events in the interval, Ni
sig; the kinematic acceptance correction, ai, which is defined as the probability of the J/ψ event to pass the kinematic requirements; the efficiency, i, of the trigger, reconstruction, and selection criteria; the branching fraction of a J/ψ meson to two muons, BF(J/ψ →µ+µ−); and the total integrated luminosity of the dataset,L.
The main sources of background to PP di-J/ψ production are non-J/ψ events, non-prompt J/ψ events, and events containing J/ψmesons originating from two separate proton-proton collisions (called pile-up background). This analysis uses a sequential extraction of the di-J/ψ PP signal. First, each event is weighted by the trigger, reconstruction, kinematic acceptance, and selection correction factors. Next, the mass of the leading J/ψas a function of the mass of the sub-leading J/ψis fitted using probability density functions (PDFs) from maximum likelihood fits [44] to subtract non-J/ψbackground and extract the di-J/ψ signal. The extracted di-J/ψ signal is used to create PP event weights, the probability that the event is prompt-prompt. The extracted di-J/ψ signal is taken in bins of the chosen variable, weighted by the PP event weight and finally the pile-up background is subtracted.
Results are reported for both the fiducial cross-section within the acceptance of the muon requirements as well as that corrected for muons produced outside the muon transverse momentum acceptance. The world-average branching fraction of a J/ψ meson to two muons is used [45], and the total integrated luminosity of the dataset isL = 11.4±0.3 fb−1[46].
4.1 Efficiency and Acceptance
The PP di-J/ψsignal is corrected for the detector, trigger, and event selection efficiencies,iin Eq.1. To obtain the di-muon trigger efficiency, the first step is to calculate and multiply the single muon trigger efficiency of each muon with a correction term that accounts for correlations between the vertex quality and opposite-sign requirements, as well as correcting for configurations in which the muons are too close to each other to be resolved by Level-1 single muon trigger. A further correction is applied to account for a bias due to the use of a highpTmuon tag for the efficiency determination. The correction is determined from maps of the ratio of data to Monte Carlo (MC) simulation using the AU2 tune [47], CTEQ6L1 PDF [48] of Pythia8B [49]. The MC samples were sent through ATLAS detector simulation, and were reconstructed with the same software as the data. Using the single muon trigger efficiencies, the correction term for correlations and the MC correction, the total efficiency for the J/ψdi-muon trigger,Trig, is then calculated using a modified form of the “tag and probe” method presented in Ref. [50].
A correction for the muon reconstruction efficiency is made using the efficiency scale factors described in Ref. [43]. There are two efficiency scale-factor maps. One with and one without a requirement for an ID track that matches the track in the MS. The scale-factors for muons from the triggered J/ψ are taken
from the map that includes ID track-matching. Since the other J/ψmeson only requires one matched track muon, a combination of the two reconstruction maps is used.
A kinematic acceptance factor,ai in Eq.1, is determined from simulation which describes the effect of the muonpTandηcuts in the fiducial region definition, and corrects the cross-section for a J/ψobserved in the J/ψ pT and rapidity fiducial region to the full muon geometric and kinematic region. For this correction the J/ψ is assumed to be unpolarized, as the J/ψ polarization angles were found to be close to zero [51–53].
The final component of the event weight corrections is the signal efficiency of the selection criteria. The dzselection efficiency is 99.9% and 96.9% in the central and forward rapidity regions, respectively. The efficiency of the requirement on the Lxy uncertainty is 91.1% in the central region and 94.5% in the forward rapidity region.
4.2 Non-J/ψBackground
The non-J/ψ background comes mostly from semileptonic decays of bhadrons and from di-muon con- tinuum events from Drell-Yan processes. An unbinned 2-D maximum likelihood fit of the di-muon invariant mass of the leading J/ψ(J/ψ1) as a function of the sub-leading J/ψ(J/ψ2) is used to subtract this background. To parametrize the J/ψsignal a large inclusive J/ψsample selected from the 2012
√s= 8 TeV ATLAS data is used. It has the same selection criteria, fiducial volume, and trigger as the di-J/ψsample.
The J/ψ mass distribution is modeled by a modified double Crystal Ball function (C B) [54–56] and the background is modeled by a first-order polynomial. The modified double Crystal Ball function has a Gaussian core and a power-law low-end and high-end tail that are fixed to have the same rate of decrease.
For the di-J/ψsample the fit allows for the signal parametrized as a product of two CB functions and the background which is assumed to be constant in the 2-D mass space. The values of the CB parameters for each J/ψcandidate are set to the values from the inclusive J/ψ sample in the corresponding rapidity region. The expression for the PDF used to describe the data is:
P=Psig×C B(m(J/ψ1))×C B(m(J/ψ2)) + Pbkg×P0, (2) where Psig is the fraction of events attributed to signal, Pbkg is the fraction of events attributed to background, andP0is a constant. The two J/ψmasses are not expected to be correlated and no evidence of a correlation was observed in the data.
The measured mass and width of the reconstructed J/ψmeson depend onpT (varying by about 3% with pT in the studied region), but in the di-J/ψsample there are not enough events to let the mean and width float free for each bin of the chosen distribution. To account for this effect, a correction as a function of pT is applied to the fit results. The number of J/ψextracted signal events from the fit of the inclusive J/ψ sample with and without a fixed mean and width is calculated as a function ofpT and each J/ψmeson in the di-J/ψsample is weighted by the mass bias correction for the corresponding rapidity region.
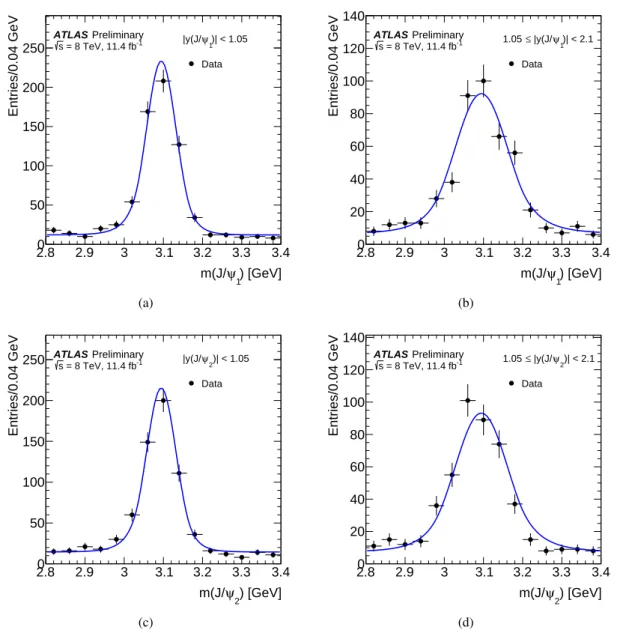
After correcting for the mass bias, the di-J/ψsignal is extracted from the unbinned 2-D maximum likelihood fit ofm(J/ψ1) vsm(J/ψ2). For the extraction of the signal, the data are split into four rapidity regions based on the rapidity of both J/ψmesons. The 1-D projections of the fit onto each J/ψ mass in the central and forward rapidity regions are shown in Fig.2. There are 15000±900 efficiency-corrected di-J/ψsignal
) [GeV]
ψ1
m(J/
2.8 2.9 3 3.1 3.2 3.3 3.4
Entries/0.04 GeV
0 50 100 150 200
250 )| < 1.05
ψ1
|y(J/
Data Preliminary
ATLAS = 8 TeV, 11.4 fb-1
s
(a)
) [GeV]
ψ1
m(J/
2.8 2.9 3 3.1 3.2 3.3 3.4
Entries/0.04 GeV
0 20 40 60 80 100 120 140
)| < 2.1 ψ1
|y(J/
≤ 1.05
Data Preliminary
ATLAS = 8 TeV, 11.4 fb-1
s
(b)
) [GeV]
ψ2
m(J/
2.8 2.9 3 3.1 3.2 3.3 3.4
Entries/0.04 GeV
0 50 100 150 200
250 )| < 1.05
ψ2
|y(J/
Data Preliminary
ATLAS = 8 TeV, 11.4 fb-1
s
(c)
) [GeV]
ψ2
m(J/
2.8 2.9 3 3.1 3.2 3.3 3.4
Entries/0.04 GeV
0 20 40 60 80 100 120 140
)| < 2.1 ψ2
|y(J/
≤ 1.05
Data Preliminary
ATLAS = 8 TeV, 11.4 fb-1
s
(d)
Figure 2: The 1-D projections of the invariant mass spectrum fit of the leading J/ψin the(a)central and(b)forward rapidity regions as well as the sub-leading J/ψin the(c)central and(d)forward rapidity regions. The fits use the parameters derived from the inclusive J/ψsample.
events in the full fiducial volume, the error does not include extrapolations uncertainties to the full phase space.
4.3 Non-prompt Background
After extracting the inclusive di-J/ψsignal, the next step is to extract the PP signal by creating a PP event weight from a fit of the transverse decay length. The distributions of the transverse decay length Lxy
resolution, R, the prompt signal, P, and the non-prompt background, N, are defined as:
R=G1(Lxy)+G2(Lxy)+G3(Lxy)+G4(Lxy) P=δ(Lxy) ⊗R
N=exp(τ,Lxy)⊗R.
(3)
The resolution is modeled by the sum of four Gaussian functions,G, centered at zero. This was determined after a dedicated study of theLxydistribution of the inclusive J/ψsample. The signal is a delta function convoluted with the four-Gaussian resolution, and the background is a single-sided exponential with the slope of the non-prompt exponential,τ, and is convoluted with the four-Gaussian resolution. In the di-J/ψ sample, the PP signal is extracted in four subsamples based on the rapidity of each J/ψmeson. The prompt and non-prompt PDFs are used for both J/ψ, with the values of the prompt PDF parameters set to the values from the inclusive J/ψ sample in the corresponding rapidity region. A 2-D unbinned maximum likelihood fit of the mass is performed in bins ofLxy
1vs. Lxy
2to get the di-J/ψsignal distribution.
In the central-central and forward-forward cases, a single value of the slope of the non-prompt exponential is used to describe both J/ψ candidates. For the mixed cases, the two J/ψ candidates are allowed to have different slopes of the non-prompt exponential. In these cases, the slope of the central-central and forward-forward fits are used as input to the fit of the central and forward J/ψcandidates respectively. A Gaussian penalty with the mean set to the slope of the non-prompt exponential of either the central-central or forward-forward case is applied to the fit of the J/ψ Lxydistribution. The penalty function encourages the slope of the exponential tail of the J/ψ candidate to be about the value of either the central-central or forward-forward case depending on its rapidity. The background subtracted data are then fit with the product of the prompt PDF for both J/ψ mesons and the product of the non-prompt PDF for both J/ψ mesons. The resulting fits are Fig.3. Dividing the PP PDF by the total PDF gives the event weight for PP events as a function of the decay length and rapidity of the two J/ψ mesons. By fitting the PP-weighted mass of J/ψ1 vs. J/ψ2 in bins of the given kinematic variable, the PP di-J/ψ signal distribution of that variable is determined.
Because the 2-D fit of the Lxy1 vs. Lxy2 used to extract the PP weight, is integrated over the pT of each J/ψmeson in the four rapidity cases, there is a possible bias in the extracted differential PP distributions.
To determine this bias and to correct for it, Monte Carlo samples are used. The particle level MC samples were produced using the second hard process mechanism in Pythia8B. These scale-factors are defined as a function of the reconstructed prompt-prompt fraction, fPP.
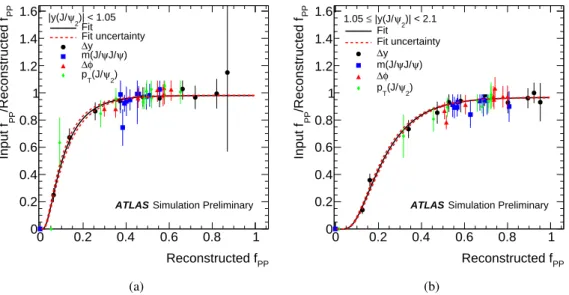
The resulting bias is displayed as a function of the reconstructed fPP and is shown in Fig. 4 for the kinematic variables considered in this analysis. The correction factor is obtained separately for the central and forward rapidity regions of the sub-leading J/ψmeson. The bias ratio is flat over a wide range of the reconstructed fPP and drops quickly at low fPP. It is fitted with a turn-on function defined as 0.5×P×[1- erf(x)], where P is a free parameter and erf(x) is the error function obtained by integrating the normal distribution.
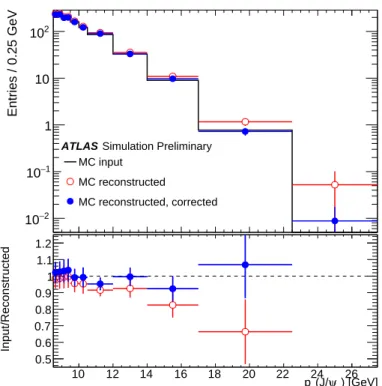
In Fig.5the correction is applied to thepT(J/ψ2) distribution. The original reconstructed distribution is included for comparison. The correction factor is also found to perform well for each of the variables considered. Closure tests of the MC samples were performed.
[mm]
Lxy1
−0.5 0 0.5 1 1.5 2
Entries/0.12 mm
0 20 40 60 80
Data Prompt-Prompt Non-Prompt Central
Preliminary ATLAS -1 = 8 TeV, 11.4 fb s
[mm]
Lxy2
−0.5 0 0.5 1 1.5 2
Entries/0.12 mm
0 20 40 60 80
Central Preliminary
ATLAS -1
= 8 TeV, 11.4 fb s
(a)
[mm]
Lxy1
−0.5 0 0.5 1 1.5 2
Entries/0.12 mm
0 5 10 15 20 25 30 35
Data Prompt-Prompt Non-Prompt Central
Preliminary ATLAS
= 8 TeV, 11.4 fb-1
s
[mm]
Lxy2
−0.5 0 0.5 1 1.5
Entries/0.12 mm
0 5 10 15 20 25 30
35 Forward
Preliminary ATLAS
= 8 TeV, 11.4 fb-1
s
(b)
[mm]
Lxy1
−0.5 0 0.5 1 1.5
Entries/0.12 mm
0 5 10 15 20 25 30 35 40 45
Data Prompt-Prompt Non-Prompt Forward
Preliminary
ATLAS -1
= 8 TeV, 11.4 fb s
[mm]
Lxy2
−0.5 0 0.5 1 1.5 2
Entries/0.12 mm
0 5 10 15 20 25 30 35 40
45 Central
Preliminary
ATLAS -1
= 8 TeV, 11.4 fb s
(c)
[mm]
Lxy1
−0.5 0 0.5 1 1.5
Entries/0.12 mm
0 10 20 30 40 50 60 70
Data Prompt-Prompt Non-Prompt Forward
Preliminary ATLAS
= 8 TeV, 11.4 fb-1
s
[mm]
Lxy2
−0.5 0 0.5 1 1.5
Entries/0.12 mm
0 10 20 30 40 50 60
70 Forward
Preliminary ATLAS
= 8 TeV, 11.4 fb-1
s
(d) Figure 3: The background subtracted decay length spectra, Lxy
1 and Lxy
2, of the leading and sub-leading J/ψ mesons. The data are split into four ranges:(a)central-central,(b) central-forward,(c)forward-central, and(d) forward-forward. The prompt-prompt signal component and the non-prompt background component in the fiducial volume are shown.
4.4 Pile-up Background
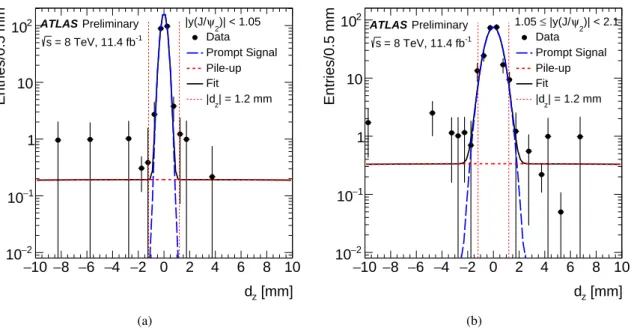
The remaining background comes from pile-up events which are multiple uncorrelated collisions in the same beam crossing. In pile-up events, the two J/ψmesons originate from two independent proton-proton collisions. These events have similar distributions to events from DPS. The requirement on the distance between the trajectories of the two J/ψmesons along the beam direction,|dz| <1.2 mm, is used to remove events that come from two separate primary vertices.
The PP background subtracteddzdistribution is shown in Fig.6. To subtract the pile-up background which passes thedz selection, a Gaussian was used to describe the signal and background using the parameters from the fit of the much wider range from the inclusive J/ψsample. The pile-up background distribution is then integrated within thedzrange.
The amount of pile-up in the accepted sample is found to be fpile−up= 0.466±0.034 (stat)±0.004 (syst)%
Reconstructed fPP
0 0.2 0.4 0.6 0.8 1
PP/Reconstructed f PPInput f
0 0.2 0.4 0.6 0.8 1 1.2 1.4
1.6 )| < 1.05 ψ2
|y(J/
Fit
Fit uncertainty
∆y ψ) ψJ/
m(J/φ
∆
2) ψ
T(J/
p
Simulation Preliminary ATLAS
(a)
Reconstructed fPP
0 0.2 0.4 0.6 0.8 1
PP/Reconstructed f PPInput f
0 0.2 0.4 0.6 0.8 1 1.2 1.4
1.6 )| < 2.1
ψ2
|y(J/
≤ 1.05
Fit
Fit uncertainty
∆y ψ) ψJ/
m(J/φ
∆
2) ψ
T(J/
p
Simulation Preliminary ATLAS
(b)
Figure 4: The PP weight bias as a function of the reconstructed fPPin the(a)central and(b)forward rapidity regions for different variables. The∆ydistribution was used for the fit.
in the central region and fpile−up= 0.802±0.062 (stat)±0.007 (syst)% in the forward region. As a check, the signal PP Gaussian width was allowed to be free in the di-J/ψ dz fit. The width was found to be compatible with the value calculated from the inclusive J/ψ sample but with a much larger uncertainty.
Finally, to remove the pile-up background, the pile-up distributions of the kinematic variables are needed.
This is achieved by modifying the |dz| requirement to |dz| > 2.0 mm. The distribution of the chosen variable with this new requirement is then plotted to get the distributions of events coming from two separate primary vertices. The pile-up distributions are normalized to the correct number of events, nTotal×fpile−up, and subtracted from the PP distributions.
The total number of PP di-J/ψ signal events corrected for the muon acceptance is 3310± 330 (central) and 3140±370 (forward). In the DPS analysis described in Section5, the full muon fiducial volume is used. The number of PP di-J/ψ signal events in the fiducial volume, not corrected for the acceptance, is 1170±70.
5 Double Parton Scattering
Because DPS events occur at large center-of-mass energies and low values of the incoming fraction of the proton momentum carried by a parton, xF, DPS phenomena can be of substantial importance at the LHC. DPS is dependent on the transverse distance between interaction regions, and therefore the DPS cross-section should decrease quickly as a function of transverse energy. Since at the LHC energies, J/ψmeson production is dominated by gluon-gluon interactions, the DPS cross-section is sensitive to the spatial distribution of gluons in the proton [57].
A simplified ansatz for defining the DPS cross-section in terms of the production cross-section of the two final states and an effective cross-section is defined in Ref. [58]. The effective cross-section,σeff, measures the size in impact parameter space of the incident hadron’s partonic core. In the derivation of the
) [GeV]
ψ2 T(J/
p
Entries / 0.25 GeV
−2
10
−1
10 1 10 102
MC input MC reconstructed
MC reconstructed, corrected Simulation Preliminary ATLAS
) [GeV]
ψ2 T(J/
10 12 14 16 18 20 22 p24 26
Input/Reconstructed
0.5 0.6 0.7 0.8 0.9 1 1.1 1.2
Figure 5: A comparison of the PP MC input, MC reconstructed, and MC reconstructed corrected distribution of the sub-leading J/ψpT,pT(J/ψ2). The ratios of the MC input to the MC reconstructed and MC reconstructed corrected distributions are shown.
effective cross-section ansatz, process and energy independence is assumed to first-order approximations.
There are possible correlations between the incoming fractional momenta of the two partons, between the incoming fractional momenta of the partons and the impact parameter, as well as spin and color correlations that are not addressed in this simplified ansatz. These correlations and a modified effective cross-section ansatz which accounts for these possible correlations are described in Ref. [59].
σeff = 1 2
σJ/ψσJ/ψ σJ/ψ,J/ψ
DPS
= 1 2
σJ/ψσJ/ψ
fDPS×σJ/ψJ/ψ. (4)
In Eq.4, fDPSis the fraction of DPS events. The effective cross-section provides a measure of correlation, or “clumpiness”, in the structure of the proton. If the effective cross-section were equal to the inelastic cross-section, it would imply uncorrelated scatterings. The measured values of the effective cross-section from multiple experiments ranges from about 5 to 20 mb [26–28,30,31,60–65] ranging from center-of- mass energies of 630 GeV to 8 TeV. Double J/ψ production has a low production rate and has not been studied in as much detail as other DPS processes. It provides a good test of the process dependence of the effective cross-section.
5.1 Data-Driven Model-Independent Approach
One of the goals of this analysis is to measure the fraction of DPS events, fDPS, as a function of various parameters such as the mass andpTof the di-J/ψ system and the difference in rapidity and the azimuthal
[mm]
dz
−10 −8 −6 −4 −2 0 2 4 6 8 10
Entries/0.5 mm
−2
10
−1
10 1 10
102 )| < 1.05
ψ2
|y(J/
Data Prompt Signal Pile-up Fit
| = 1.2 mm
|dz
Preliminary ATLAS
= 8 TeV, 11.4 fb-1
s
(a)
[mm]
dz
−10 −8 −6 −4 −2 0 2 4 6 8 10
Entries/0.5 mm
−2
10
−1
10 1 10
102 )| < 2.1
ψ2
|y(J/
≤ 1.05
Data Prompt Signal Pile-up Fit
| = 1.2 mm
|dz
Preliminary ATLAS
= 8 TeV, 11.4 fb-1
s
(b)
Figure 6: The distance between the two J/ψ mesons along the beam direction,dz, is fit to determine the fraction of background events in the(a)central and(b)forward rapidity regions. The narrow Gaussian is the prompt J/ψ component and the wider Gaussian is the component due to pile-up. A Gaussian was used to describe the background using the parameters from the fit of the much wider range from the inclusive J/ψsample. (Over the smaller range of the di-J/ψsample, the background distribution appears flat.) As a systematic uncertainty, a uniform distribution is used to describe the background distribution.
angle between the two J/ψmesons in order to probe regions of phase-space that are sensitive to different theoretical contributions. A second goal of this analysis is to determine the di-J/ψ DPS cross-section based on the measurement of fDPS.
A common method for extracting the DPS contribution involves fitting DPS and SPS templates to the data.
The theoretical predictions for the SPS distributions on perturbative QCD corrections of varying orders and on J/ψproduction models [22,66–68]. By forming a template based on data that dependence can be eliminated.
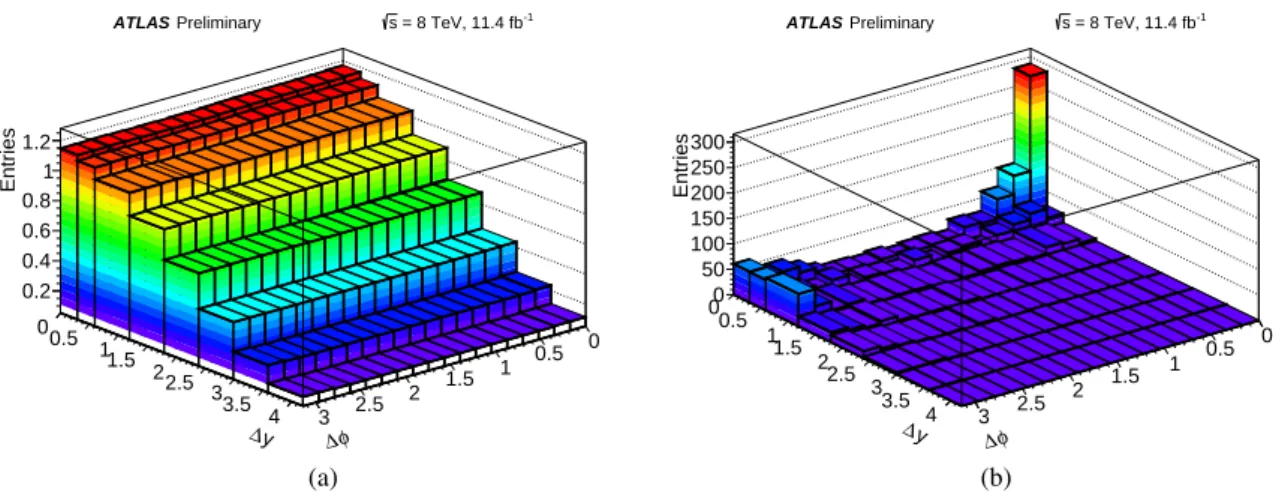
In constructing the data-driven DPS template, the assumption is made that the two J/ψ candidates are produced independently from each other. The DPS sample is therefore simulated by combining re-sampled J/ψmesons from two different random events. The distribution of the absolute difference of the rapidity,
∆y, versus the absolute difference of the azimuthal angle, ∆φ, of the two J/ψ candidates for this DPS sample is shown in Fig.7(a). The template for the SPS component, shown in Fig.7(b), is obtained by subtracting the DPS template from the∆y vs. ∆φ distribution in the data. The DPS contribution is normalized to the data in the region∆y ≥1.8 and∆φ≤ π
2, where DPS is assumed to dominate.
From the 2-D data-driven templates of the SPS and DPS distribution, the DPS and SPS event weights,
∆φ
0.5 0 1.5 1 2.5 2 y 3
∆ 00.5
11.5 22.5 3
3.5 4
Entries
0.2 0.4 0.6 0.8 1 1.2
= 8 TeV, 11.4 fb-1
s Preliminary ATLAS
(a)
∆φ
0.5 0 1.5 1 2.5 2 y 3
∆ 00.5
11.5 22.5
33.5 4
Entries
0 50 100 150 200 250 300
= 8 TeV, 11.4 fb-1
s Preliminary ATLAS
(b)
Figure 7: The 2-D data-driven templates of∆yvs. ∆φfor(a)DPS obtained by combining J/ψpairs from different events and normalizing to the data and(b)SPS obtained by subtracting the normalized DPS template from the data.
The data-driven templates are used to calculate the DPS and SPS event weights.
wDPSandwSPS, are defined in Eq.5.
wDPS(∆φ, ∆y)= NDPS(∆φ, ∆y)
NDPS(∆φ, ∆y)+NSPS(∆φ, ∆y), wSPS(∆φ, ∆y)= NSPS(∆φ, ∆y)
NDPS(∆φ, ∆y)+NSPS(∆φ, ∆y). (5) By applying these weights as well as the PP weight, and then extracting the di-J/ψsignal from the 2-D mass fits in bins of the chosen variable one can extract the PP SPS-weighted and DPS-weighted distributions of the kinematic variables studied.
From these weights, the value of fDPS is determined. These weighted distributions are then compared to the LO DPS + NLO SPS predicted distributions with fDPSfixed to the measured experimental value.
Finally, the effective cross-section is calculated and compared to the current measured values.
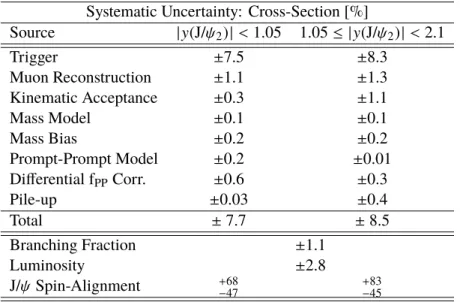
6 Systematic Uncertainties
Sources of systematic uncertainty and their relative percentage are summarized in Table1for the cross- section and Table2for the average fDPSmeasurement. Many of the systematic uncertainties were found to cancel out in the fDPSmeasurement.
Trigger: The systematic due to the trigger selection is determined by creating a thousand Toy MC templates, varying each bin within the statistical uncertainty and determining the effect on the yield.
Additionally the spatial and vertex correction is varied within its uncertainty. Finally, a conservative uncertainty for the MC correction map is determined by calculating the yield without the MC correction.
The conservative approach for the MC correction accounts for the lack of access to equivalent single low pTtriggers in the data as found in the MC.
Muon Reconstruction:The calculation of the systematic uncertainty due to the two muon reconstruction efficiency maps used in the analysis, described in Section 4.1, uses the same Toy MC method as the trigger.
Kinematic Acceptance Due to the fine binning of the maps and the large number of entries in each bin, the systematic uncertainty from the kinematic acceptance map is negligible. Comparing the ratio with and without the acceptance correction for SPS and DPS MC gives the systematic uncertainty for the assumption that acceptance correction can be applied independently for each J/ψ candidate. This assumption affects only SPS production.
Mass Model: To extract signal di-J/ψevents, a fit ofm(J/ψ1) as a function ofm(J/ψ2) is used. The signal parameters are determined from an inclusive J/ψsample in the central and forward rapidity regions. The mass fit parameters are varied within their uncertainties to determine the systematic uncertainty due to the choice of the mass model. It is found to be less than 0.1%.
Mass Bias: The mean and width of the J/ψmass fit are not constant as a function ofpT. The correction for fixing these values is the ratio of the number of J/ψfrom the inclusive J/ψ sample with the mean and width parameters fixed to the number with the mean and width allowed to be free, as a function ofpT. To find the systematic uncertainty of the mass bias correction, the correction is varied within its uncertainties in each bin.
Prompt-Prompt Model: A 2-D fit of the decay length,Lxy, for signal di-J/ψevents is used to extract the PP distributions described in Section4.3. The dependence of the PP model on the resolution function is tested using a three-Gaussian function and assigning the difference with the default model as systematic uncertainty.
Differential fPPCorrection: The correction factor for the differential fPP bias, described in Sec.4.3, is varied to measure the systematic uncertainty. A covariance matrix is used to extract uncertainty on the fit of the bias vs. the measured fPP. The correction factor is varied within the uncertainty and the difference in the nominal final results is taken as the systematic uncertainty of the correction.
Pile-up: The fit of the dz distribution is varied by increasing the pile-up Gaussian width within its uncertainties. As another test, a constant was used instead of a Gaussian function for the pile-up PDF.
Any bias of the requirement of|dz| <1.2 mm on PP events is tested by adding an additional requirement of|dz
0| <√
2×1.2 mm to the inclusive J/ψsample and measuring the difference in the fraction of prompt events.
Branching Fraction and Luminosity: The J/ψ meson to di-muon branching fraction systematic uncer- tainty is taken from the world-average [45] and was varied within the uncertainty. The uncertainty on the integrated luminosity of 2.8% comes from Ref. [46] and is propagated through to the cross-section calculation.
Spin-Alignment: The nominal polarization assumption used in the cross-section measurement assumes an isotropic di-muon distribution for both J/ψ candidates. There are four other extreme cases for the J/ψ spin-alignment, one full longitudinal polarization and three different transverse polarizations. The cross-section measurement is carried out with each spin-alignment and the maximum deviation from the total is assigned as the systematic uncertainty of the J/ψspin-alignment in di-J/ψevents.
DPS Model: The DPS-dominated region of the 2-D map used to create the SPS and DPS event weights, described in Section 5.1, is varied in both ∆φ and ∆y to test the dependence of fDPS on the defined