ATLAS-CONF-2013-042 22/04/2013
ATLAS NOTE
ATLAS-CONF-2013-042
April 20, 2013
Measurement of the production cross section of prompt J/ψ mesons in association with a W
±boson in pp collisions at √
s = 7 TeV
The ATLAS Collaboration
Abstract
The process
pp→W±J/ψprovides a powerful probe of the production mechanism of charmonium in hadronic collisions, and is also sensitive to multiple parton interactions in the colliding protons. Using the 2011 ATLAS dataset of 4.6 fb
−1of
ppcollisions at
√s=
7 TeV, the first observation is made of the production of
W±+ prompt
J/ψevents in hadronic collisions where the
W±boson and the
J/ψboth decay to muons. A total of 29.2
+7.5−6.5W±+prompt
J/ψevents are observed, with a statistical significance of 5.3σ . The production rate as a ratio to the inclusive
W±boson production rate is measured, and the double parton scattering contribution to the cross section is estimated.
c Copyright 2013 CERN for the benefit of the ATLAS Collaboration.
Reproduction of this article or parts of it is allowed as specified in the CC-BY-3.0 license.
Perturbative calculations of heavy quarkonium production in hadron collisions distinguish between terms that produce a heavy quark system (Q Q) in a colour singlet (CS) or a colour octet (CO) state. ¯ The relative importance of these terms for inclusive J/ψ production is a subject of debate [1–7]. Be- cause W
±boson production selects out different partonic initial states than inclusive J/ψ production, the relative contribution of CS and CO processes is different. Previous theoretical studies [8, 9] suggest W
±+prompt J/ψ production should be dominated by colour octet processes, and thus be a distinctive test of the non-relativistic QCD (NRQCD) framework [10, 11]. In contrast, recent work [12] suggests that in 7 TeV pp collisions CO and CS (in particular electromagnetic W
±γ∗→W±J/ψ) contributions to the W
±+prompt J
/ψcross section are comparable. Measurements of the production cross sections can help to distinguish between these models. A search for the related processes W
±+ϒ(1S)and Z
+ϒ(1S),previously performed by the CDF experiment, saw no excess of events above background expectation and set upper limits on the production rate [13].
In addition to the single parton scattering (SPS) reaction studied as a new probe of quarkonium pro- duction, double parton scattering (DPS) interactions [14–18], where the W
±boson and J/ψ are produced in separate parton-parton collisions, can contribute to the total rate for production of a W
±+J/ψfinal state,. These processes will not be distinguishable on an event-by-event basis from SPS processes, but are expected to differ in overall kinematic features such as angular correlations.
Here we report the observation of W
±+prompt J/ψ production in the W
± →µ±ν, andJ/ψ
→ µ+µ−channel. We separate this production mechanism from the backgrounds of multijet production and W
±+ b-hadrons with b
→J/ψX . We do not distinguish J/ψ candidates that are produced in decays of heavier charmonium states (e.g.
χc→γJ/ψ), as long as those states are promptly produced in the hard interaction. W
±+prompt J/ψ events due to DPS are included in the measurement and their contribution to the total rate is estimated. We measure the cross section ratio of W
±+prompt J/ψ production to the inclusive W
±production measured in the fiducial phase space of the W
±boson and J/ψ. We also report the cross section ratio where the J/ψ rate is corrected for the muons which fall out of the detector acceptance in transverse momentum and pseudorapidity for a given J/ψ transverse momentum. This correction depends on the (unknown) spin-alignment of J/ψ produced in association with a W
±boson and so the results are provided for the full envelope of possible spin-alignment scenarios as was previously done for inclusive production measurements [19, 20].
The data used in this analysis were collected by the ATLAS detector during the 2011 proton-proton run of the LHC at center of mass energy 7 TeV, and correspond to an integrated luminosity of 4.6
±0.1 fb
−1[21].
ATLAS is a multi-purpose LHC detector [22, 23] designed to study a variety of phenomena. The in- ner detector (ID) performs tracking of charged particles for
|η|<2.5, surrounded by a superconducting solenoid with a 2 T magnetic field. The calorimeter system covers
|η|<4.9 and detects energy deposits.
The muon spectrometer (MS), outside the calorimeters, measures muon momenta using air-core super- conducting toroidal magnets. A typical muon will traverse three precision position measurement stations for
|η|<2.7. Fast trigger chambers cover
|η|<2.4. The MS has a cylindrical barrel geometry for
|η|.
1 and an endcap disk geometry for
|η|&1. The combination of ID and MS tracking reconstructs muons with p
T&2.5 GeV with resolution
σ(pT)/pTbetter than 3% in the momentum range of interest.
The data were collected using a single muon trigger which required transverse momentum p
T(µ)>18 GeV. Muon candidates are reconstructed either by combining tracks found separately in the ID and MS (“combined” muons), or by extrapolating ID tracks to include hits in the MS (“segment-tagged”
muons). Muon tracks are required to satisfy
|ηµ|<2.5 so as to lie within the angular acceptance of both
the ID and MS. We consider muon candidates with p
T >3.5 (2.5) GeV for
|ηµ|<1.3 (> 1.3). The
candidate hard scattering pp collision vertex is chosen as the reconstructed vertex with the highest
∑p
2Tof associated tracks, and the point of closest approach of muon candidate tracks to this vertex is required
to be within 10 mm along the beam axis (z).
Events are required to have at least three muon candidates to be considered for this analysis. One pair of oppositely-charged muons is required to form a J/ψ candidate, while an additional muon must combine with the event missing transverse energy E
Tmissto form a W
±candidate. The energy imbalance measured by the detector in the transverse plane using the sum of the energy deposited in calorimeter cells and corrected for the presence of well-reconstructed muons, E
Tmiss, is caused by particles escaping detection, such as neutrinos, detector effects, or unaccounted physics processes. The W
±candidate muon is required to match the muon reconstructed by the trigger algorithm used to collect the events.
At least one J/ψ muon must have p
T >4 GeV, and at least one must be a combined muon. A vertex fit is performed to constrain the two muons to originate at a common point. The invariant mass of the dimuon system calculated with track parameters modified by the vertex fit must satisfy 2.5
<m
µ+µ−<3.5 GeV. The J/ψ candidate is required to have transverse momentum p
J/ψTand rapidity y
J/ψ≡tanh
−1(p
J/ψz /EJ/ψ)satisfying p
J/ψT >8.5 GeV and
|yJ/ψ|<2.1; this ensures high acceptance and efficiency for the J/ψ candidate. In addition, as the signal is expected to decrease faster than background with increasing p
J/ψT, we require p
J/ψT <30 GeV to improve the signal to background ratio.
Remaining combined muons are considered as W
±boson decay candidates. These are required to have p
T>25 GeV and
|η|<2.4 in order to be within the acceptance of the trigger. The W
±muon must approach the primary vertex within 1 mm in z. In order to reduce contamination from non-prompt muons produced in heavy flavor decays, we require that the W
±muon must have a transverse impact parame- ter significance d
0/σ(d0)<3, and that it must be isolated. We define calorimetric and track isolation variables by calculating the sum of calorimeter cell E
Tand track p
T, respectively, within a cone of size
p(∆η)2+ (∆φ)2=0.3 around the muon direction. The energy deposit of the muon is subtracted from the calorimetric isolation, and only tracks compatible with originating at the primary vertex and with p
T>1 GeV (excluding the muon itself) are considered for the track isolation. A correction depending on the number of reconstructed vertices is made to the calorimetric isolation to account for additional energy deposits due to pileup vertices. For the muon to be considered isolated, these two variables must both be less than 5% of the muon p
T.
To reconstruct the W
±boson, E
Tmissmust exceed 20 GeV, and the W boson transverse mass m
T(W),defined as
m
T(W)≡ q2 p
T(µ)ETmiss(1−cos(φµ−φν)),(where
φµand
φνrepresent the azimuthal angles of the muon from the W boson decay and the missing transverse energy vector), must exceed 40 GeV. If the invariant mass of the W
±muon candidate and the oppositely-charged J/ψ candidate muon is within 10 GeV of the Z boson mass, the event is vetoed.
After the selection 149 events remain, 78 with
|yJ/ψ| ≤1 and 71 with 1
<|yJ/ψ|<2.1.
We distinguish prompt J/ψ candidates from those originating from b-hadron decay through the separation of the primary vertex and the J/ψ decay vertex. We use the pseudo-proper time
τ≡~
L
·~p
J/ψTp
J/ψT·
m
µ+µ−p
J/ψT,
where
~L is the separation vector of the J/ψ decay vertex from the event primary vertex and m
µ+µ−is the invariant mass of the J/ψ candidate. Prompt J/ψ decays have a pseudo-proper time consistent with zero within resolution. Non-prompt J/ψ decay vertices are displaced from the primary vertex and have positive pseudo-proper time before resolution effects.
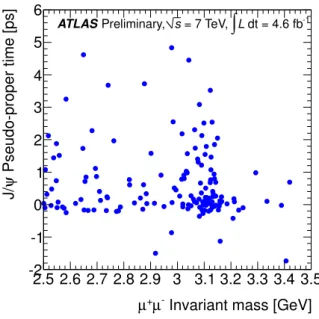
The J/ψ candidate mass and pseudo-proper time distribution is shown in Fig. 1. These data are fit
as follows: first a 2D fit is applied to separate the prompt J/ψ component from the non-prompt J/ψ
component and combinatorial background. This is followed by a fit to the transverse mass computed
from the W
±muon candidate and the E
Tmissto determine the contributions of W
±and multijet background
produced in association with a prompt J/ψ .
Invariant mass [GeV]
µ-
µ+
2.5 2.6 2.7 2.8 2.9 3 3.1 3.2 3.3 3.4 3.5
Pseudo-proper time [ps]ψJ/
-2 -1 0 1 2 3 4 5
6 ATLAS Preliminary, s = 7 TeV,
∫
L dt = 4.6 fb-1Figure 1: Two-dimensional plot of W
±+J
/ψcandidates in pseudo-proper time versus
µ+µ−invariant mass in the whole region in J/ψ rapidity (|y
J/ψ|<2.1). Most of the candidates fall near the J/ψ mass of 3.097 GeV [24] and pseudo-proper time near 0 ps, as expected from prompt J/ψ production.
Invariant mass [GeV]
µ-
µ+
2.5 2.6 2.7 2.8 2.9 3 3.1 3.2 3.3 3.4 3.5
Events / 0.04 GeV
0 10 20 30 40 50 Data
Total ψ W + J/
W + prompt combinatorics W + non-prompt combinatorics
dt = 4.6 fb-1
∫
L = 7 TeV, Preliminary, sATLAS
(a)
Pseudo-proper time [ps]
ψ J/
-1 0 1 2 3 4 5
Events / 0.2 ps
10-1
1 10 102
Data Total
ψ W + prompt J/
ψ W + non-prompt J/
W + prompt combinatorics W + non-prompt combinatorics
dt = 4.6 fb-1
∫
L = 7 TeV, Preliminary, sATLAS
(b)
Figure 2: Projections in (a) invariant mass and (b) pseudo-proper time of the two-dimensional mass- pseudo-proper time fit used to extract the prompt J/ψ candidates in the full rapidity region (|y
J/ψ|<2.1).
The pseudo-proper time distribution is shown for the J/ψ mass peak region (3
<m(µ
+µ−)<3.2 GeV).
An unbinned maximum likelihood fit in J/ψ candidate invariant mass and pseudo-proper time is used to obtain yields for prompt J/ψ, non-prompt J/ψ , and prompt/non-prompt combinatoric back- grounds. In the dimuon mass variable, the probability density functions are Gaussian distributions for J/ψ signal and exponential functions for combinatorial backgrounds. For the candidate pseudo-proper time distribution, the prompt J/ψ and prompt combinatoric background components are modeled by the sum of a Gaussian distribution and a double-sided exponential function convolved with a Gaussian res- olution function, while the non-prompt J/ψ and non-prompt combinatorial background components are modeled by an exponential function (truncated to zero for
τ <0) convolved with a Gaussian resolution function. The parameters that set the shapes of the fit functions, such as the mass and pseudo-proper time resolution, are considered nuisance parameters and are constrained as described below. The functional forms of the probability density functions are:
M
J/ψ(mµ+µ−) =G(m
µ+µ−;m
J/ψPDG,σm)T
promptJ/ψ(τ) =G(τ; 0,σ
τ)⊗(1−
a)δ
(τ) +aN
0e
−|τ|/τ0T
non-promptJ/ψ(τ) =G(τ ; 0,σ
τ)⊗N
1θ(τ)e−τ/τ1M
prompt bkg(mµ+µ−) =N
2e
−mµ+µ−/k0M
non-prompt bkg(mµ+µ−) =N
3e
−mµ+µ−/k1T
prompt bkg(τ) =G(τ ; 0,σ
τ)⊗(1−
b)δ
(τ) +bN
4e
−|τ|/τ0T
non-prompt bkg(τ) =G(τ ; 0,
στ)⊗N
5θ(τ)e−τ/τ2.
In the above, G(x;
µ,σ)is a Gaussian function of x with mean
µand width
σ;
δis the Dirac delta function;
θis the step function; a, b, and the k
iand
τiare shape parameters; and the N
iare appropriate normalization constants. The combined probability density function used for the fit is:
p
=N
promptJ/ψ×M
J/ψ(mµ+µ−)×T
promptJ/ψ(τ) +N
non-promptJ/ψ×M
J/ψ(mµ+µ−)×T
non-promptJ/ψ(τ) +N
prompt bkg×M
prompt bkg(mµ+µ−)×T
prompt bkg(τ) +N
non-prompt bkg×M
non-prompt bkg(mµ+µ−)×Tnon-prompt bkg(τ).
To account for the differences in resolution between the central and endcap detector regions, the fit is performed separately in two regions in absolute J/ψ rapidity,
|yJ/ψ| ≤1 and 1
<|yJ/ψ|<2.1. The fit is initially conducted on an inclusive high-statistics J/ψ sample and the results used to constrain the nuisance parameters. The central values and uncertainties on the nuisance parameters from the inclusive fits are translated into Gaussian constraints on the parameters during the fit to the W
±+J/ψ candidates.
The values of the nuisance parameters estimated from the W
±+prompt J/ψ fits do not differ signifi- cantly from those determined in the inclusive J/ψ sample, and the returned uncertainties are similar to the uncertainty in the constraints. Figure 2(a) shows the mass fit in the full rapidity region (
|yJ/ψ|<2.1), whereas in Fig. 2(b) the pseudo-proper time fit in the J/ψ mass peak region, (3
<m(µ
+µ−)<3.2 GeV), is shown.
A number of possible background contributions to W
±+prompt J/ψ are considered. Top quarks decay predominantly to W
±b, where the b-hadron can further decay to J/ψ plus other particles. t¯ t events are a potential background to this analysis. The selection and fit procedure is applied to simulated t¯ t events, and the expected yield of prompt J/ψ candidates is found to be smaller than 0.28 at 95%
credibility level. Production of W
±+bquark events other than from t t ¯ decay is also considered. The
W Transverse Mass [GeV]
0 20 40 60 80 100120140 160180200
Arbitrary Units
0 0.005 0.01 0.015 0.02 0.025 0.03 0.035 0.04 0.045
dt = 4.6 fb-1
∫L = 7 TeV, Preliminary, s ATLAS
W template multijets template
(a)
W Transverse Mass [GeV]
0 20 40 60 80 100120140 160180200
Events / 20 GeV
0 5 10 15 20 25 30
data ψ W + prompt J/
Fit W multijets
dt = 4.6 fb-1
∫
L = 7 TeV, Preliminary, sATLAS
W+multijets hypothesis
(b)
Figure 3: (a) Unit-normalized templates for W boson transverse mass m
T(W)for multijet background and W
±boson signal. (b) Measured W boson transverse mass distribution for W
±+prompt J/ψ can- didate events with a fit to the W
±boson and multijet components. The fit is performed in the region 40–140 GeV in m
T(W).known ratio of W
±+bto W
±production from ATLAS measurements [25, 26] is found to be consistent with the ratio of W
±+ non-prompt J/ψ to W
±production in this analysis, when the differing phase spaces of the analyses are considered.
The production of Z bosons, followed by the decay Z
→µ+µ−, can produce the signal signature if an additional muon candidate is found. This background is reduced by vetoing events where a pairing of oppositely charged muons has an invariant mass within 10 GeV of the Z boson mass.
Decays of B
c→J/ψ µ
±νXproduce a J/ψ and an additional muon. No candidate events are found to have a three-muon invariant mass below 12 GeV, far above the B
cmass of 6.277 GeV [24].
Multijet production, especially of heavy quark jets, can produce candidates with multiple recon- structed muons and E
Tmisseither due to neutrinos or mismeasurement. We separate this contribution from the real W
±+J/ψ component of the observed events using the W
±boson transverse mass m
Tas a discriminating variable. The sPlot procedure [27] is used to obtain the m
Tdistribution for events containing a prompt J/ψ. The procedure acts as a background subtraction technique that assigns a signal or background weight to each event determined by the probability density functions after a maximum likelihood fit. The projected m
Tdistribution is then fit to a sum of a multijet template and a W
±bo- son signal template (shown in Fig. 3(a)). The multijet background shape in m
Tis estimated using the distribution in events with non-isolated muons, which are dominated by multijet production. The W
±template is obtained from signal simulations. Events were produced by the A
LPGENevent generator [28], interfaced to H
ERWIG[29] for parton showers and hadronization and J
IMMY[30] for simulation of the underlying event. Detector response is modeled using the G
EANT4-based ATLAS full simulation framework [31, 32].
The sPlot-projected m
Tdistribution is fit with the W
±MC and multijet templates. The result of the
χ2fit is shown in Fig. 3(b). The fit strongly supports the W
±hypothesis, estimating 0.1
±4.6 multijet
events in the sample. The fraction of multijet events is smaller than 0.31 at 95% credibility level.
The probability that a W
±candidate and a J/ψ candidate are produced in different proton-proton col- lisions that occur in the same bunch crossing (“pileup”) is estimated as follows. Given the beam condi- tions of the dataset, the mean number of extra collisions within 10 mm of the primary vertex is calculated to be N
extra=0.81
±0.08; this value is computed from the mean number of collisions per proton-proton bunch crossing
µand the geometric parameters of the interaction region. For a
(|yJ/ψ|,p
J/ψT )-bin, theprobability for a J/ψ to be produced in a pp collision in that kinematic bin is determined as
P
J/ψ=σJ/ψbin σinel=
1
σinelZ
bin
d
2σ(pp→J/ψ X) dy d p
Tdy d p
Tusing the double-differential J/ψ production cross sections as measured [19] by ATLAS at
√s
=7 TeV.
The assumed pp inelastic collision cross section
σinelis taken to be 71.5 mb [33]. We define
µ = Lσinel/nbf
r, with
Lbeing the luminosity, n
bthe number of colliding bunch pairs, and f
rthe orbit frequency. Since
Lis determined independently from
σinelusing van der Meer scan calibration [21], we find that
σinelcancels in the overlap probability N
extraP
J/ψ. We estimate a total of 1.8
±0.2 such pileup overlap events. This background is subtracted when the cross section ratios are calculated.
It is possible for the W
±and J/ψ to originate from two different parton interactions in the same proton-proton collision, in a double parton scattering process (DPS). We adopt the standard ansatz in which, for a collision in which a hard process (here W
±production) occurs, the probability that an additional (distinguishable) process (here prompt J/ψ production) occurs is parametrized as
P
J/ψ|W±=σJ/ψ/σe f f.(1)
The effective cross section parameter
σe f fis taken to be 15
±3 (stat.)
+5−3(syst.) mb as measured by AT- LAS for W
±→lν
+2 jet events [34]. The two interactions are treated as independent and uncorrelated.
This procedure relies upon an assumption of factorization between the longitudinal and transverse com- ponents of the double parton distribution functions [18, 35, 36]. The prompt J/ψ cross section from the ATLAS measurement [19] is used, as in the pileup estimation, corrected into the fiducial phase space of this measurement, and accounting for spin-alignment uncertainties that result from the correction. The total number of DPS events in our signal yield is estimated at 10.8
±4.2 events.
A uniform distribution in the azimuthal angle between the W
±and J/ψ momenta is expected from DPS, under the assumption that the two interactions are independent. Simulations in both the color singlet and color octet models predict a distribution strongly peaked near
∆φ=πfor the SPS contribution (with the exact shape dependent on kinematics and the relative size of the underlying contributions). The sPlot distribution of this variable for the data peaks near
πand has a tail extending towards zero, as shown in Fig. 4. This suggests that the observed W
±+prompt J/ψ candidates include both SPS and DPS events. We do not, however, use this distribution to separate SPS and DPS events. Overlaid on Fig. 4 is an estimation of the DPS rate using the previously described ansatz. The determined rate is compatible with the size of the flat component of the observed
∆φdistribution.
Table 1 shows the yields resulting from the 2D fit in each of the two detector regions, barrel (
|yJ/ψ| ≤1.0) and endcap (1
<|yJ/ψ|<2.1), including the statistical uncertainty from the fit for the prompt J/ψ , non-prompt J/ψ and combinatoric background components. The signal significance is calculated using pseudoexperiments in which events conforming with the background-only hypothesis are generated and then fit with the background-only hypothesis and the signal+background hypothesis to extract the likeli- hood ratio between the two hypotheses. The combination of the two regions rejects the background-only hypothesis at 5.3σ .
To determine the ratio of W
±+prompt J/ψ and W
±cross sections, the number of inclusive W
±events is determined from data. We form a sample of W
±candidates by selecting all events that satisfy
the W
±part of the W
±+promptJ/ψ requirements. The Z+jets, t¯ t, and diboson backgrounds to inclusive
ψ ) (W,J/
φ
∆
0 0.5 1 1.5 2 2.5 3
Events / bin
0 5 10 15 20
data ψ W + prompt J/
Estimated DPS contribution
dt = 4.6 fb-1
∫
L = 7 TeV, Preliminary, sATLAS
Figure 4: The sPlot-weighted azimuthal angle between the W
±and the J/ψ is shown for W
±+prompt J/ψ candidates. No efficiency or acceptance corrections are applied. The determined DPS contri- bution (with systematic uncertainties) is overlaid, using a flat DPS template validated using
PYTHIA8 [37]
MC simulation and normalized to the total rate as estimated using the DPS ansatz in Eq. 1. The hashed region shows the uncertainty on the DPS estimate. The
∆φdistribution is not itself used in the estimation of the DPS component of the W
±+prompt J/ψ data.
Yields from two-dimensional fit
Process Barrel Endcap Total
Prompt J/ψ 10.0
+4.7−4.019.2
+5.8−5.129.2
+7.5−6.5Non-prompt J/ψ 27.9
+6.5−5.813.9
+5.3−4.541.8
+8.4−7.3Prompt background 20.4
+5.9−5.118.8
+6.3−5.339.2
+8.6−7.3Non-prompt background 19.8
+5.8−4.919.2
+6.1−5.139.0
+8.4−7.1p-value 1.5
×10
−31.4
×10
−64.4
×10
−8Significance 3.0 4.7 5.3
Table 1: The yields for the prompt J/ψ , non-prompt J/ψ and combinatorial background are shown.
The errors shown include the statistical uncertainties and the systematic uncertainties from the nuisance
parameters of the fit. The significance is calculated using the p-value from pseudoexperiments.
W
±production are estimated from Monte Carlo simulation. The multijet contribution is estimated using the same technique as used for deriving the multijet template for the W
±+prompt J/ψ signal, except that the normalization is also determined by that method instead of being fitted to data. The number of W
±boson candidates is found to be 1.48
×10
7, consistent with next-to-next-to-leading order (NNLO) pQCD predictions [38, 39] and ATLAS detector performance.
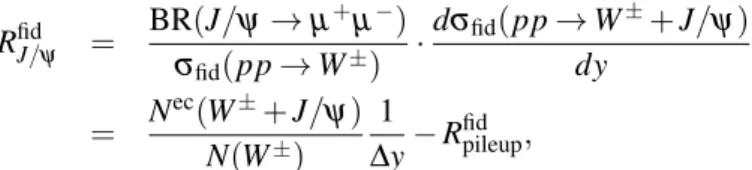
We first define the fiducial cross section ratio R
fidJ/ψ =BR(J/ψ
→µ+µ−)σfid(pp→
W
±) ·dσ
fid(pp→W
±+J/ψ
)dy
=
N
ec(W±+J/ψ
)N(W
±)1
∆y−
R
fidpileup,where N
ec(W±+J/ψ) is the yield of W
±+prompt J/ψ events after correction for the J/ψ muon reconstruction efficiencies, N(W
±)is the background-subtracted yield of inclusive W
±events,
∆y=4.2 is the size of the fiducial region in y
J/ψ, and R
fidpileupis the expected pileup background contribution in the fiducal J/ψ acceptance. For R
fidJ/ψ, we do not correct either for the the incomplete acceptance for J/ψ muons or for the W
±acceptance. Also note that only the cross section for 8.5
<p
J/ψT <30 GeV is considered.
The statistical uncertainties associated with the fit are calculated by fixing the nuisance parameters and performing the fit again. When the nuisance parameters are allowed to float within the Gaussian constraint, the total error on each yield is the quadratic sum of the statistical and systematic errors.
The J/ψ transverse momentum distribution may be different in inclusive J/ψ events and W
±+prompt J/ψ events. Since we use the fit nuisance parameters from the inclusive fit during the W
±+prompt J/ψ fit, this can affect the extracted yields. This is estimated to have an effect of
<1% on the prompt J/ψ yields estimated by the fit. Changing the functional forms of the fit results in changes in the yields of up to 4%, which is taken as a systematic uncertainty.
The efficiency and acceptance of the W
±boson is assumed to be the same for inclusive W
±events and for W
±+J/ψ events in reporting of the central value of the ratio. We estimate the uncertainty due to this assumption by reweighting the W
±transverse momentum spectrum in the simulated inclusive sample to match the observed spectrum from W
±+J/ψ events and noting the change in efficiency. The low p
Tmuon efficiencies are determined with a systematic uncertainty of
≈5%, while the uncertainty due to the muon momentum scale was found to be negligible.
In addition to reporting R
fidJ/ψ, we present results corrected for the fiducial acceptance of the muons from the J/ψ decay, but maintaining the p
Trange:
R
inclJ/ψ =BR(J/ψ
→µ+µ−)σfid(pp→
W
±) ·dσ
(pp
→W
±+J/ψ
)dy
=
N
ec+ac(W±+J/ψ
)N(W
±)1
∆y−
R
pileup,where N
ec+ac(W±+J/ψ
)is the yield of W
±+prompt J/ψ events after both J/ψ muon efficiency corrections and J/ψ acceptance corrections, R
pileupis the expected pileup contribution in the full J/ψ decay phase space, and other variables are as for R
fidJ/ψ. The J/ψ spin-alignment, which determines the angular distribution of the muons from the J/ψ decay and thus modifies the acceptance for the J/ψ to be detected within the fiducial volume, is not known and is dependent on the underlying production mechanism. Five extreme scenarios that bound the possible variation are considered for the acceptance and assigned as a systematic uncertainty.
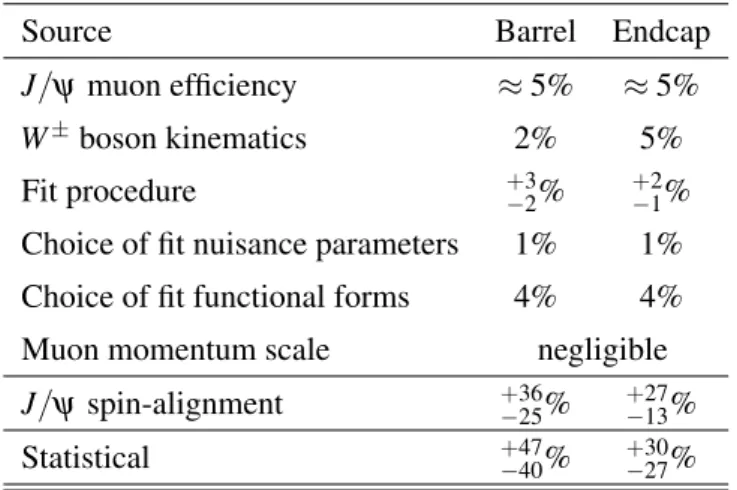
Table 2 summarises the main sources of uncertainties for this analysis. Other uncertainties related to
the E
Tmissscale, luminosity, and the W
±muon cancel in the ratio.
Source Barrel Endcap
J/ψ muon efficiency
≈5%
≈5%
W
±boson kinematics 2% 5%
Fit procedure
+3−2%
+2−1%
Choice of fit nuisance parameters 1% 1%
Choice of fit functional forms 4% 4%
Muon momentum scale negligible
J/ψ spin-alignment
+36−25%
+27−13%
Statistical
+47−40%
+30−27%
Table 2: Summary of the main sources of uncertainty for the measurements of R
fidJ/ψand R
inclJ/ψ; systematic, spin-alignment and statistical uncertainties are shown. Only uncertainties that do not cancel in the ratio of W
±+prompt J/ψ to W
±rates are included.
The isotropic spin-alignment scenario is assumed for the central result. The DPS contribution to R
inclJ/ψis estimated to be
(48±19)
×10
−8. Subtracting the DPS contribution from R
inclJ/ψgives an estimate R
DPS subJ/ψof the single parton scattering rate, which can be directly compared with leading order (LO) colour singlet pQCD predictions [12] and next-to-leading order (NLO) colour octet predictions [9].
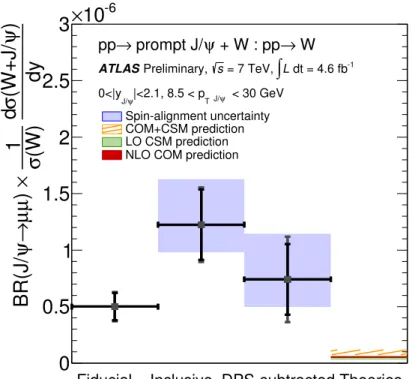
The values of the three measured ratios are shown in Fig. 5 and are:
R
fidJ/ψ = (50±12
±4)
×10
−8R
inclJ/ψ = (123±31
±10
+40−24)×10
−8R
DPS subJ/ψ = (74±31
±21
+40−24)×10
−8,where the first uncertainty is statistical, the second is systematic and the third (where applicable) is the uncertainty due to spin-alignment. The systematic uncertainty on the DPS-subtracted ratio includes the uncertainty on the estimated DPS contribution, which itself includes a separate spin-alignment uncer- tainty.
For comparison of the DPS-subtracted ratio to theory, we normalize the LO colour singlet and NLO
colour octet predictions for W
±+prompt J/ψ [9] to NNLO predictions for the W
±production cross sec-
tion derived from
FEWZ3.1.
B2 [38, 39]. The expected SPS cross section ratio R
DPS subJ/ψfrom normalized
next-to-leading order colour octet calculations is
(4.6−6.2)
×10
−8. The CO predictions do not include
any colour singlet diagrams. The renormalization (µ
R) and factorization (µ
F) scales are set to the W
±boson mass
µR=µF=M
Wand the NRQCD scale
µΛis taken to be
µΛ=m
charm=1.5 GeV. Two sets of
colour octet long-distance matrix elements are used as input parameters to the theory, obtained from two
different parameter fits to experimental data [40, 41], and the variation in the results obtained is assigned
as a systematic uncertainty. The normalized leading order colour singlet model predicts [12] the SPS
ratio to be
(2.8−5.6)
×10
−8for the phase space region considered in this letter. The CS predictions
include only contributions from sg
→J/ψ
+c+Wand q q ¯
0→γ∗W
→J/ψW , but account for the indirect
contribution to the J/ψ rate through decays of the
ψ(2S)by correcting the direct J/ψ rate by the product
of the ratio of the wavefunctions at the origin of the J/ψ and
ψ(2S)with the branching fraction of the
ψ(2S)into J/ψ . The uncertainties on the colour singlet prediction arise from the combined variations of
the charm quark mass in the range m
charm=1.5
±0.1 and independent variation of the factorization and
renormalization scales between 0.75
×µR,Fand 2
×µR,Fof their central value
µR=µF=M
W.
Fiducial Inclusive DPS-subtracted Theories
dy ) ψ (W+J/ σ
d (W) σ 1 × ) µ µ → ψ BR(J/
0 0.5 1 1.5
2 2.5 3
10
-6×
→ W + W : pp ψ
prompt J/
→ pp
dt = 4.6 fb-1
∫
L = 7 TeV, Preliminary, sATLAS
< 30 GeV
ψ TJ/
|<2.1, 8.5 < p
ψ
0<|yJ/
Spin-alignment uncertainty COM+CSM prediction LO CSM prediction NLO COM prediction
Figure 5: The W
±+prompt J/ψ : W production differential cross section ratio in the J/ψ fiducial region (Fiducial), after correction for J/ψ acceptance (Inclusive), and after subtraction of the double- parton scattering component (DPS-subtracted). The shaded band represents the envelope of variation due to different possible spin-alignment configurations. Inner error bars represent statistical uncertainties, outer error bars represent statistical and systematic uncertainties added in quadrature. The LO colour singlet (CSM) and NLO colour octet (COM) predictions for SPS production, and their sum, is shown in comparison.
The leading order CS contributions are approximately equivalent in size to the next-to-leading or- der CO contributions, with the combined CS+CO central value underestimating the measured DPS- subtracted rate by an order of magnitude. This shortfall might be explained by the presence of large higher-order contributions [3] to current calculations (including the contribution of radiative decays from
χcproduction), a possible breakdown of NRQCD universality [5], or contributions from the presence of the intrinsic charm content in the proton [42, 43]. Figure 4 supports the hypothesis of DPS factorization (within current experimental uncertainties), but possible modifications to this formalism may also ex- plain the enhanced measured SPS rate. Nonetheless, large uncertainties on our result imply that current predictions for SPS production are compatible with the measurement at the 2 sigma level.
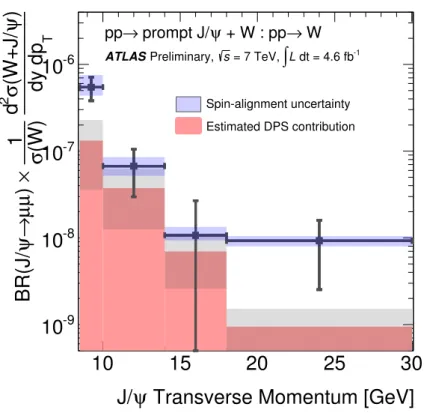
Figure 6 shows the distribution of the differential cross section ratio dR
inclJ/ψ/d pTas a function of p
J/ψT, with an estimation of the differential DPS contribution. The data suggest that the SPS is the dominant contributor to the total rate at low J/ψ transverse momenta.
In summary, we present an observation of W
±+prompt J/ψ production in pp collisions at 5.3σ
significance. We additionally report the fiducial cross section ratio of W
±+ prompt J/ψ production
relative to inclusive W
±production in the same phase space along with the acceptance-corrected ob-
served ratio R
inclJ/ψfor the isotropic spin-alignment scenario. We estimate the contribution to the total
W
±+prompt J/ψ rate arising from double parton scattering contributions, under the assumption that
Transverse Momentum [GeV]
ψ J/
10 15 20 25 30
T
dy dp ) ψ (W+J/ σ
2d (W) σ 1 × ) µ µ → ψ BR(J/
10
-910
-810
-710
-6→ W + W : pp ψ
prompt J/
→ pp
dt = 4.6 fb-1
∫
L = 7 TeV, Preliminary, sATLAS
Spin-alignment uncertainty Estimated DPS contribution
Figure 6: The inclusive (SPS+DPS) cross section ratio dR
inclJ/ψ/d pTis shown as a function of J/ψ transverse momentum. The shaded uncertainty corresponds to the variations due to the various spin- alignment scenarios. The DPS estimate is also shown for comparison, with the uncertainty again shown by a shaded region.
the W
±and J/ψ production factorize completely. This gives a rate that is a large fraction of the observed
signal. The azimuthal separation between the produced W
±and J/ψ suggests the presence of both SPS
and DPS contributions, but further study will be necessary to directly determine the relative rates. This
final state may prove to be a compelling observable for study of double parton scattering dynamics at low
Bjorken x in the future. Finally, we compare the DPS-subtracted rate against LO colour singlet and NLO
colour octet predictions, finding the predicted rate to be low, leaving open the possibility for additional
contributions to the observed rate in data.
References
[1] Quarkonium Working Group, N. Brambilla et al., arXiv:hep-ph/0412158 [hep-ph].
[2] N. Brambilla, S. Eidelman, B. Heltsley, R. Vogt, G. Bodwin, et al., Eur. Phys. J.
C71(2011) 1534, arXiv:1010.5827 [hep-ph].
[3] J. Lansberg, Eur. Phys. J.
C61(2009) 693–703, arXiv:0811.4005 [hep-ph].
[4] M. Butenschoen and B. A. Kniehl, Phys. Rev.
D84(2011) 051501, arXiv:1105.0820 [hep-ph].
[5] M. Butenschoen and B. A. Kniehl, Mod. Phys. Lett. A, Vol. 28, No.
9(2013) 1350027, arXiv:1212.2037 [hep-ph].
[6] S. Baranov, A. Lipatov, and N. Zotov, Phys. Rev.
D85(2012) 014034, arXiv:1108.2856 [hep-ph].
[7] Y.-Q. Ma, K. Wang, and K.-T. Chao, Phys. Rev.
D84(2011) 114001, arXiv:1012.1030 [hep-ph].
[8] B. A. Kniehl, C. P. Palisoc, and L. Zwirner, Phys. Rev.
D66(2002) 114002, arXiv:hep-ph/0208104 [hep-ph].
[9] G. Li, M. Song, R.-Y. Zhang, and W.-G. Ma, Phys. Rev.
D83(2011) 014001, arXiv:1012.3798 [hep-ph].
[10] W. Caswell and G. Lepage, Phys. Lett.
B167(1986) 437.
[11] G. T. Bodwin, E. Braaten, and G. P. Lepage, Phys. Rev.
D51(1995) 1125–1171, arXiv:hep-ph/9407339 [hep-ph].
[12] J. P. Lansberg and C. Lorce, (2013), arXiv:1303.5327 [hep-ph].
[13] CDF Collaboration Phys. Rev. Lett.
90(2003) 221803.
[14] N. Paver and D. Treleani, Nuovo Cim.
A70(1982) 215.
[15] T. Sjostrand and P. Z. Skands, JHEP
0403(2004) 053, arXiv:hep-ph/0402078 [hep-ph].
[16] V. Korotkikh and A. Snigirev, Phys. Lett.
B594(2004) 171–176, arXiv:hep-ph/0404155 [hep-ph].
[17] J. R. Gaunt and W. J. Stirling, JHEP
1003(2010) 005, arXiv:0910.4347 [hep-ph].
[18] P. Bartalini, E. Berger, B. Blok, G. Calucci, R. Corke, et al., arXiv:1111.0469 [hep-ph].
[19] ATLAS Collaboration, Nucl. Phys.
B850(2011) 387–444, arXiv:1104.3038 [hep-ex].
[20] ATLAS Collaboration, Phys. Rev.
D87(2013) 052004, arXiv:1211.7255 [hep-ex].
[21] ATLAS Collaboration, arXiv:1302.4393 [hep-ex]. submitted to Eur. Phys. J. C.
[22] ATLAS Collaboration, JINST
3(2008) S08003.
[23] ATLAS uses a right-handed coordinate system with its origin at the nominal interaction point (IP) in the centre of the detector and the z-axis along the beam pipe. The x-axis points from the IP to the centre of the LHC ring, and the y-axis points upward. Cylindrical coordinates (r,φ) are used in the transverse plane,
φbeing the azimuthal angle around the beam pipe. The pseudorapidity is defined in terms of the polar angle
θas
η=−ln tan(θ/2). The distance∆Rin
η−φspace is defined as
∆R= p∆η2+∆φ2
.
[24] Particle Data Group, J. Beringer et al., Phys. Rev.
D86(2012) 010001.
[25] ATLAS Collaboration, Phys. Rev.
D85(2012) 072004, arXiv:1109.5141 [hep-ex].
[26] ATLAS Collaboration, Phys. Lett.
B707(2012) 418–437, arXiv:1109.1470 [hep-ex].
[27] M. Pivk and F. R. Le Diberder, Nucl. Instrum. Meth.
A555(2005) 356–369, arXiv:physics/0402083 [physics.data-an].
[28] M. L. Mangano, M. Moretti, F. Piccinini, R. Pittau, and A. D. Polosa, JHEP
0307(2003) 001, arXiv:hep-ph/0206293 [hep-ph].
[29] G. Corcella, I. Knowles, G. Marchesini, S. Moretti, K. Odagiri, et al., JHEP
0101(2001) 010, arXiv:hep-ph/0011363 [hep-ph].
[30] J. Butterworth, J. R. Forshaw, and M. Seymour, Z. Phys.
C72(1996) 637–646, arXiv:hep-ph/9601371 [hep-ph].
[31] GEANT4, S. Agostinelli et al., Nucl. Instrum. Meth.
A506(2003) 250–303.
[32] ATLAS Collaboration, Eur. Phys. J.
C70(2010) 823–874, arXiv:1005.4568 [physics.ins-det].
[33] ATLAS Collaboration, Eur. Phys. J.
C71(2011) 1630, arXiv:1101.2185 [hep-ex].
[34] ATLAS Collaboration, New J. Phys.
15(2013) 033038, arXiv:1301.6872 [hep-ex].
[35] M. Diehl and A. Schafer, Phys. Lett.
B698(2011) 389–402, arXiv:1102.3081 [hep-ph].
[36] J. R. Gaunt and W. J. Stirling, JHEP
1106(2011) 048, arXiv:1103.1888 [hep-ph].
[37] T. Sjostrand, S. Mrenna, and P. Z. Skands, Comput. Phys. Commun.
178(2008) 852–867, arXiv:0710.3820 [hep-ph].
[38] R. Gavin, Y. Li, F. Petriello, and S. Quackenbush, Comput. Phys. Commun.
182(2011) 2388–2403, arXiv:1011.3540 [hep-ph].
[39] R. Gavin, Y. Li, F. Petriello, and S. Quackenbush, arXiv:1201.5896 [hep-ph].
[40] M. Butenschoen and B. A. Kniehl, Nucl. Phys. Proc. Suppl.
222-224(2012) 151–161, arXiv:1201.3862 [hep-ph].
[41] K.-T. Chao, Y.-Q. Ma, H.-S. Shao, K. Wang, and Y.-J. Zhang, Phys. Rev. Lett.
108(2012) 242004, arXiv:1201.2675 [hep-ph].
[42] S. Brodsky, P. Hoyer, C. Peterson, and N. Sakai, Phys. Lett.
B93(1980) 451–455.
[43] R. Vogt and S. Brodsky, Phys. Lett.
B349(1995) 569–575, arXiv:hep-ph/9503206 [hep-ph].
[44] J. Alwall, P. Demin, S. de Visscher, R. Frederix, M. Herquet, et al., JHEP
0709(2007) 028, arXiv:0706.2334 [hep-ph].
[45] P. Artoisenet, F. Maltoni, and T. Stelzer, JHEP
0802(2008) 102.
A Appendix
This appendix includes additional plots and tables as follows:
1. Event displays for W
±+prompt J/ψ candidates 2. Low-p
Tmuon reconstruction efficiency maps
3. J/ψ acceptance maps (for fiducial to inclusive correction)
4.
∆φ(W,J/ψ) templates for Single Parton Scattering and Double Parton Scattering processes 5. Fiducial differential cross-section ratio
6. Profile likelihood for prompt J/ψ yield
Figure 7: The main event display for event 11053516 in run 191513 shows the two J/ψ muons at the 9
o’clock position, the W muon at 6 o’clock, and E
Tmissin the direction of 12 o’clock, opposite from the
W muon. In the bottom display, the J/ψ muons are on the left side, while the W muon is on the right
side. The W muon has transverse momentum 39 GeV, E
Tmissis 56 GeV and the m
T(W)is 93 GeV. The
J/ψ muons have transverse momentum 5.5 and 4.1 GeV and their invariant mass is 3.04 GeV. The J/ψ
transverse momentum is 9.3 GeV, while the J/ψ pseudo-proper time is 0.0 ps.
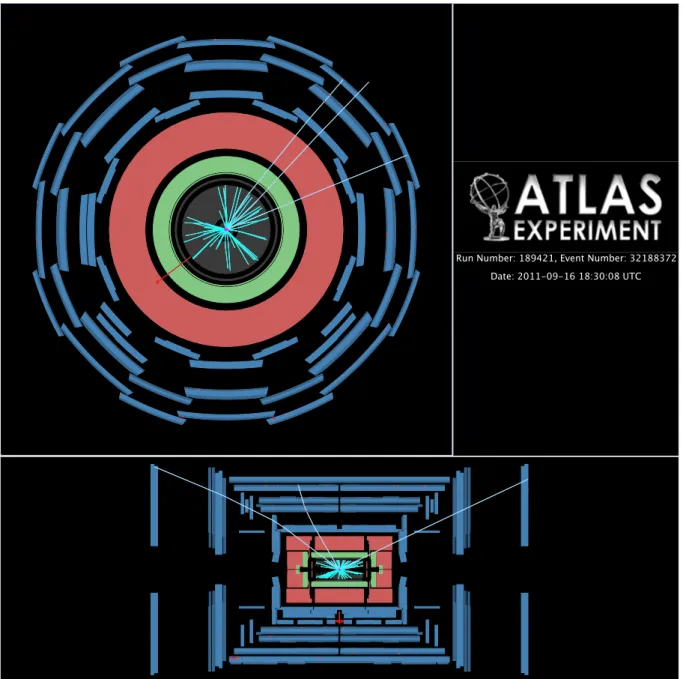
Figure 8: The main event display for event 321883372 in run 189421 shows the two J/ψ muons at the
1 o’clock position, the W muon at 2 o’clock, and E
Tmissin the direction of 9 o’clock, opposite from the
W muon. In the bottom display, the J/ψ muons are on the left side, while the W muon is on the right
side. The W muon has transverse momentum 42 GeV, E
Tmissis 24 GeV and the m
T(W)is 62 GeV. The
J/ψ muons have transverse momentum 4.9 and 4.7 GeV and their invariant mass is 3.08 GeV. The J/ψ
transverse momentum is 9.4 GeV, while the J/ψ pseudo-proper time is -0.1 ps.
Muon charge-signed pseudorapidity -2.5 -2 -1.5 -1-0.5 0 0.5 1 1.5 2 2.5 [GeV] TMuon p
5 10 15 20 25
Muon reconstruction efficiency
0 0.1 0.2 0.3 0.4 0.5 0.6 0.7 0.8 0.9 1
Preliminary, Simulation ATLAS
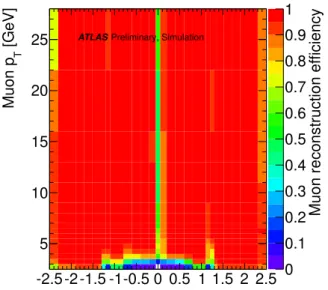
Figure 9: The muon efficiency map used to apply the efficiency corrections, derived from simulation.
Both “combined” and “segment-tagged” muons were considered.
0 0.1 0.2 0.3 0.4 0.5 0.6 0.7 0.8 0.9 1
rapidity J/ψ
0 0.5 1 1.5 2 2.5
[GeV] T pψJ/
0 10 20 30 40 50 60 70 80 90 100
Isotropic acceptance Isotropic acceptance
Preliminary, Simulation ATLAS
0 0.1 0.2 0.3 0.4 0.5 0.6 0.7 0.8 0.9 1
rapidity J/ψ
0 0.5 1 1.5 2 2.5
[GeV] T pψJ/
0 10 20 30 40 50 60 70 80 90 100
Longitudinal acceptance Longitudinal acceptance
Preliminary, Simulation ATLAS
0 0.1 0.2 0.3 0.4 0.5 0.6 0.7 0.8 0.9 1
rapidity J/ψ
0 0.5 1 1.5 2 2.5
[GeV] T pψJ/
0 10 20 30 40 50 60 70 80 90 100
Transverse 0 acceptance Transverse 0 acceptance
Preliminary, Simulation ATLAS
0 0.1 0.2 0.3 0.4 0.5 0.6 0.7 0.8 0.9 1
rapidity J/ψ
0 0.5 1 1.5 2 2.5
[GeV] T pψJ/
0 10 20 30 40 50 60 70 80 90 100
Transverse P acceptance Transverse P acceptance
Preliminary, Simulation ATLAS
0 0.1 0.2 0.3 0.4 0.5 0.6 0.7 0.8 0.9 1
rapidity J/ψ
0 0.5 1 1.5 2 2.5
[GeV] T pψJ/
0 10 20 30 40 50 60 70 80 90 100
Transverse M acceptance Transverse M acceptance
Preliminary, Simulation ATLAS
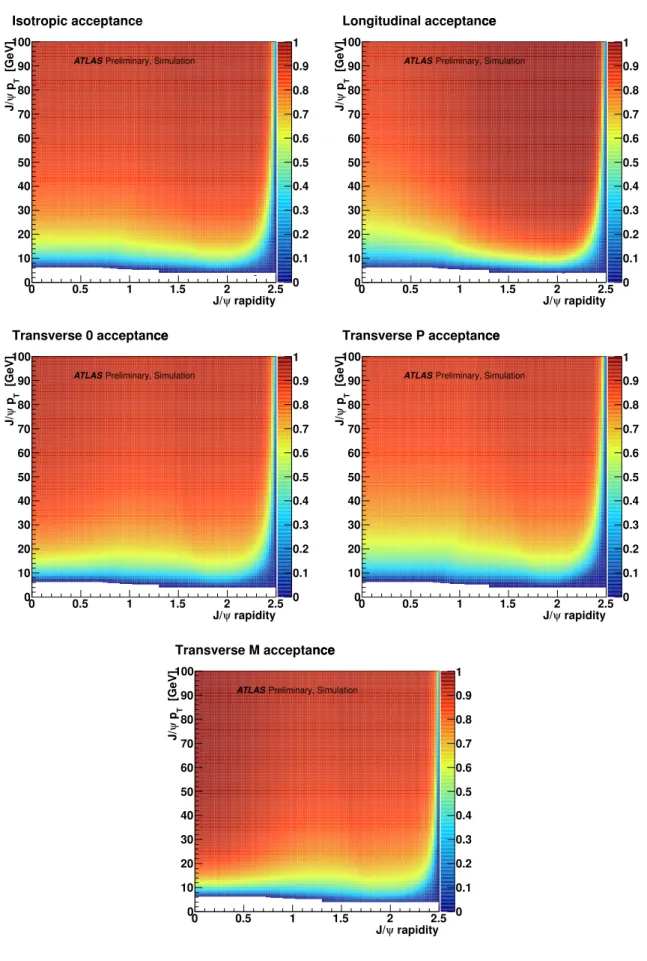
Figure 10: The J/ψ acceptance map used to apply the acceptance corrections for the isotropic spin-
alignment scenario is shown, in addition to the J/ψ acceptance maps for four extreme spin-alignment
ψ) (W,J/
φ
∆
0 0.5 1 1.5 2 2.5 3
Arbitrary Units
0 0.1 0.2 0.3 0.4 0.5 0.6 0.7
Preliminary, Simulation ATLAS
SPS template (MadGraph COM NLO) DPS template (flat)
Figure 11: The azimuthal angle between the W
±and the J/ψ is shown for the DPS contribution using a flat DPS template validated using
PYTHIA8 [37] MC simulation. The SPS contribution is simulated with the NLO Color Octet Model by M
ADG
RAPH[44, 45], and the exact shape is very model-dependent.
Transverse Momentum [GeV]
ψ J/
10 15 20 25 30
Tdy dp)ψ(W+J/σ2
d (W)σ1 ×) µµ→ψBR(J/
10-9
10-8
10-7
10-6
W, Fiducial
→ + W : pp ψ prompt J/
→ pp
dt = 4.6 fb-1
∫L = 7 TeV, Preliminary, s
ATLAS
Figure 12: The fiducial cross-section ratio dR
fidJ/ψ/d pTbefore J/ψ acceptance corrections are applied, as
a function of J/ψ tranverse momentum. Muon efficiency corrections are applied.
ψ Number of prompt J/
0 2 4 6 8 10 12 14 16 18 20
log(L)∆Projection of -2
0 1 2 3 4 5 6 7 8 9 10
<1
ψ
, 0<|y|J/
dt = 4.6 fb-1
∫L = 7 TeV, Preliminary, s ATLAS
constraints Fit from inclusive, 1 σ
results, fixed σ Fit at 1
ψ Number of prompt J/
0 5 10 15 20 25 30 35 40
log(L)∆Projection of -2
0 5 10 15 20 25 30
<2.1
ψ
, 1<|y|J/
dt = 4.6 fb-1
∫L = 7 TeV, Preliminary, s ATLAS
constraints Fit from inclusive, 1 σ
results, fixed σ Fit at 1