ATLAS-CONF-2015-023 08/09/2015
ATLAS NOTE
ATLAS-CONF-2015-023
29th June 2015 Revision: 6th September 2015
Study of J/ψ and ψ(2S) production in √
s
NN= 5.02 TeV p + Pb and
√ s = 2.76 TeV pp collisions with the ATLAS detector
The ATLAS Collaboration
Abstract
Measurements of J/ψ and ψ(2S) production in proton-lead collisions at proton-nucleon center-of-mass energy of √
s
NN= 5.02 TeV and in proton-proton collisions at center-of- mass energy of √
s = 2.76 TeV are presented. The measurements are based on data recorded in 2013 with the ATLAS detector, corresponding to integrated luminosities of 28.1 nb
−1and 4.0 pb
−1in p +Pb and pp, respectively. Measurements of differential cross sections and nu- clear modification factors are presented for the di-muon decay channel in the center-of-mass rapidity interval −1.5 < y
∗µµ< 1.5, over the range 8.5 < p
µµT< 30 GeV.
Revised Figure 3, Figure 7 and Figure 8 using correct preliminary 7 and 8 GeV pp
collision data and updated reference [41] with respect to the version of June 29, 2015
1 Introduction
Intense theoretical and experimental efforts have been deployed in the field of ultra-relativistic heavy ion physics [1, 2] since Matsui and Satz first suggested that charmonia, bound states of c and ¯ c quarks, could be an ideal probe to study the strongly coupled deconfined Quark Gluon Plasma (QGP) created in nucleus- nucleus (A+A) collisions [3]. A measurement of the suppression of charmonium yields would provide direct experimental signatures of QGP formation in high energy nuclear collisions. The suppression of charmonium states can be quantified by the so-called nuclear modification factor:
R
AA= N
AAhT
AAi × σ
pp, (1)
where N
AAis the per-event yield of charmonium states measured in A+A collisions, hT
AAi is the mean nuclear thickness function and σ
ppis the cross section of the corresponding charmonium states in pp collisions at the same energy.
However, before using charmonium yields in A+A collisions relative to pp collisions as a probe to study QGP, it is important to measure the charmonium production in proton (deuteron)-nucleus (p(d) + A) col- lisions. Charmonium suppression has also been observed in p(d) + A interactions [4–7]. This is ascribed to the so-called Cold Nuclear Matter (CNM) effects. The nuclear modification factor defined for A+A collisions in Eq 1, may also be defined for p + A collisions and used to study CNM e ff ects. Among the CNM e ff ects, parton energy loss due to medium-induced gluon radiation and modifications of nuclear parton distribution functions (nPDFs) in nuclei are considered as initial state effects. On the other hand, absorption of the c¯ c pair after it has traversed the nuclear medium is considered as a final state effect.
Measurements of J/ψ and ψ(2S) production in p + A collisions coming from fixed target experiments like E866 [8] and HERA-B [9] show significant suppression of both J/ψ and ψ(2S) mesons. The PHENIX experiment at RHIC has presented results on ψ(2S) suppression at mid-rapidity for d + Au interactions at center-of-mass energy per nucleon-nucleon interaction √
s
NN= 200 GeV, showing that the ψ(2S) to the J/ψ modification factor ratio is smaller than one, decreasing from peripheral to central collisions [10].
At the LHC, inclusive J/ψ [11] and ψ(2S) [12] production has been measured with the ALICE detector in p + Pb collisions at √
s
NN= 5.02 TeV. The latter similarly shows a significantly larger suppression of the ψ(2S) compared to that of the J/ψ. The J/ψ forward (proton direction) to backward (heavy-ion direction) production ratio, R
FB, has recently been measured with the ATLAS detector in p + Pb collisions at √
s
NN= 5.02 TeV [13]. No obvious p
Tand rapidity dependence of R
FBhas been observed.
This note presents the measurements of prompt and non-prompt differential production cross sections and nuclear modification factors, R
pPb, of the J/ψ and ψ(2S). The measurements are performed in the di- muon decay channel in p +Pb collisions at √
s
NN= 5.02 TeV, with an integrated luminosity of 28.1 nb
−1, and in pp collisions at √
s = 2.76 TeV, with an integrated luminosity of 4.0 pb
−1. The data are taken from 2013 LHC p + Pb and pp runs. The measurements are presented for: 8.5 < p
µµT< 30 GeV in transverse momentum, −1.5 < y
∗µµ< 1.5 in center-of-mass rapidity of the proton-nucleon system.
In order to calculate R
pPb, pp cross sections at 5.02 TeV are interpolated from measurements made at 7 and 8 TeV [14] and 2.76 TeV presented in this note. In addition to enabling the interpolation, the data at √
s = 2.76 TeV also provide a further test of theoretical calculations for charmonium production. To
compare measurements of J/ψ and ψ(2S) among different experiments, with different colliding particles
and phase spaces, it is useful to use the double ratio, defined as: R (ψ(2S))/R (J/ψ).
2 ATLAS detector
The ATLAS detector [15] at the LHC covers nearly the entire solid angle around the collision point.
1It consists of an inner tracking detector surrounded by a thin superconducting solenoid, electromagnetic and hadronic calorimeters, and a muon spectrometer incorporating three large superconducting toroid magnets with eight coils each.
The inner-detector system (ID) is immersed in a 2 T axial magnetic field and provides charged particle tracking in the range |η| < 2.5. The high-granularity silicon pixel detector covers the vertex region and typically provides three measurements per track, the first hit being typically expected in the innermost layer. It is followed by the semiconductor microstrip tracker which usually provides four two-dimensional measurement points per track. These silicon detectors are complemented by a transition radiation tracker, which enables radially extended track reconstruction up to |η| = 2.0.
The calorimeter system covers the pseudorapidity range |η| < 4.9. Within the region |η| < 3.2, electro- magnetic calorimetry is provided by barrel and endcap high-granularity lead/liquid-argon (LAr) electro- magnetic calorimeters, with an additional thin LAr presampler covering |η| < 1.8, to correct for energy loss in material upstream of the calorimeters. Hadronic calorimetry is provided by a steel / scintillating- tile calorimeter, segmented into three barrel structures within |η| < 1.7, and two copper/LAr hadronic endcap calorimeters. The solid angle coverage is completed with forward copper / LAr and tungsten / LAr calorimeter (FCal) modules optimised for electromagnetic and hadronic measurements, respectively.
The muon spectrometer (MS) comprises separate trigger and high-precision tracking chambers measuring the deflection of muons in a magnetic field generated by superconducting air-core toroids. The precision chamber system covers the region |η| < 2.7 with three layers of monitored drift tubes (MDT), comple- mented by cathode strip chambers (CSC) in the forward region, where the background is the highest. The muon trigger system covers the range |η| < 2.4 with resistive plate chambers (RPC) in the barrel, and thin gap chambers (TGC) in the endcap regions.
The minimum-bias trigger scintillator (MBTS) counters are two identical detectors located on both sides of the interaction point along the beam line, at a distance of 3.56 m. They cover 2.1 < |η| < 3.9 on each side. Each MBTS counter consists of 16 scintillators. The signals from the pads were used as an input to the trigger system in the 2013 run, and the time difference between the two sides of MBTS was required to be less than 10 nanoseconds to select good events.
A three-level trigger system is used to select events [16]. The Level-1 (L1) trigger is implemented in hardware and carries the detector position information to be investigated by the next steps. The software based High Level Trigger (HLT), which is subdivided into Level-2 (L2) trigger and Event Filter (EF), reconstructs tracks in the vicinity of the detector region reported by the L1 trigger. For this analysis, the L1 and EF are actively used, while the L2 triggers simply passed the events through.
1ATLAS uses a right-handed coordinate system with its origin at the nominal interaction point (IP) in the center of the detector y-axis points
3 Data and Monte Carlo samples
The analysis is based on data of p +Pb collisions at a centre-of-mass energy of 5.02 TeV per nucleon, and pp collisions at a centre-of-mass energy of 2.76 TeV, both collected in 2013. Events were collected using a trigger requiring at least one muon candidate at L1 and at least two muon candidates at EF, each passing the criterion of p
T> 2 GeV. The integrated luminosity of the analyzed samples is 28.1 nb
−1for p +Pb collisions and 4.0 pb
−1for pp collisions.
The energy asymmetry of the LHC beams in the 2013 p +Pb run (a 4 TeV proton beam and a 1.57 TeV per nucleon lead beam) resulted in a shift of the center of mass of the proton-nucleon system by 0.465 units of rapidity in the direction of the proton beam relative to the laboratory frame. Since data were collected in two configurations, interchanging the direction of the proton and the lead beams in the LHC, the center-of-mass rapidity of the proton-nucleon system, y
∗= y
lab− 0.465, is defined to be positive in the proton direction in both configurations.
Monte Carlo (MC) simulations of p + Pb events are used to study trigger and reconstruction efficiencies, and signal line shapes. Proton-proton events are generated with Pythia 8 [17, 18] using the CTEQ61L [19]
parton density function. In each event, a J/ψ or a ψ(2S) meson is produced unpolarized, either via prompt production or through the decay of a B-hadron that subsequently decays into muon pairs. The simulated particles are longitudinally boosted by β
z= 0.43 to match the corresponding center-of-mass shift. The response of the ATLAS detector is simulated using GEANT4 [20]. The events are reconstructed with the same algorithms as used for the data.
4 Data analysis
4.1 Centrality definition
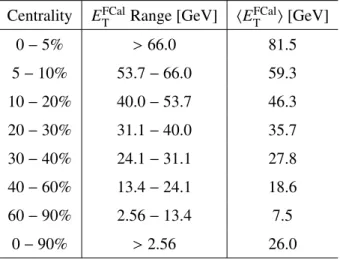
In order to characterize the p + Pb collision impact parameter, each event is assigned to a centrality class based on the total transverse energy measured in the FCal in the direction of the lead beam, E
FCalT[21].
Each centrality class corresponds to a fixed percentile in the E
FCalTdistribution of minimum bias events.
Collisions with a small (large) impact parameter are referred to as central (peripheral). The standard Glauber model [22] is used to calculate the mean number of participant nucleons, hN
parti, and the mean nuclear thickness function, hT
pPbi, for each centrality class. The mean number of inelastic nucleon- nucleon collisions, hN
colli, is hN
parti − 1, and it is equivalent to hT
pPbi multiplied by the total nucleon- nucleon cross section. Based on the observed centrality dependence of charged particle multiplicity [21], the Glauber-Gribov Color Fluctuation (GGCF) model [23, 24], an extension to the Glauber model which allows event-by-event fluctuations of the nucleon-nucleon cross section, is also considered. In this model, the magnitude of the fluctuations is characterized by the parameter ω
σ, with ω
σ= 0 corresponding to the standard Glauber model. In addition to the standard Glauber model, a GGCF model with ω
σ= 0.11 is used. The centrality classes used in this analysis, ranging from most central to most peripheral, are:
0-5%, 5-10%, 10-20%, 20-30%, 30-40%, 40-60%, and 60-90%. The corresponding E
FCalTrange and average value, hE
FCalT
i , for each centrality class are listed in Table 1.
Besides its sensitivity to the number of participant nucleons, the E
FCalTfor a fixed geometry may also be
a ff ected by the presence of a hard scattering process which is often correlated with a larger transverse
processes such as jet and Z boson productions, as the yield is enhanced in more central events but depleted in more peripheral ones. This effect, referred to as a centrality bias, has been noted for yields of hard processes in d + Au collisions at √
s
NN= 200 GeV by the PHENIX Collaboration [25], and by the ALICE Collaboration in p + Pb collisions at √
s
NN= 5.02 TeV [26]. Recently, calculations of a centrality bias have been made in which the average yield from hard scattering processes in each nucleon-nucleon collision is taken to be proportional to the contribution from that collision to the E
T, which determines the centrality (E
FCalTin this analysis) [27]. This model is applied to the ATLAS p + Pb centrality classification for both the standard Gluaber model and the GGCF model, and thus used to calculate corrections, ρ, to the hard process yield measured in a given centrality bin. The centrality bias correction, ρ, is applied to raw yield Y to determine the corrected yield Y
corr= Y/ρ.
Centrality E
FCalTRange [GeV] hE
FCalTi [GeV]
0 − 5% > 66.0 81.5
5 − 10% 53.7 − 66.0 59.3
10 − 20% 40.0 − 53.7 46.3
20 − 30% 31.1 − 40.0 35.7
30 − 40% 24.1 − 31.1 27.8
40 − 60% 13.4 − 24.1 18.6
60 − 90% 2.56 − 13.4 7.5
0 − 90% > 2.56 26.0
Table 1: Classification of centrality bins with the corresponding range of total transverse energy measured in the FCal in the lead beam direction,ETFCaland the expected average,hETFCali, as obtained from minimum bias events in p+Pb collisions.
4.2 Signal candidate selection
An o ffl ine algorithm to reconstruct muons is applied to selected events. Muon candidates are formed by a combination of charged-particle tracks reconstructed in the ID and the MS. Di-muon pairs are further required to have opposite charge, and to originate from a common vertex. Pairs are selected with invariant mass, m
µµ, between 2.6 and 4.1 GeV, and are limited to the transverse momentum range 8.5 < p
µµT<
30 GeV.
4.3 Determination of cross section and yield per event
Prompt charmonium refers to a state that decays very close to the primary vertex of the collision, includ- ing direct charmonium production and feed-down from heavier charmonium states. If the decay chain producing a charmonium state includes long-lived B-hadrons, then such state is labeled as non-prompt.
Prompt and non-prompt processes can be distinguished by using the “pseudo-proper time”, τ, defined
as:
τ = L
xym
µµp
µµT, (2)
where L
xyis the signed projection of the decay length on the transverse plane, which is measured with the same procedure as described in [28].
Determination of the prompt and non-prompt cross sections proceeds in several steps. First, a weight, w
total, is determined for each selected di-muon candidate as:
w
−1total= A · ε
reco· ε
trig, (3)
where A is the acceptance, ε
recois the reconstruction e ffi ciency, and ε
trigis the trigger e ffi ciency. Next, an unbinned two dimensional maximum likelihood fit is performed in the weighted distributions of the invariant mass of di-muons, m
µµ, and the pseudo-proper decay time, τ, to extract the prompt and non- prompt ψ yields. Finally, the yield per event and the cross section are calculated from the extracted signal.
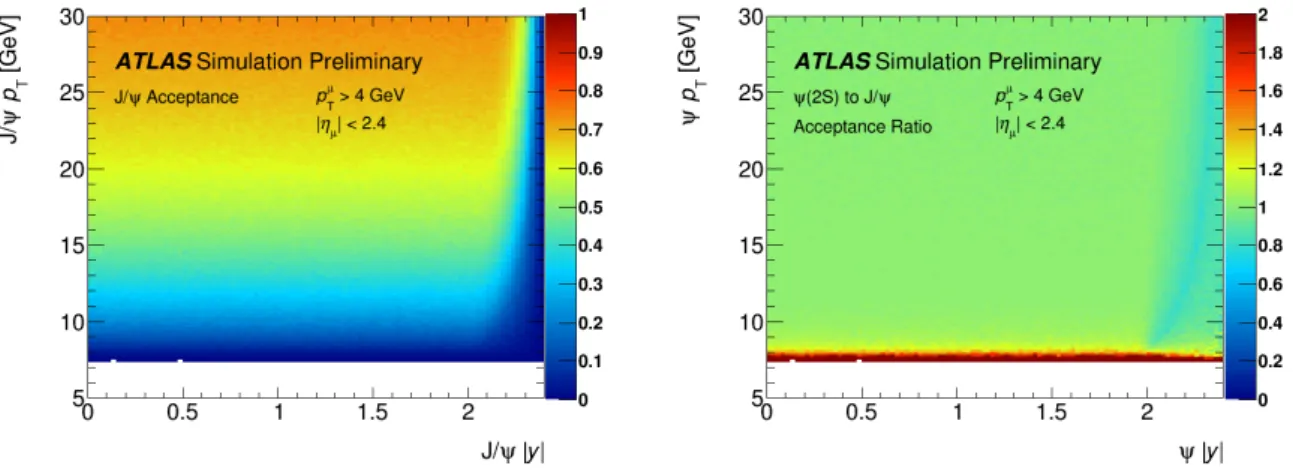
The kinematic acceptance A( p
T, y) for a ψ → µ
+µ
−(ψ refers to either J/ψ or ψ(2S) hereafter) decay with transverse momentum p
Tand rapidity y is obtained from a MC simulation as the probability that both muons pass the fiducial selection (p
µT> 4 GeV and |η
µ| < 2.4). This analysis assumes a nominal unpolarized spin-alignment scenario. The 2D J/ψ → µ
+µ
−acceptance map and the ψ(2S) → µ
+µ
−to J/ψ → µ
+µ
−acceptance ratio are shown in Figure 1.
Figure 1: The 2D acceptance map forJ/ψ → µ+µ− (left) and theψ(2S) → µ+µ−to J/ψ → µ+µ− acceptance ratio (right) as a function of the dimuonpT and absolute rapidity assuming the nominal isotropic spin-alignment hypothesis, using the muon selection criteria:pT >4 GeV and|ηµ|<2.4.
The muon reconstruction e ffi ciency is obtained from pp data using J/ψ → µ
+µ
−decays, as described
in [29]. The muon reconstruction efficiency was also checked with p +Pb data as a function of centrality,
and with pp data as a function of pileup, and no dependence was observed.
The trigger e ffi ciency has two components, and can be written as the product of the L1 trigger e ffi ciency (ε
L1) and the EF trigger efficiency given a L1 trigger (ε
EF|L1):
ε
trig(µ
1µ
2) = (1 − (1 − ε
L1(µ
1))(1 − ε
L1(µ
2))) · ε
EF|L1(µ
1µ
2). (4) The L1 single muon trigger efficiency is obtained from pp collisions at 8 TeV using J/ψ → µ
+µ
−de- cays [30]. For muons with p
T> 4 GeV, the L1 trigger e ffi ciency is about 80% for |η| < 1.05 and 90%
for 1.05 < |η| < 2.4. Similarly to muon reconstruction, no centrality dependence in p + Pb and no pile-up dependence in pp are found. The same EF muon trigger efficiency, ε
EF|L1(µ), as discussed in [13] is used for the EF.
The probability density function (pdf) for the fit follows the method described in [14]. In order to stabilize the fit model, and reduce the correlation between free parameters, a number of component terms share common parameters, or use a free scaling parameter. Fits are performed with the RooFit [31] framework.
The details of the central fit model are described below.
The signal mass shapes are described by the sum of a Crystal Ball shape (CB) [32] and a single Gaussian.
For each of the J/ψ and ψ(2S) the CB and Gaussian share a common mean. The width term in the CB function is equal to the Gaussian sigma times a free scaling term. This scaling term is common between the J/ψ and ψ(2S). The CB α and n parameters are fixed. The relative fraction of the CB and the Gaussian is free, but common between the J/ψ and ψ(2S). In order to deal with low numbers of ψ(2S) candidates, the mean and width of the ψ(2S) are further restricted to be fixed relative to the corresponding J/ψ parameters using the mass ratio [33] of m
ψ(2S)/m
J/ψ= 1.190.
The non-prompt signal lifetime shapes are described by a single sided exponential convoluted with a double Gaussian lifetime resolution function. The same resolution function is used to describe the prompt contribution by convoluting it with a delta function.
The background lifetime contributions are described by the sum of one prompt component and two non- prompt components. The prompt background component is described by a delta function convoluted with a double Gaussian function. While one of the non-prompt background contributions is described by a single-sided decay model (for positive τ only), the other is described by a double-sided decay model counting for candidates of mis-reconstructed or non-coherent di-muon pairs. The same Gaussian resolu- tion functions are used for the background, as for the signal. For the background parameterizations in the mass distribution, the single-sided non-prompt contribution is modeled by an exponential. The prompt mass contribution follows a flat distribution, and the double-sided background uses an exponential.
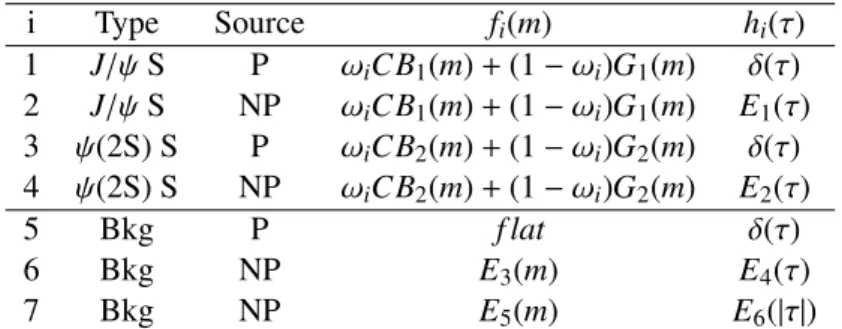
The pdf can be written in a compact form as pdf(m, τ) = P
7i=1
κ
if
i(m) · h
i(τ) ⊗ g(τ), where κ
iis the
normalization factor and g(τ) is the double Gaussian resolution function. The individual components of
the mass shape, f
i(m), and the lifetime shape, h
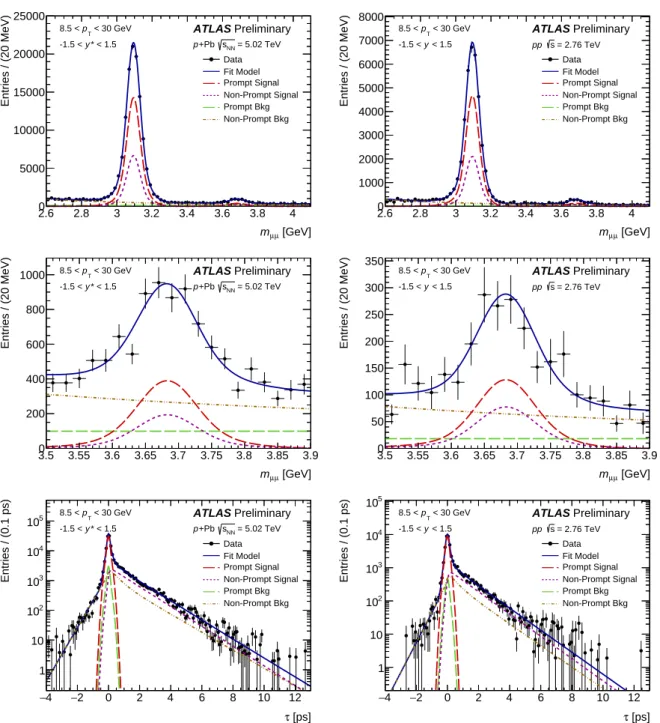
i(τ), are given in Table 2. The resulting fits are shown in
Fig. 2 for p + Pb (left) and pp (right), for muon pairs in the 8.5 < p
T< 30 GeV and −1.5 < y
∗(y) < 1.5
ranges.
i Type Source f
i(m) h
i(τ) 1 J/ψ S P ω
iCB
1(m) + (1 − ω
i)G
1(m) δ(τ) 2 J/ψ S NP ω
iCB
1(m) + (1 − ω
i)G
1(m) E
1(τ) 3 ψ(2S) S P ω
iCB
2(m) + (1 − ω
i)G
2(m) δ(τ) 4 ψ(2S) S NP ω
iCB
2(m) + (1 − ω
i)G
2(m) E
2(τ)
5 Bkg P f lat δ(τ)
6 Bkg NP E
3(m) E
4(τ)
7 Bkg NP E
5(m) E
6(|τ|)
Table 2: Probability density functions for individual components in the fit model used to extract the prompt (P) and non-prompt (NP) contributions for theJ/ψand theψ(2S) signal (S) and background (Bkg). The index,i, runs from 1 to 7 for 7 different components. The composite pdf terms are defined as follows:CB- Crystal Ball;G- Gaussian;
E(τ) - single sided exponential;E(|τ|) - double sided exponential;δ- delta function. The parameterωis the fraction of CB function in the signal.
[GeV]
µ
mµ
2.6 2.8 3 3.2 3.4 3.6 3.8 4
Entries / (20 MeV)
0 5000 10000 15000 20000 25000
ATLAS Preliminary
= 5.02 TeV sNN
+Pb p < 30 GeV
pT
8.5 <
* < 1.5 y -1.5 <
Data Fit Model Prompt Signal Non-Prompt Signal Prompt Bkg Non-Prompt Bkg
[GeV]
µ
mµ
2.6 2.8 3 3.2 3.4 3.6 3.8 4
Entries / (20 MeV)
0 1000 2000 3000 4000 5000 6000 7000 8000
ATLAS Preliminary
= 2.76 TeV s pp < 30 GeV
pT
8.5 <
< 1.5 y -1.5 <
Data Fit Model Prompt Signal Non-Prompt Signal Prompt Bkg Non-Prompt Bkg
[GeV]
µ
mµ
3.5 3.55 3.6 3.65 3.7 3.75 3.8 3.85 3.9
Entries / (20 MeV)
0 200 400 600 800
1000 ATLAS Preliminary
= 5.02 TeV sNN
+Pb p < 30 GeV
pT
8.5 <
* < 1.5 y -1.5 <
[GeV]
µ
mµ
3.5 3.55 3.6 3.65 3.7 3.75 3.8 3.85 3.9
Entries / (20 MeV)
0 50 100 150 200 250 300
350 ATLAS Preliminary
= 2.76 TeV s pp < 30 GeV
pT
8.5 <
< 1.5 y -1.5 <
[ps]
τ
−4 −2 0 2 4 6 8 10 12
Entries / (0.1 ps)
1 10 102
103
104
105
< 30 GeV pT
8.5 <
* < 1.5 y -1.5 <
ATLAS Preliminary
= 5.02 TeV sNN
+Pb p
Data Fit Model Prompt Signal Non-Prompt Signal Prompt Bkg Non-Prompt Bkg
[ps]
τ
−4 −2 0 2 4 6 8 10 12
Entries / (0.1 ps)
1 10 102
103
104
105
< 30 GeV pT
8.5 <
< 1.5 y -1.5 <
ATLAS Preliminary
= 2.76 TeV s pp
Data Fit Model Prompt Signal Non-Prompt Signal Prompt Bkg Non-Prompt Bkg
Figure 2: Selected fit results. Data are compared to projections of the two-dimensional fit onto the di-muon invariant mass range of 2.6−4.1 GeV (top) and 3.5−3.9 GeV (middle), and the di-muon pseudo-proper lifetime (bottom).
The left column is for p+Pb collisions at 5.02 TeV, and the right column is for ppcollisions at 2.76 TeV. The di-muon candidates are selected in the range of 8.5<pT<30 GeV and−1.5< y∗(y)<1.5. The various curves are described in the legend.
4.4 Nuclear modification factor
The nuclear modification factor, R
pPb, is used to compare the production of J/ψ and ψ(2S) in p + Pb to the same processes in pp collisions. It is defined as:
R
pPb= 1 A
Pbd
2σ
ψp+Pb/dy
∗d p
Td
2σ
ψpp/dyd p
T, (5)
where A
Pb= 208. The nuclear modification factor may also be defined for a given centrality class as:
R
pPb= 1 hT
pPbi
cent1/N
evtd
2N
ψp+Pb/dy
∗d p
T centd
2σ
ψpp/dyd p
T, (6)
where N
evtis the total number of minimum bias p + Pb events and hT
pPbi
centis the mean nuclear thickness function as described in Section. 4.1 in the centrality class, and N
ψp+Pbis the number of charmonium signal events in the same centrality class. In the case of centrality bias corrected yield, the bias correction factors would be applied as N
ψp+Pb,corr= N
ψp+Pb/ρ.
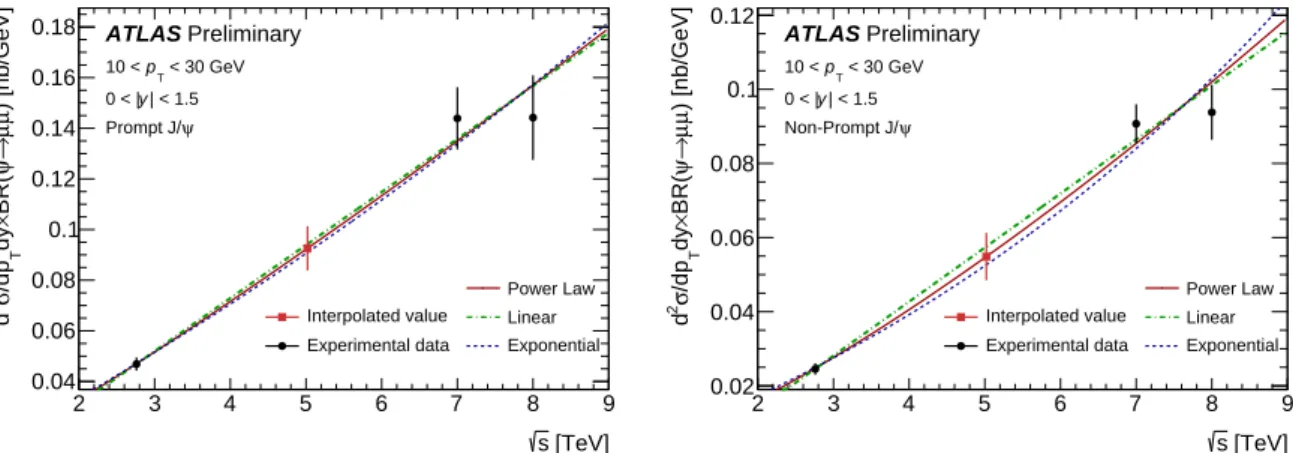
In the absence of a measured pp reference cross section at √
s = 5.02 TeV, an interpolation of the cross sections measured at nearby energies is used. The interpolation is based on the cross section measured at √
s = 2.76 TeV, presented in this analysis, and the cross sections measured at √
s = 7 and 8 TeV [14].
Following the approach adopted by the ALICE [34] and LHCb [35] Collaborations, three functional forms in √
s were used for the interpolation:
σ( √ s) =
p
0+ √
sp
1linear
( √
s/ p
0)
p1power law p
0(1 − exp( − √
s/ p
1)) exponential
(7)
The central value for the cross section at √
s = 5.02 TeV is derived from the power-law interpolation. The other functions are used in the calculation of the uncertainty associated with the interpolation. Results of the selected energy interpolation in data are shown in Fig. 3.
4.5 Self-normalized yields
The yields of ψ per event in each centrality class can be normalized to the yield per event measured in all centrality classes (0-90% centrality). These quantities are called self-normalized yields, ψ/hψi.
The correlation of charmonium production with the size of the underlying event activity is tracked by comparing the self-normalized charmonium yields with the similar self-normalized transverse energy, E
TFCal/hE
FCalTi, measured in the FCal in the lead beam direction. The self-normalized quantities ψ/hψi and E
TFCal/hE
FCalTi are defined as:
ψ
hψi = N
ψ/N
evt centN
ψ0−90%/N
evt0−90%, (8)
[TeV]
s
2 3 4 5 6 7 8 9
) [nb/GeV]µµ→ψBR(×dy T/dpσ2d
0.04 0.06 0.08 0.1 0.12 0.14 0.16
0.18 ATLAS Preliminary
< 30 GeV pT
10 <
| < 1.5 y 0 < |
ψ Prompt J/
Interpolated value Experimental data
Power Law Linear Exponential
[TeV]
s
2 3 4 5 6 7 8 9
) [nb/GeV]µµ→ψBR(×dy T/dpσ2d
0.02 0.04 0.06 0.08 0.1
0.12 ATLAS Preliminary
< 30 GeV pT
10 <
| < 1.5 y 0 < |
ψ Non-Prompt J/
Interpolated value Experimental data
Power Law Linear Exponential
Figure 3: Selected interpolations of differential cross sections as a function of center-of-mass energy and the re- sults of different interpolation functions fitting for prompt J/ψ(left) and non-prompt J/ψ(right) for the range of 10 < pT < 30 GeV and|y| < 1.5. Error bars on interpolated points include correlated, uncorrelated systematic uncertainties and the interpolation function variation.
E
FCalThE
FCalTi = hE
FCalTi
centhE
FCalTi
0−90%, (9)
where N
ψis the ψ yield extracted from the fit for one centrality class. The yield is divided by centrality bias corrections in the case of bias-corrected self-normalized ratios.
5 Systematic uncertainties
5.1 Luminosity Uncertainty
The luminosity scales determined by ATLAS for the 2013 p +Pb and 2013 pp datasets have been cal- ibrated based on dedicated beam-separation scans, also known as van der Meer (vdM) scans. Similar systematic uncertainties as those found in the 2012 pp luminosity calibration were studied, the combina- tion of these results in a final uncertainty on the luminosity scale in p +Pb collisions at √
s
NN= 5.02 TeV of δL/L = ±2.7% [36] and in pp collisions at √
s = 2.76 TeV of δL/L = ±3.1% [37].
5.2 Reconstruction E ffi ciency Uncertainty
A systematic uncertainty of 1% is applied to account for the inner detector reconstruction efficiency
for each muon over the whole kinematic range. This uncertainty is applied to the di ff erential cross-
sections and per-event yields measurements. It is assumed that this uncertainty cancels out in the ratio
measurements.
The single muon reconstruction e ffi ciency is obtained from 7 and 8 TeV pp collision data using the tag- and-probe method, and it is mapped in bins of muon transverse momentum and charge times pseudo- rapidity. The statistical uncertainty associated with the tag-and-probe calculation is the dominant uncer- tainty of the muon reconstruction e ffi ciency. To estimate the e ff ect of the muon reconstruction uncer- tainty and its correlation with the di-muon observable, the efficiency map is reproduced in 200 pseudo- experiments. In each pseudo-experiment a new e ffi ciency map is created by randomly varying each bin in the original map according to the appropriate statistical uncertainty. For each pseudo-experiment, all observables in the analysis are recalculated with a weight corresponding to the generated efficiency map.
The variance over the 200 cases is used as the uncertainty for each observable.
5.3 Trigger E ffi ciency Uncertainty
The L1 trigger efficiency is measured from p + Pb data using the tag-and-probe method. The systematic uncertainties associated with the L1 trigger efficiency include contributions from: matching between the probe muon and L1 trigger RoI, the muon vertex parameter reweighting, the probe muon charge dependence, and the relative difference between the efficiencies measured in p +Pb and pp datasets. The L1 trigger uncertainty is treated as fully correlated over the muon p
Tpseudo-rapidity, and charge.
Similar to the muon reconstruction e ffi ciency, the systematic uncertainties associated with the EF trigger efficiency are dominated by the statistical uncertainties of the tag-and-probe sample, and thus, the same pseudo-experiment procedure is used to propagate the uncertainties to the di-muon observables. Addi- tional tests were performed to check that the correction weights calculated from the single muon trigger efficiency map were self-consistent, by means of a closure test. The number of recovered J/ψ after the weighting procedure was checked against the original number of reconstructed Monte Carlo events. An extra 2% correlated uncertainty is added to the cross-section observables, but cancelled in ratios to cover the non-closure found in the closure test.
5.4 Yield Extraction Uncertainty
The uncertainty associated with the choice of the fit function used to extract the yield is evaluated by varying the line shape of each component in each dimension. All measured quantities were recalculated using the varied line shapes.The maximum variation between the recalculated values and the central value is assigned as the uncertainty to the fit model. There are 10 variation models including:
• Signal mass shape. The CB plus Gaussian function is replaced by a double Gaussian function. In addition, the α and n parameters of the CB model, which are fixed in the original fit procedure, are left to vary.
• Signal decay time shape. A double exponential function is used to describe the signal decay time line shape.
• Background mass shapes. The exponential functions used for the background components are replaced by 2
ndorder Chebyshev polynomials.
• Background decay time shape. A double exponential is used.
• Decay time resolution. A single Gaussian function is used in place of the double Gaussian function
To evaluate the fit model systematic uncertainties in observables like the double ratio, one checks that the fit models are varying coherently in both pp and p + Pb datasets. The maximum variations in the p + Pb to pp ratio are assessed as the fit model systematic uncertainties.
The uncertainty on the quarkonia yields due to the p
Tresolution has been studied in previous ATLAS measurements [38], and found to be quite small, around 0.5%, and thus, it is neglected in this analysis.
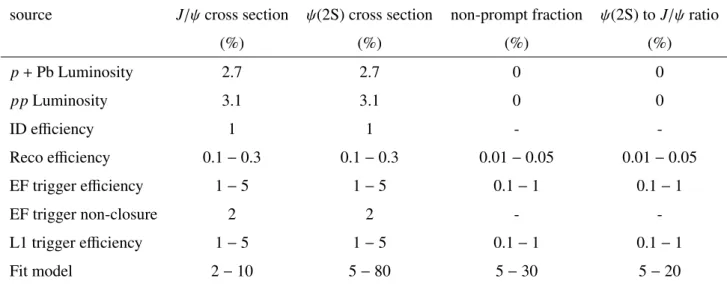
Table 3 summaries the contributions of each systematic uncertainty herein explained.
source J/ψ cross section ψ(2S) cross section non-prompt fraction ψ(2S) to J/ψ ratio
(%) (%) (%) (%)
p + Pb Luminosity 2.7 2.7 0 0
pp Luminosity 3.1 3.1 0 0
ID efficiency 1 1 - -
Reco e ffi ciency 0.1 − 0.3 0.1 − 0.3 0.01 − 0.05 0.01 − 0.05
EF trigger efficiency 1 − 5 1 − 5 0.1 − 1 0.1 − 1
EF trigger non-closure 2 2 - -
L1 trigger efficiency 1 − 5 1 − 5 0.1 − 1 0.1 − 1
Fit model 2 − 10 5 − 80 5 − 30 5 − 20
Table 3: Summary of systematic uncertainties on different observables.
5.5 Interpolated Reference Uncertainty
The uncertainty associated with the energy interpolation used to prepare a pp cross section reference for the R
pPbcalculation contains three parts:
• Correlated experimental uncertainty. The uncertainties due to ID tracking efficiency (1%), muon reconstruction e ffi ciency (0.5%), and variation of the fit model (2% for J/ψ and 5% for ψ(2S)) are taken to be fully correlated across di ff erent energies.
• Uncorrelated experimental uncertainty. Uncorrelated uncertainties are assessed as the uncer- tainties of data points during the fitting procedure. The goodness of the fit also contributes to the confidence interval estimation.
• Interpolation function variation. The maximum difference between the linear and exponential
interpolation functions and the power law function is assigned as uncertainty on the interpolation
itself.
6 Results
6.1 pp results
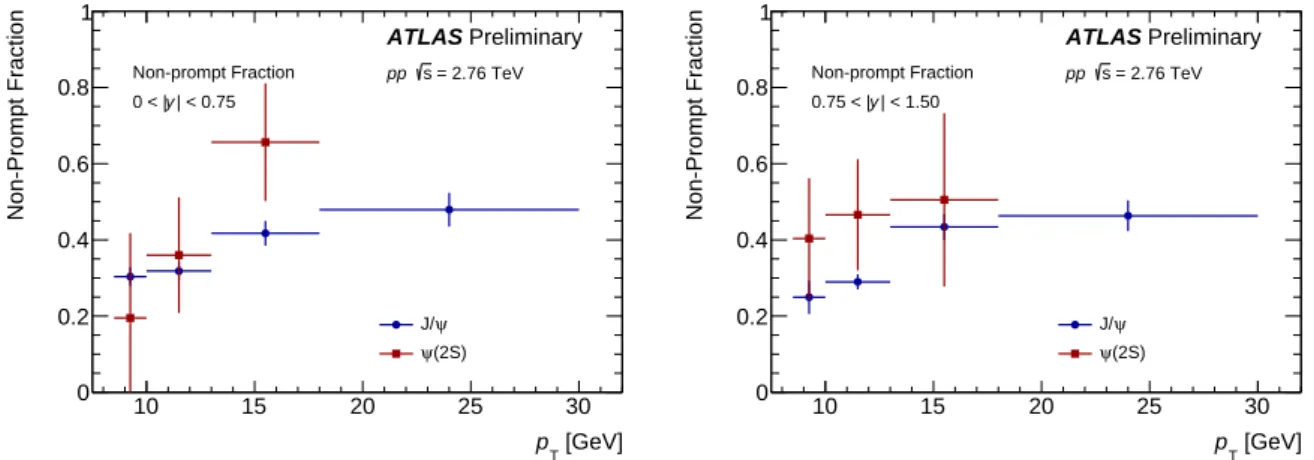
Non-prompt fractions for J/ψ and ψ(2S) in pp collisions at 2.76 TeV are shown in Fig. 4 in bins of p
Tfor di ff erent rapidity slices. The error bars combine the statistical and the systematic uncertainties in quadrature.
[GeV]
pT
10 15 20 25 30
Non-Prompt Fraction
0 0.2 0.4 0.6 0.8 1
ATLAS Preliminary
= 2.76 TeV s Non-prompt Fraction pp
| < 0.75 y 0 < |
ψ J/
ψ(2S)
[GeV]
pT
10 15 20 25 30
Non-Prompt Fraction
0 0.2 0.4 0.6 0.8 1
ATLAS Preliminary
= 2.76 TeV s Non-prompt Fraction pp
| < 1.50 y 0.75 < |
ψ J/
ψ(2S)
Figure 4: Non-prompt fractions ofJ/ψandψ(2S) in ppcollisions at 2.76 TeV as a function of pT for two ranges in rapidity as denoted in the legend. The vertical error bars combine the statistical and the systematic uncertainties added in quadrature.
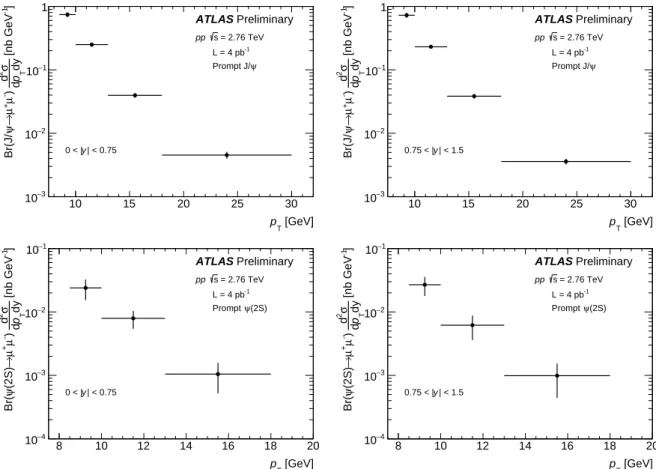
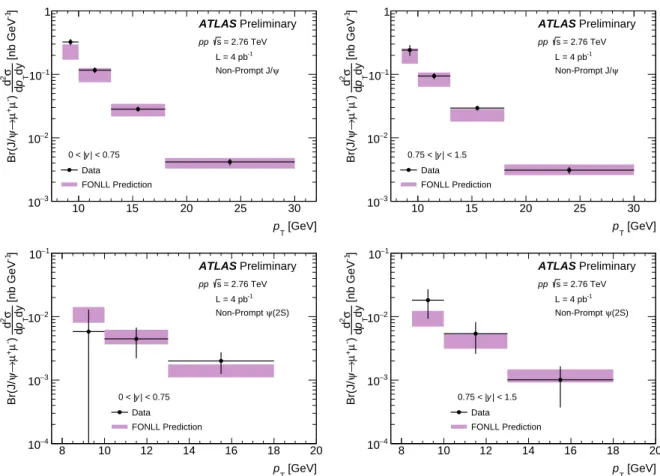
The double di ff erential cross sections in pp collisions at 2.76 TeV are shown in Fig. 5 and Fig. 6 for prompt and non-prompt ψ production, respectively. The non-prompt ψ cross sections were compared to the average cross section for each p
Tinterval from the FONLL calculation [39]. The systematic uncertainties on the FONLL calculation are obtained by varying the b-quark mass, by separately varying the renormalization and factorization scales up and down by a factor of two, and by accounting for the parton distribution function uncertainties. The measured cross sections are consistent with the FONLL calculation within uncertainties.
6.2 Nuclear modification factor
The p
Tand y
∗dependence of R
pPbfor prompt J/ψ, non-prompt J/ψ and prompt ψ(2S) is shown in Fig. 7.
The R
pPbis calculated using the cross sections in p + Pb and pp collisions as defined in Eq. 5, where the
ψ cross section for 5.02 TeV pp collisions was obtained from the energy interpolation. The interpolations
performed in the 8.5 − 10 GeV p
Trange comprised only the 7 and 2.76 TeV results, since the 8 TeV results
are not available for this range. On the other hand, for the 10 − 30 GeV p
Trange, the results from the
three center-of-mass collision energies were used. For all three channels, prompt J/ψ, non-prompt J/ψ
and prompt ψ(2S), the R
pPbis above unity and doesn’t show any significant trend in p
Tand y
∗. The
precision of the non-prompt channel of ψ(2S) production is limited by large statistical uncertainties, so
the non-prompt ψ(2S) modification factors are not presented in this note.
[GeV]
pT
10 15 20 25 30
]-1 [nb GeV dy Tpdσ2d) -µ+µ→ψBr(J/
−3
10
−2
10
−1
10 1
ATLAS Preliminary
= 2.76 TeV s pp
L = 4 pb-1
ψ Prompt J/
| < 0.75 y 0 < |
[GeV]
pT
10 15 20 25 30
]-1 [nb GeV dyTpdσ2d) -µ+µ→ψBr(J/
−3
10
−2
10
−1
10 1
ATLAS Preliminary
= 2.76 TeV s pp
L = 4 pb-1
ψ Prompt J/
| < 1.5 y 0.75 < |
[GeV]
pT
8 10 12 14 16 18 20
]-1 [nb GeV dy Tpdσ2d) -µ+ µ→(2S)ψBr(
−4
10
−3
10
−2
10
−1
10
ATLAS Preliminary
= 2.76 TeV s pp
L = 4 pb-1
ψ(2S) Prompt
| < 0.75 y 0 < |
[GeV]
pT
8 10 12 14 16 18 20
]-1 [nb GeV dyTpdσ2d) -µ+µ→(2S)ψBr(
−4
10
−3
10
−2
10
−1
10
ATLAS Preliminary
= 2.76 TeV s pp
L = 4 pb-1
ψ(2S) Prompt
| < 1.5 y 0.75 < |
Figure 5: Double differential cross section of promptJ/ψ(top) andψ(2S) (bottom) inppcollisions at 2.76 TeV as a function ofpT. The rapidity slice 0<|y|<0.75 is on the left while 0.75<|y|<1.5 is on the right. The center of the bin is the geometric center, and the vertical error bars combine the statistical and the systematic uncertainties added in quadrature.
The nuclear modification factors are shown in Fig. 8 as a function of hN
parti with and without centrality bias corrections for prompt J/ψ, non-prompt J/ψ and prompt ψ(2S), respectively. Systematic uncertain- ties on hT
pPbi and bias correction factors are evaluated independently for the standard Glauber and the GGCF model. Centrality bias corrections are taken from [27]. Unlike the other figures, the horizontal extension of the uncertainty band represents the uncertainty due to the model dependent hN
parti calcula- tion.
Non-strongly interacting particles like Z bosons scale with the number of nucleon-nucleon collisions [40].
The ψ to Z yield ratio can provide a test of ψ production scaling with the nuclear thickness independent of
geometric models. Prompt J/ψ, non-prompt J/ψ and prompt ψ(2S) to Z yield ratios are shown in Fig. 9
as a function of total E
FCalT. The Z yields for the range of −3 < y
∗Z< 2 are taken from [41]. Figure 8
and 9 confirm that there is no obvious centrality dependence of J/ψ production, while prompt ψ(2S) R
pPbshows a decreasing trend from peripheral to central collisions.
[GeV]
pT
10 15 20 25 30
]-1 [nb GeV dy Tpdσ2d) -µ+µ→ψBr(J/
−3
10
−2
10
−1
10 1
ATLAS Preliminary
= 2.76 TeV s pp
L = 4 pb-1
ψ Non-Prompt J/
| < 0.75 y 0 < |
Data
FONLL Prediction
[GeV]
pT
10 15 20 25 30
]-1 [nb GeV dyTpdσ2d) -µ+µ→ψBr(J/
−3
10
−2
10
−1
10 1
ATLAS Preliminary
= 2.76 TeV s pp
L = 4 pb-1
ψ Non-Prompt J/
| < 1.5 y 0.75 < |
Data
FONLL Prediction
[GeV]
pT
8 10 12 14 16 18 20
]-1 [nb GeV dy Tpdσ2d) -µ+µ→ψBr(J/
−4
10
−3
10
−2
10
−1
10
ATLAS Preliminary
= 2.76 TeV s pp
L = 4 pb-1
ψ(2S) Non-Prompt
| < 0.75 y 0 < |
Data
FONLL Prediction
[GeV]
pT
8 10 12 14 16 18 20
]-1 [nb GeV dyTpdσ2d) -µ+µ→ψBr(J/
−4
10
−3
10
−2
10
−1
10
ATLAS Preliminary
= 2.76 TeV s pp
L = 4 pb-1
ψ(2S) Non-Prompt
| < 1.5 y 0.75 < |
Data
FONLL Prediction
Figure 6: Double differential cross section of non-promptJ/ψ(left) and non-promptψ(2S) (right) inppcollisions at 2.76 TeV as a function of pT compared with FONLL predictions. The rapidity slice 0 < |y| < 0.75 is on the left while 0.75<|y|<1.5 is on the right. The center of the bin is the geometric center, and the vertical error bars combine the statistical and the systematic uncertainties added in quadrature.
6.3 Self-normalized ratio
The prompt J/ψ, non-prompt J/ψ and prompt ψ(2S) self-normalized yields, ψ/hψi, in bins of self- normalized FCal E
T, E
FCalT/hE
TFCali, are shown in Fig. 10. The self-normalized ratios without central- ity bias corrections are compared to CMS Υ production results [42]. The uncorrected J/ψ and Z self- normalized ratios behave in a similar way to the Υ self-normalized ratios measured by the CMS Col- laboration. At large E
FCalTregion E
TFCal/hE
FCalTi > 3), significant deviations from the linear scaling are observed for both ψ and Z productions. The deviations become more significant when the centrality bias correction is applied.
6.4 Prompt excited-to-ground state ratio
The prompt ψ(2S) to J/ψ production ratio in p + Pb collisions is shown in Fig. 11 in bins of E
FCalTalong
with the same ratio in pp collisions at 2.76 TeV.
Prompt ψ(2S) to J/ψ double ratios R
pPb(ψ(2S))/R
pPb(J/ψ) in bins of y
∗and in bins of E
TFCalare shown in Fig. 12. The prompt production ratios at 2.76 TeV pp collisions are used as the reference since the single production ratios in pp collisions do not depend significantly on √
s [14]. The right panel of Fig. 12 is the single prompt excited-to-ground state ratio measured in p + Pb collisions in Fig. 11 divided by the pp point for √
s = 2.76 TeV with the errors convolved. The prompt ψ(2S) to J/ψ production double ratios show no obvious rapidity dependence, but a decreasing trend as the event activity increases.
7 Summary
The double di ff erential prompt and non-prompt production cross sections, as well as the non-prompt fraction for J/ψ and ψ(2S) decaying into two muons, were measured for pp data at √
s = 2.76 TeV. The measured non-prompt J/ψ and ψ(2S) cross sections show good agreement with FONLL predictions.
The cross sections in pp collisions at 5.02 TeV were obtained by interpolation of the cross sections at 2.76, 7 and 8 TeV, in order to be able to compare p +Pb and pp datasets for the nuclear modification factor R
pPbdetermination. The R
pPbof both prompt and non-prompt J/ψ were measured to be above unity and show no significant dependence on p
Tand y
∗. The R
pPbof prompt and non-prompt J/ψ is found to be independent of centrality following the application of centrality bias corrections. The ratio of J/ψ to Z is also independent of event activity.
Because it is limited by large uncertainties, the p
Tand y
∗dependence of prompt ψ(2S) R
pPbis not clear, but there is an overall enhancement integrated over the whole kinematic region. Prompt ψ(2S) R
pPbshows a decreasing trend from peripheral to central collisions, confirmed by the ψ(2S) to Z ratio.
The uncorrected J/ψ and Z self-normalized ratios show similar trends to the Υ self-normalized ratios measured by the CMS Collaboration. At large E
FCalT, E
FCalT/hE
TFCali > 3, significant deviations from the unity are observed for prompt J/ψ, non-prompt J/ψ and prompt ψ(2S). The deviations become more significant when the centrality bias correction is applied. A similar deviation at large E
FCalTis also observed for Z bosons.
The prompt ψ(2S) to J/ψ production double ratio shows no obvious rapidity dependence, but decreases
with increasing event activity.
[GeV]
pT
10 15 20 25 30
pPbR
0.4 0.6 0.8 1 1.2 1.4 1.6 1.8
2 ATLAS Preliminary
= 5.02 TeV sNN
+Pb p ψ
Prompt J/
* < 1.5 y -1.5 <
* y
−1.5 −1 −0.5 0 0.5 1 1.5
pPbR
0.4 0.6 0.8 1 1.2 1.4 1.6 1.8
2 ATLAS Preliminary
= 5.02 TeV sNN
+Pb p ψ
Prompt J/
< 30 GeV pT
10 <
[GeV]
pT
10 15 20 25 30
pPbR
0.4 0.6 0.8 1 1.2 1.4 1.6 1.8
2 ATLAS Preliminary
= 5.02 TeV sNN
+Pb p ψ
Non-Prompt J/
* < 1.5 y -1.5 <
* y
−1.5 −1 −0.5 0 0.5 1 1.5
pPbR
0.4 0.6 0.8 1 1.2 1.4 1.6 1.8
2 ATLAS Preliminary
= 5.02 TeV sNN
+Pb p ψ
Non-Prompt J/
< 30 GeV pT
10 <
[GeV]
pT
10 15 20 25 30
pPbR
0.4 0.6 0.8 1 1.2 1.4 1.6 1.8
2 ATLAS Preliminary
= 5.02 TeV sNN
+Pb p ψ(2S)
Prompt
* < 1.5 y -1.5 <
* y
−1.5 −1 −0.5 0 0.5 1 1.5
pPbR
0.4 0.6 0.8 1 1.2 1.4 1.6 1.8
2 ATLAS Preliminary
= 5.02 TeV sNN
+Pb p ψ(2S)
Prompt < 30 GeV pT
10 <
Figure 7: The nuclear modification factor, RpPb, as a function of pT (left) and y∗ (right) for the production of promptJ/ψ(top), non-promptJ/ψ(middle) and promptψ(2S) (bottom). The error bars indicate only the statistical uncertainties, and the boxes represent the systematic uncertainties.