A TLAS-CONF-2018-013 23 May 2018
ATLAS CONF Note
ATLAS-CONF-2018-013
May 23, 2018
Prompt and non-prompt J / ψ elliptic flow in Pb+Pb collisions at √
s NN = 5.02 TeV with the ATLAS detector
The ATLAS Collaboration
The elliptic flow of prompt and non-prompt J/ψ was measured in the dimuon decay channel in Pb+Pb collisions at
√ s
NN= 5 . 02 TeV with an integrated luminosity of 0 . 42 nb
−1with ATLAS at the LHC. The prompt and non-prompt signals are separated using a two-dimensional simultaneous fit of the invariant mass and pseudo-proper time of the dimuon system from the J/ψ decay. The measurement is performed in the kinematic range 9 < p
T< 30 GeV,
| y | < 2 and 0 − 60% collision centrality. The elliptic flow is evaluated with respect to the event plane and the results are presented as a function of transverse momentum, rapidity and centrality. It is observed that prompt and non-prompt J/ψ mesons have non-zero elliptic flow. Prompt J/ψ v
2decreases as a function of p
T, while non-prompt J/ψ v
2is flat over the studied kinematical region. There is no observed dependence on rapidity or centrality.
© 2018 CERN for the benefit of the ATLAS Collaboration.
Reproduction of this article or parts of it is allowed as specified in the CC-BY-4.0 license.
1 Introduction
With the advent of lead-lead collisions at the center-of-mass energy of 5 . 02 TeV per nucleon-nucleon pair, new opportunities open up for understanding the detailed properties of the hot dense plasma produced in such collisions. A special advantage of studies with quarkonia as a hard probe in the plasma is that the comparison of prompt and non-prompt J /ψ mesons elucidates the differences in the responses of the produced c -quark and b -quark systems. This is because the prompt mesons are c c ¯ systems produced within a short time after the collision while the non-prompt mesons come from decays of B -hadrons that hadronize outside the medium [1]. Thus, the comparison of these two classes of J/ψ mesons probes the flavor dependence of the mechanisms of the interactions of heavy quarks with the medium. ATLAS measurements of the attenuation of both prompt and non-prompt J/ψ mesons indicate very strong medium effects that are surprisingly similar in magnitude at this collision energy [2].
A complementary and powerful probe into the heavy-quark flavor dependence of interaction mechanisms can be obtained by studying the azimuthal asymmetries of prompt and non-prompt quarkonia. Such studies [3–5] are especially useful in the transverse momentum range, 9 < p
T< 30 GeV, investigated in this paper, since this range represents the transition region spanning from the lower p
Tregion, in which recombination processes are believed to play an important role [6], to the higher p
Tregion in which other processes dominate [7, 8]. The naive expectation in this range is that recombination processes will partially couple the produced J/ψ to the hydrodynamic flow of the hot medium, resulting in an enhancement of the observed azimuthal asymmetry at lower p
Trelative to higher p
T[9]. In this picture, a flavor-dependent enhancement of the azimuthal asymmetry of J/ψ at low p
Tcan be interpreted as a difference in the degree of recombination of c - and b -quarks, with the expectation that any flavor dependence will vanish at higher values of p
T. A recent transport model study suggests the sensitivity of charm quarks to hydrodynamic flow [10].
In non-central collisions, the overlap region of the colliding ions has an elliptical shape. The particle yield is influenced by this matter distribution, leading to the observation of an azimuthal anisotropy relative to the reaction plane as observed for charged hadrons [11–16]. The azimuthal distribution of particles is characterized by a Fourier expansion of the particle yield:
dN dφ ∝ 1 +
∞
Õ
n=1
2 v
ncos [n(φ − Ψ
n)] , (1)
where φ is the azimuthal angle of the particle relative to the detector, and Ψ
nis the n -th harmonic of reaction plane angle, which can be estimated using the event-plane method [17]. The second order coefficient, v
2is referred to as elliptic flow and its magnitude quantifies the yield modulation relative to the elliptical shape of the initial matter distribution.
Interestingly the observed azimuthal asymmetry for prompt J/ψ is the same in central collisions as in
non-central collisions [5] in contradiction with the hydrodynamic-expected behavior, confirmed by the
results for charged hadrons where the anisotropies are more significant in semi-central collisions than in
peripheral and central collisions. This observation is an intriguing one that may ultimately provide more
insight into the origins of azimuthal asymmetries beyond a simple hydrodynamic picture. Further, there
seems to be a surprising universality among many different probes, such as D -mesons and jets [18, 19],
for which the v
2values are very similar at high p
T. This paper provides v
2measurements as a function of
transverse momentum, rapidity and collision centrality for both prompt and non-prompt J/ψ in the dimuon
decay channel, extending the covered kinematical range of recent results of the other LHC experiments
[3–5].
2 ATLAS detector
The ATLAS detector [20] at the LHC covers nearly the entire solid angle around the collision point. It consists of an inner tracking detector (ID) surrounded by a thin superconducting solenoid, electromagnetic and hadronic calorimeters, and a muon spectrometer (MS) incorporating three large superconducting toroid magnets.
1The high-granularity silicon pixel detector covers the interaction region and provides typically four measurements per track. It is followed by the silicon microstrip tracker which provides around eight two- dimensional measurement points per track. These silicon detectors are complemented by the transition radiation tracker (TRT), which enables radially extended track reconstruction up to |η| = 2 . 0. The ID system is immersed in a 2 T axial magnetic field and provides charged particle tracking in the range
|η| < 2 . 5.
The calorimeter system covers the pseudorapidity range |η| < 4 . 9. Within the region |η| < 3 . 2, electro- magnetic calorimetry is provided by barrel and endcap high-granularity lead/liquid-argon (LAr) electro- magnetic calorimeters, with an additional thin LAr presampler covering |η| < 1 . 8, to correct for energy loss in material upstream of the calorimeters. Hadronic calorimetry is provided by the steel/scintillating-tile calorimeter, segmented into three barrel structures within |η | < 1 . 7, and two copper/LAr hadronic endcap calorimeters. The high |η| region, 3 . 2 < |η| < 4 . 9, is covered by forward copper/LAr and tungsten/LAr calorimeter (FCal) modules optimized for electromagnetic and hadronic measurements respectively.
The MS comprises separate trigger and high-precision tracking chambers measuring the deflection of muons in a magnetic field generated by superconducting air-core toroids. The precision chamber system covers the region |η | < 2 . 7 with three layers of monitored drift tubes, complemented by cathode strip chambers in the forward region, where the background is highest. The muon trigger system covers the range |η| < 2 . 4 with resistive plate chambers in the barrel, and thin gap chambers in the endcap regions.
A two-level trigger system is used to select events [21]. The Level-1 trigger is implemented in hardware and uses a subset of detector information to reduce the event rate to a design value of at most 100 kHz.
This is followed by a software-based trigger level which reduces the event rate to about 1 kHz.
3 Analysis
3.1 Data, event selection and centrality definition Data from Pb+Pb collisions at √
s
NN= 5 . 02 TeV were recorded by the ATLAS experiment in 2015. Events were collected using a trigger requiring at least two muons, both with p
T> 4 GeV. This muon triggered dataset has an integrated luminosity of 0.42 nb
−1. In the offline analysis, reconstructed muons are required to satisfy the tight muon working point ignoring the TRT requirements [22], have p
T> 4 GeV, |η| < 2 . 4, and be matched to the muon reconstructed at the trigger level. In addition, dimuons are required to have pair p
T> 9 GeV, rapidity | y | < 2 and be in the invariant mass range 2 . 6 < m < 3 . 5 GeV. In addition to the muon triggered event sample, a minimum-bias triggered event sample and Monte Carlo (MC) simulated
1
ATLAS uses a right-handed coordinate system with its origin at the nominal interaction point in the centre of the detector and the
z-axis along the beam pipe. Thex-axis points from the interaction point to the centre of the LHC ring, and they-axis points upwards. Cylindrical coordinates
(r, φ)are used in the transverse plane,
φbeing the azimuthal angle around the
z-axis.
The pseudorapidity is defined in terms of the polar angle
θas
η=−ln tan
(θ/2
).
event samples were used for studies of the detector performance. Minimum-bias events are selected by requiring that they pass at least one of the two minimum-bias triggers. Prompt ( pp → J /ψ → µµ ) and non-prompt ( pp → b b ¯ → J/ψ → µµ ) samples of J/ψ were produced using Pythia 8.212 for event generation and Photos for electromagnetic radiation corrections [23, 24]. The A14 set of tuned parameters [25] is used together with CTEQ6L1 parton distribution function set [26]. The response of the ATLAS detector was simulated using Geant4 [27, 28]. Simulated events are overlaid on a sample of minimum-bias Pb+Pb events produced with HIJING 1.0 to replicate the high-multiplicity environment of heavy-ion collisions [29].
To characterize the Pb+Pb collision geometry, events are classified into centrality intervals determined by the summed transverse energy deposited in the FCal, Í
E
FCalT
, in each event. Centrality intervals are defined according to successive percentiles of the Í
E
FCalT
distribution ordered from the most central (the highest Í
E
FCalT
, the smallest impact parameter) to the most peripheral collisions (the lowest Í E
FCalT
, the largest impact parameter). The average number of nucleons participating in the collision, hN
parti , is calculated using a Glauber model analysis of the Í
E
FCalT
distribution [30, 31]. The centrality intervals used in this analysis are quoted together with hN
parti in Table 1.
3.2 Signal extraction and observable determination
The J /ψ v
2, the second order coefficient of the Fourier decomposition of the angular distribution, is estimated using the event-plane method [17]. The event-plane angle is estimated by its second order harmonic, Ψ
2, using the distribution of transverse energy deposited in the forward calorimeters. Similar methods are described in detail for previous azimuthal anisotropies analyses of charged hadrons with the ATLAS detector [11–13]. To reduce autocorrelations in the event-plane analysis, v
2is measured by correlating J /ψ with positive (negative) pseudorapidity with the event-plane angle measured using the FCal in the negative (positive) η -region. The prompt and non-prompt J/ψ yields are obtained using two-dimensional fits of the invariant mass and pseudo-proper time. The azimuthal distributions of the prompt and non-prompt yields are fitted simultaneously to obtain the elliptic flow coefficients.
The second order harmonic of the event-plane angle is determined using measurements of transverse energy deposits in each FCal system positioned at η > 3 . 2 and η < − 3 . 2. The flow vector q q q
2= Í
w
i( cos ( 2 φ
i) x x x ˆ ˆ ˆ + sin ( 2 φ
i) y y y) ˆ ˆ ˆ , where φ
iis the azimuthal coordinate of the i
thcalorimeter layer and w
iis a weight that equals the transverse energy deposited in the calorimeter layer. It is determined in both the positive and negative rapidity regions. The event-plane angle is then determined as 2 Ψ
2= tan
−1(q q q
2· y y y/q ˆ ˆ ˆ q q
2· x x x) ˆ ˆ ˆ .
To ensure the uniformity of the event-plane angle distribution, the raw flow vector is corrected by subtracting its mean value, obtained by averaging over all events in a given centrality interval, as q q q
2= q q q
raw2
−hq q q
raw2
i . Since the mean values hq q q
raw2
i are found to be independent of the collision centrality, the hq q q
raw2
i averaged over all analyzed events (centrality 0 − 60%) is used. Then the remaining modulations on the event- plane angle distribution are removed by including a shift δΨ
2= Í
kmaxk=1
( 1 /k) [A
2cos ( 2 k Ψ
2) + B
2sin ( 2 kΨ
2)]
[17]. The calculated coefficients A
2= −h sin ( 2 Ψ
2)i and B
2= h cos ( 2 Ψ
2)i are found to be centrality dependent up to k = 2, and the sum is performed up to k
max= 12. After these recentering and flattening corrections the event-plane angle distribution follows a uniform distribution.
The event-plane angle resolution, R , is determined using the two-sub-event method [17] and the minimum- bias event sample. Values of Ψ
2are determined on both sides of the detector and are used to calculate R = p
h cos ( 2 ∆Ψ
2)i , where ∆Ψ
2is the difference between the values of Ψ
2computed using the FCal
modules in the positive and negative η -region of the detector. The resulting event-plane resolution
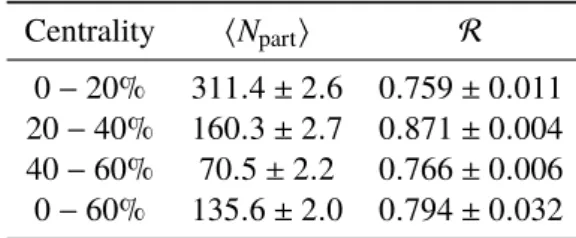
Centrality hN
parti R 0 − 20% 311 . 4 ± 2 . 6 0 . 759 ± 0 . 011 20 − 40% 160 . 3 ± 2 . 7 0 . 871 ± 0 . 004 40 − 60% 70 . 5 ± 2 . 2 0 . 766 ± 0 . 006 0 − 60% 135 . 6 ± 2 . 0 0 . 794 ± 0 . 032
Table 1: The average number of participating nucleons, hN
parti , and the event-plane resolution, R , values with their total uncertainties in each centrality interval.
strongly depends on centrality, with worse resolution at low and high Í E
FCalT
and better values at mid Í E
FCalT
. The resolution is calculated in minimum-bias events in very fine bins of transverse energy. The average value of the resolution in wider bins must account for the different Í
E
FCalT
distribution of the sample of events containing J/ψ candidates. Thus, the event-plane resolution is weighted by the number of J/ψ candidates in a given centrality interval relative to the number of minimum-bias events in the same interval. The values of R for the centrality intervals used in this analysis are shown in Table 1.
To account for the detector effects, each dimuon candidate is corrected for trigger efficiency,
trig, recon- struction efficiency,
reco, and detector acceptance, A . These three quantities form a per-dimuon weight:
w
−1= A ×
trig×
reco. (2)
Trigger and reconstruction efficiencies are studied using the tag-and-probe method [32] in data and in MC simulation as a function of the muon p
Tand η . Reconstruction efficiency increases from low to high p
Tand decreases from central to forward rapidities, becoming constant at p
T> 6 GeV with a maximum efficiency of about 90%. Trigger efficiency increases from low to high p
Tand from central to forward rapidities, increasing from 50% to 85% between the lowest and highest dimuon p
T. The acceptance is studied from MC simulations. It is defined as the probability that the J/ψ decay products fall within the fiducial volume p
T(µ) > 4 GeV and |η(µ)| < 2.4 and assumes unpolarized J /ψ production [33–35].
A detailed description of the performance studies are presented in Reference [2]. The efficiencies and acceptance are independent of 2 |φ − Ψ
2| and the raw yields could be used since their azimuthal modulation would appear to be not affected by corrections. Nevertheless, the expected p
Tdependence of the flow signal requires the correct evaluation of the p
Tdistributions, given that these efficiencies strongly depend on p
Tand thus can modify the observed v
2.
The separation of the prompt and non-prompt J /ψ signals is performed using the pseudo-proper decay time, τ = L
xym
J/ψ/p
T, where L
xyis the distance between the position of the dimuon vertex and the primary vertex projected onto the transverse plane, m
J/ψ= 3 . 096 GeV is the value of the J /ψ mass [36], and p
Tis the transverse momentum of the dimuon system.
The corrected two dimensional distribution of the number of events as a function of pseudo-proper time and dimuon invariant mass is used to determine the prompt and non-prompt J/ψ yields. The probability distribution function (PDF) for the fit is defined as a sum of five terms, where each term is the product of functions that depend on the dimuon invariant mass or pseudo-proper decay time. The PDF is written in a compact form as:
P(m, τ) = Õ
5i=1
N
if
i(m) · h
i(τ) ⊗ g (τ), (3)
i Type Source f
i(m) h
i(τ) 1 Signal Prompt ω CB
1(m) + ( 1 − ω) G
1(m) δ(τ) 2 Signal Non-prompt ω CB
1(m) + ( 1 − ω) G
1(m) E
1(τ)
3 Background Prompt E
2(m) δ(τ)
4 Background Non-prompt E
3(m) E
4(τ)
5 Background Non-prompt E
5(m) E
6(|τ|)
Table 2: Individual components of the PDF in the default fit model used to extract the prompt and non-prompt contribution for J/ψ signal and background. CB and G are the Crystal Ball and Gaussian distribution functions respectively, ω is the relative fraction of the CB and G terms, E is an exponential, and δ(τ) is the Dirac delta function.
where N
iis the normalization factor of each component, f
i(m) and h
i(τ) are distribution functions of the invariant mass, m , and the pseudo-proper time, τ , respectively; g(τ) is the resolution function described with a double Gaussian; and the ⊗ -symbol denotes a convolution. The PDF terms are defined by Crystal Ball (CB) [37], Gaussian (G), Dirac delta ( δ ), and exponential (E) distributions as specified in Table 2.
The signal invariant mass shapes are described by the sum of a CB and a single Gaussian with a common mean. The width term in the CB function is equal to the Gaussian standard deviation times a scaling term.
The CB left-tail and height parameters are fixed from MC studies and variations of the two parameters are considered as part of the fit model systematic uncertainties. The relative fraction of the CB and Gaussian functions, ω , is free in the fit. The prompt background contribution to the invariant mass spectrum follows a nearly flat distribution, and is modeled by an exponential. The non-prompt contribution to the background requires two exponential functions.
The pseudo-proper decay time of the prompt signal is modeled with a Dirac delta function, while the non-prompt signal is described by a single sided exponential. The backgrounds are represented by the sum of one prompt component and two non-prompt components. The prompt background component is described by a Dirac delta function. One of the non-prompt background contributions is described by a single-sided decay model (for positive τ only), and the other is described by a double-sided decay model accounting for candidates of mis-reconstructed or non-coherent dimuon pairs resulting from other Drell-Yan muons and combinatorial background. A double Gaussian resolution function, g (τ) , is used in convolution with the background and signal terms. These resolution functions have a fixed mean at τ = 0 and free widths.
The important quantities extracted from the fit are: the number of signal candidates, N
signal, and fraction of signal that is non-prompt, f
NP. These are used to build azimuthal distributions of the prompt and non-prompt yields, as the fits are done in intervals of 2 |φ − Ψ
2| , p
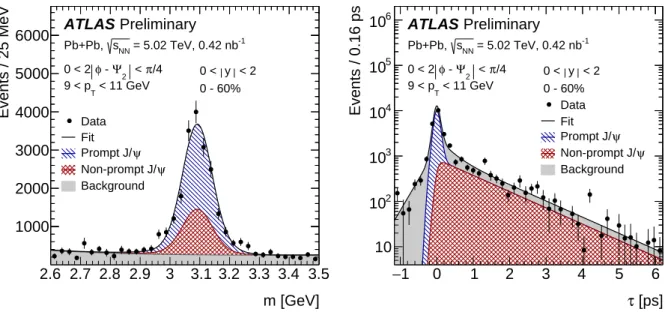
T, y and the collision centrality. Example plots of fit projections are shown in Figure 1. The prompt and non-prompt signals are obtained from the fit as:
N
prompt= N
signal( 1 − f
NP) , (4)
N
non-prompt= N
signalf
NP. (5)
While the total signal and the non-prompt fraction are weakly correlated, approximately less than 1%,
an artificial correlation is introduced when transforming these variables to the prompt and non-prompt
yields. The sum of both yields is constrained to the total number of signal candidates. To compute the
correlation factor a toy Monte Carlo model is implemented using the same fit model and the output of
the fits to data in bins of relative azimuthal angle, p
T, rapidity and centrality. The correlation varies with
2.6 2.7 2.8 2.9 3 3.1 3.2 3.3 3.4 3.5 m [GeV]
1000 2000 3000 4000 5000 6000
Events / 25 MeV
ATLAS Preliminary
= 5.02 TeV, 0.42 nb-1
sNN
Pb+Pb, π/4 <
Ψ2
φ - 0 < 2
< 11 GeV 9 < pT
< 2 y 0 <
0 - 60%
Data Fit
ψ Prompt J/
ψ Non-prompt J/
Background
− 1 0 1 2 3 4 5 6
[ps]
τ 10
10
210
310
410
510
6Events / 0.16 ps
ATLAS Preliminary
= 5.02 TeV, 0.42 nb-1
sNN
Pb+Pb, π/4 <
Ψ2
φ - 0 < 2
< 11 GeV 9 < pT
< 2 y 0 <
0 - 60%
Data Fit
ψ Prompt J/
ψ Non-prompt J/
Background
Figure 1: Fit projections of the two-dimensional invariant mass and pseudo-proper decay time for the signal extraction for the first azimuthal bin and 9 < p
T< 11 GeV, 0 < |y| < 2 and 0 - 60% centrality.
p
Tfrom -18% to -24%; in rapidity from -22% to -16%; and is approximately constant as a function of centrality. The average correlation coefficient is -20% for all slices and azimuthal bins with a variation of about 2%. It is important to note that this correlation is merely due to the procedure used to extract the yields from the invariant mass and pseudo-proper decay time distributions.
The elliptic flow coefficient is computed by fitting the prompt and non-prompt yields simultaneously to:
d N
d ( 2 |φ − Ψ
2|) = N
0( 1 + 2v
fit2cos ( 2 |φ − Ψ
2|)), (6) in order to account for the anti-correlation between both signals. This is achieved by minimizing the χ
2function:
χ
2(θθθ) = (yyy − µµµ(θθθ))
TV
−1(yyy − µµµ(θθθ)), (7) where yyy is the vector of measurements, µµµ(θθθ) is the vector of predicted values with parameters θθθ , and V is the error matrix. The elements of the vector of measurements are the prompt and non-prompt yields consecutively; the vector of predicted values is given by Equation 6 with the set of free parameters {N
0, v
fit2
}
promptand {N
0, v
fit2
}
non-promptfor the modeling of the prompt and non-prompt yields respectively.
The elements in the diagonal of V are the yields uncertainties and the off diagonal terms are the correlation terms between the prompt and non-prompt yields.
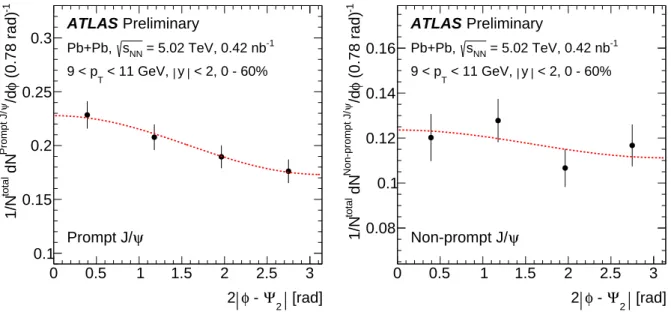
An example of the J/ψ yields normalized to the inclusive J /ψ yield and the projection of fit result is shown in Figure 2. The simultaneous fit of the prompt and non-prompt yields correctly accounts for the correlation between both signals that arose from the modeling used for the signal extraction. The correlation between the fit parameters as result of the simultaneous fit procedure is shown in Figure 3.
In a final step, the fitted value of v
fit2
, is corrected for the event-plane resolution:
v
2= v
fit2
/R. (8)
0 0.5 1 1.5 2 2.5 3 [rad]
Ψ
2φ - 2 0.1
0.15 0.2 0.25 0.3
-1
(0.78 rad) φ /d
ψPrompt J/dN
total1/N
ATLAS Preliminary
= 5.02 TeV, 0.42 nb-1
sNN
Pb+Pb,
< 2, 0 - 60%
y < 11 GeV, 9 < pT
ψ Prompt J/
0 0.5 1 1.5 2 2.5 3
[rad]
Ψ
2φ - 2 0.08
0.1 0.12 0.14 0.16
-1
(0.78 rad) φ /d
ψNon-prompt J/dN
total1/N
ATLAS Preliminary
= 5.02 TeV, 0.42 nb-1
sNN
Pb+Pb,
< 2, 0 - 60%
y < 11 GeV, 9 < pT
ψ Non-prompt J/
Figure 2: The azimuthal distribution of prompt (left) and non-prompt (right) J/ψ yields for the lowest p
Tbin studied.
The yields are normalized to the inclusive J/ψ signal and the uncertainties are fit uncertainties associated to the signal extraction. The red line is the result of the simultaneous fit used to compute v
2.
− 0.2 − 0.1 0 0.1 0.2 0.3
fit
v
2ψ Prompt J/
− 0.2
− 0.1 0 0.1 0.2
fit
v ψ Non-prompt J/
20.3
ATLAS Preliminary
= 5.02 TeV, 0.42 nb-1
sNN
Pb+Pb,
< 2, 0 - 60%
y < 11 GeV, 9 < pT
Fit result
Fit uncertainty contours σ 123σ4σ5σσ
Figure 3: The error analysis for the fitted values of the prompt and non-prompt J/ψ v
2. Each contour line represents
1 σ in the error definition of the fit parameters. For this bin, prompt J/ψ v
2has a significance of 3 σ and non-prompt
J/ψ has a significance of 1 σ .
3.3 Systematic Uncertainties
The systematic uncertainties of this measurement are classified into three groups: (a) related to the centrality definition, (b) related to the estimation of the event-plane method, and (c) related to extraction of the signal. The assigned systematic uncertainty from each source is defined as the root mean square along p
T, rapidity or centrality of the difference between the nominal and systematic variation values of the elliptic flow coefficient.
The centrality intervals are defined using cuts in Í E
FCalT
. These cuts have an uncertainty associated primarily with the ambiguity in the composition of peripheral events [38]. To test the sensitivity of the results to this uncertainty, an alternate centrality definition is derived, and the analysis is repeated. These changes affect the number of dimuon candidates entering in the signal fitting procedure and thus have an impact on the final value of v
2. For the v
2measurements as a function of p
Tor rapidity the uncertainty is about 2% for both prompt and non-prompt J/ψ v
2, while for the centrality dependence this source contributes 10% of systematic uncertainty for both v
2measurements.
For the estimation of the event-plane angle, the calibration coefficients for the recentering of the flow vector are calculated using a 20% narrower centrality interval instead of the full centrality range. For the evaluation of δΨ
2the sum limit is changed to k
max= 4. No significant differences are observed, therefore the systematic uncertainty is neglected. For the event-plane resolution, the three-sub-event method is used as an alternative method to compute R using the electromagnetic and hadronic calorimeters in the full η -range for the determination of the event-plane angle and its comparison with its value as determined in each side of the FCal [17]. The two methods give consistent results for collisions in the 0 − 60%
centrality interval. To account for the different E
Tdistribution in minimum-bias and J/ψ triggered events, the difference between the resolution computed in each dataset is assigned as systematic uncertainty and it is the dominant source of uncertainty. The total uncertainty for the average event-plane resolution adds a 4% of correlated uncertainty for the measurements integrated over centrality, while for the centrality dependence each point has an approximate 1 . 5% uncertainty due to resolution. In the centrality interval considered in this analysis (0 − 60%), it is found that the uncertainty related to the centrality definition has no effect on the event-plane resolution.
Variations to the PDF defined for the signal extraction are studied as well. Many modifications are considered, with the most important being: the release of the α -parameter of the CB [37], which is fixed from MC studies, the substitution of the Gaussian + CB by a single CB, and variations of the Gaussian standard deviation and CB width scaling parameter; while for the time part a single exponential is replaced by short and long lifetime exponential decays, and one Gaussian instead of two is considered for time resolution. Among all of these variations the biggest contribution is the release of the α -parameter of the CB function, which contributes between 10% and 15% uncertainty for the p
Tand rapidity dependence of v
2and up to 20% for the centrality dependence. Variations to the case of unpolarized J/ψ production are studied for different spin alignment cases and are covered by a theoretical uncertainty on v
2of 3% for prompt J/ψ and 4% for non-prompt J /ψ .
The choice of the mass window used for the study is changed to analyze potential biases from the mass peak of the ψ( 2S ) . At high rapidity its width increases and the fit response for the background estimation changes. The mass window range is narrowed to 2 . 7 < m < 3 . 4 GeV and its impact is between 5% and 10% for all three projections.
The correlation between prompt and non-prompt yield is also studied. It is either doubled or neglected,
and show a minor impact of 1% for all presented results.
10 15 20 25 30 [GeV]
pT
0 0.05 0.1 0.15 0.2
2v ATLAS Preliminary
= 5.02 TeV, 0.42 nb-1
sNN
Pb+Pb,
< 2, 0 - 60%
y ψ, Prompt J/
10 15 20 25 30
[GeV]
pT
0 0.05 0.1 0.15 0.2
2v ATLAS Preliminary
= 5.02 TeV, 0.42 nb-1
sNN
Pb+Pb,
< 2, 0 - 60%
y ψ, Non-prompt J/
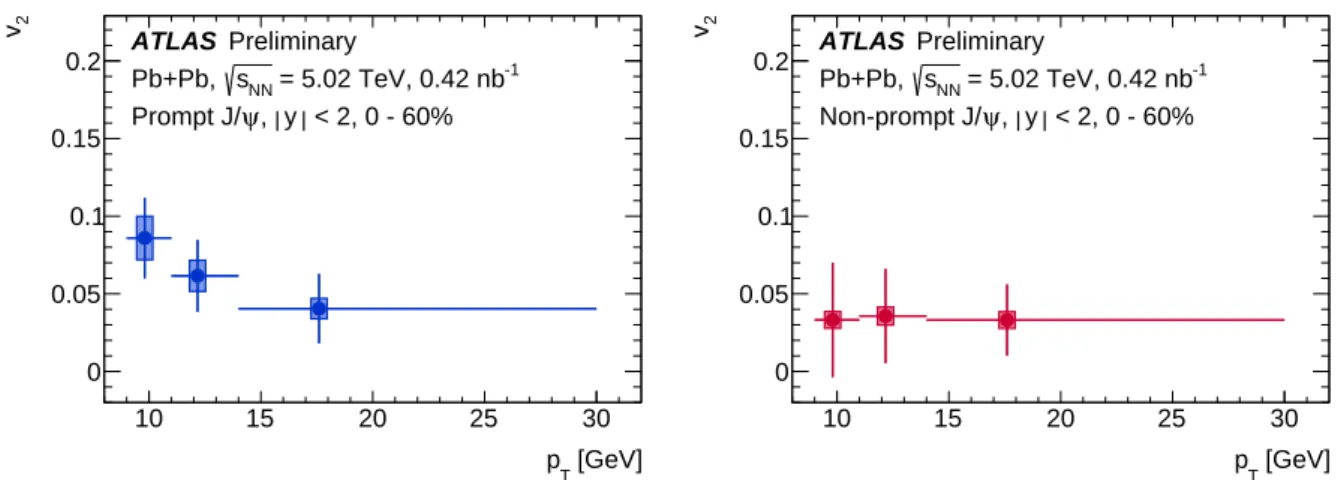
Figure 4: Prompt J/ψ v
2(left) and non-prompt J/ψ v
2(right) as a function of transverse momentum for the rapidity interval | y| < 2 and centrality 0 − 60%. The statistical error and systematic uncertainties are shown using error bars and boxes respectively.
4 Results
Results of v
2for prompt and non-prompt J/ψ are shown as a function of p
Tin Figure 4, for three p
Tintervals. The centroid of each p
Tbin is determined by the average p
Tof the muon pairs in the corresponding bin. The horizontal error bars correspond to the bin width reflecting the kinematic range of the measurement. The vertical error bars are the fit errors, which account for statistical uncertainties, and the shaded box is the systematic uncertainty. The data is consistent with a non-zero flow signal in the full kinematic range studied (9 < p
T< 30 GeV) for both prompt and non-prompt J/ψ . Prompt J/ψ exhibit a decreasing trend with a maximum value of v
2close to 0.09 that decreases by nearly a factor of two over the whole studied kinematic range. The results for non-prompt J/ψ indicate a non-zero value with limited statistical significance. These are consistent with a constant along p
Tand compatible within uncertainties with the v
2values of prompt J/ψ particularly at the highest p
T.
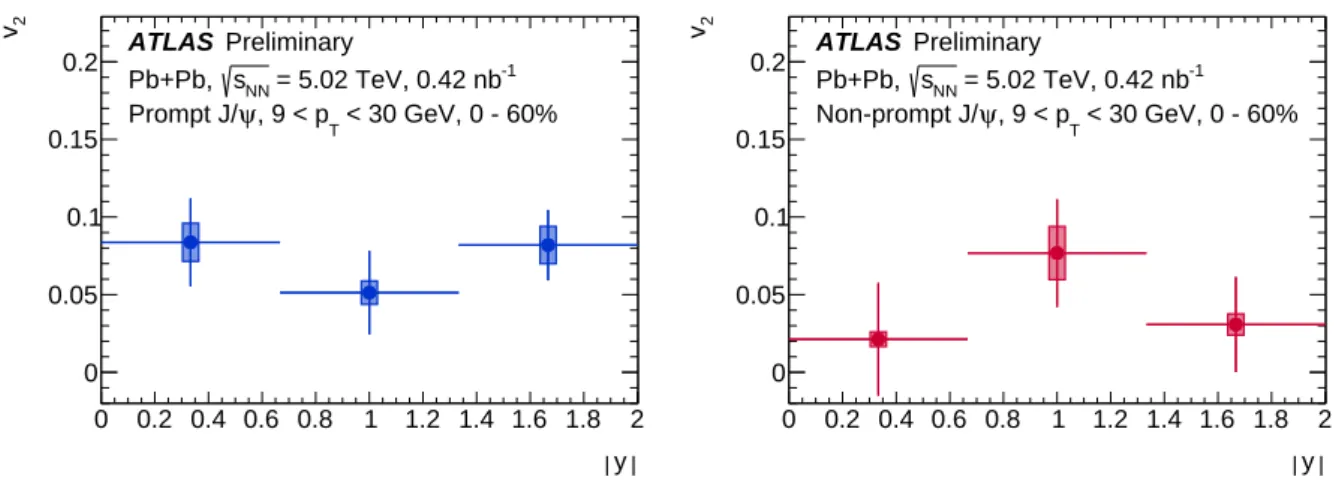
The rapidity dependence of v
2is shown in Figure 5 and the centrality dependence in Figure 6 for both prompt and non-prompt J/ψ . Neither mode shows significant rapidity or centrality dependence. The prompt J/ψ v
2is larger than the non-prompt, in agreement with the larger values observed in the p
Tdependence integrated over rapidity and centrality.
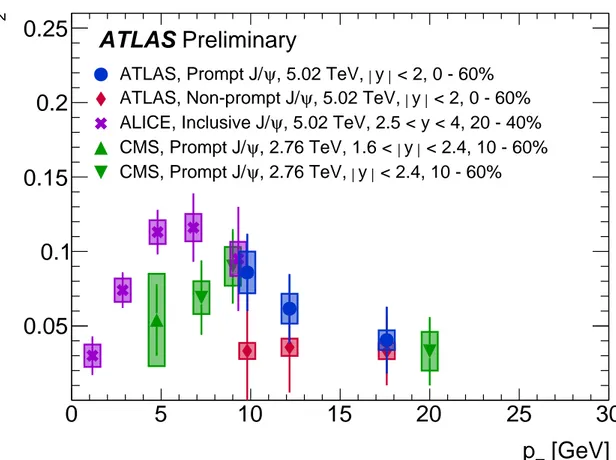
In Figure 7 the available results for inclusive J/ψ ( p
T< 12 GeV) from ALICE [4] and prompt J/ψ (4 < p
T< 30 GeV) from CMS [5] are compared with the results obtained in this analysis for 6 . 5 < p
T< 30 GeV.
Despite different rapidity selections, the ATLAS data is found to be in reasonable agreement with ALICE
data at 5 . 02 TeV and CMS data at 2 . 76 TeV [4, 5] in the overlapped p
Tregion.
0 0.2 0.4 0.6 0.8 1 1.2 1.4 1.6 1.8 2 y 0
0.05 0.1 0.15 0.2
2v ATLAS Preliminary
= 5.02 TeV, 0.42 nb-1
sNN
Pb+Pb,
< 30 GeV, 0 - 60%
, 9 < pT
ψ Prompt J/
0 0.2 0.4 0.6 0.8 1 1.2 1.4 1.6 1.8 2 y 0
0.05 0.1 0.15 0.2
2v ATLAS Preliminary
= 5.02 TeV, 0.42 nb-1
sNN
Pb+Pb,
< 30 GeV, 0 - 60%
, 9 < pT
ψ Non-prompt J/
Figure 5: Prompt J/ψ v
2(left) and non-prompt J/ψ v
2(right) as a function of rapidity for transverse momentum in the range 9 < p
T< 30 GeV and centrality 0 − 60%. The statistical error and systematic uncertainties are shown using error bars and boxes respectively.
50 100 150 200 250 300 350
part〉
〈N 0
0.05 0.1 0.15 0.2
2v ATLAS Preliminary
= 5.02 TeV, 0.42 nb-1
sNN
Pb+Pb,
< 2 y < 30 GeV, , 9 < pT
ψ Prompt J/
40-60% 20-40% 0-20%
50 100 150 200 250 300 350
part〉
〈N 0
0.05 0.1 0.15 0.2
2v ATLAS Preliminary
= 5.02 TeV, 0.42 nb-1
sNN
Pb+Pb,
< 2 y < 30 GeV, , 9 < pT
ψ Non-prompt J/
40-60% 20-40% 0-20%