ATLAS-CONF-2013-095 31August2013
ATLAS NOTE
ATLAS-CONF-2013-095
August 30, 2013
Measurement of χc1 and χc2 production with √
s = 7 TeV ppcollisions at ATLAS
The ATLAS Collaboration
Abstract
The prompt and non-prompt production cross sections for the χc1and χc2charmonium states are measured in ppcollisions at √
s = 7 TeV with the ATLAS detector at the LHC using 4.5 fb−1of integrated luminosity. The χcstates are reconstructed through the radiative decay χc → J/ψ γ(withJ/ψ → µ+µ−) where photons are reconstructed from γ → e+e− conversions. The production rate of the χc2state relative to the χc1 state is measured for prompt and non-prompt χcas a function ofJ/ψtransverse momentum. The prompt χccross sections are combined with existing measurements of promptJ/ψproduction to derive the fraction of promptJ/ψproduced in feed-down from χcdecays. The fractions ofχc1and χc2 produced inb-hadron decays are also measured. In addition to measurements of inclusive χc production, the branching fractionB(B±→ χc1K±)=(4.8±0.6 (stat.)±0.6 (syst.))×10−4 is measured with the same dataset and χcevent selection.
c Copyright 2013 CERN for the benefit of the ATLAS Collaboration.
Reproduction of this article or parts of it is allowed as specified in the CC-BY-3.0 license.
1 Introduction
The study of heavy quarkonium production in hadronic collisions offers a unique insight into the dy- namics of the strong interaction. However, understanding the hadronic production of quarkonium states within Quantum Chromodynamics (QCD) has been a long-standing challenge, complicated by the pres- ence of several important energy scales [1]. While the production of a heavy quark pair is generally a high energy process that can be well described perturbatively, the energy scale associated with the evolu- tion of a heavy quark pair into a physical bound state is much lower and cannot be studied reliably with a perturbative calculation.
Understanding the hadronic production of the charmonium states is particularly challenging as the mass of the charm quark is such that the modelling of the bound state as a simple non-relativistic system is less well motivated than for the heavier bottomonium system. Several theoretical approaches have been developed to describe hadronic charmonium production, though the wealth of measurements that now exist are not adequately described by any single theoretical approach [2].
The χcJ(1P) states (with J = 0,1,2) are the only triplet of P-wave states below the open-charm threshold. The spectroscopy of these states is characterised by small hyperfine mass splittings and the branching fractions for the decays B(χcJ → J/ψ γ) are large for the J = 1,2 states (34.4% and 19.5%
respectively), while the corresponding branching fraction for theJ=0 state is significantly lower (1.3%) [3]. The χcJ states may be produced directly in hadronic collisions or through the decay of higher mass quarkonium states; these production modes are referred to as prompt. In addition to prompt production, the decay chains of b-hadrons can also produce χcJ states; these production modes are referred to as non-prompt.
The high cross section for inclusive charmonium production and large data samples available at the Large Hadron Collider (LHC) allow the hadronic production of charmonium to be studied in detail. The inclusive production rate of prompt J/ψis the most experimentally accessible charmonium production observable at the LHC, with reconstruction of the decay J/ψ →µ+µ−being well suited to the hadronic environment. However, the comparison of experimental measurements with theoretical predictions is complicated by the large feed-down contributions from χcandψ(2S) decays. The direct component of the inclusive J/ψ cross section, produced in the primary ppinteraction, can be obtained only if these feed-down contributions are precisely quantified. An understanding of χc production is therefore a crucial component of any general description of charmonium production at the LHC. Furthermore, χc production observables, such as the relative production rate of the χc1and χc2states, represent sensitive probes of the prompt charmonium production mechanism that can provide complementary information to the study of theS-wave states.
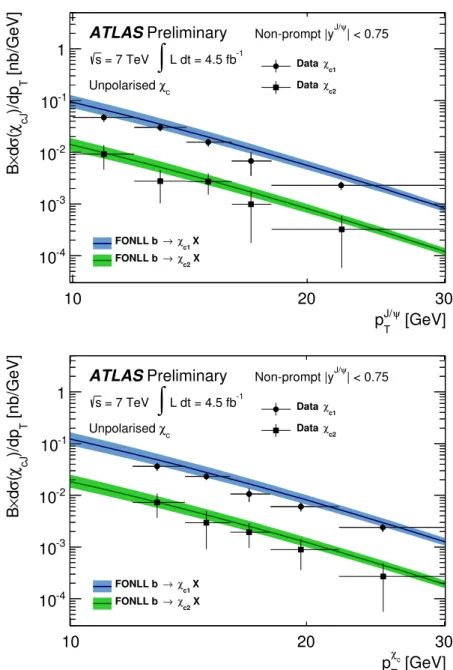
The production of charmonium states in b-hadron decays can be used as a proxy observable for studyingbquark production at the LHC. Theoretical predictions ofbquark production can be combined with fragmentation functions and inclusiveHb →c¯cXmomentum spectra (whereHbdenotes ab-hadron andc¯cdenotes a charmonium state) extracted frome+e−collision data to provide direct predictions for non-prompt charmonium production [4, 5]. Such predictions have had much success in describing the measurements of non-promptJ/ψandψ(2S) production performed by the LHC experiments [6–8].
Various aspects of the production of χc states have been studied at the LHC [9–11] and at the Tevatron [12, 13]; however, measurements of the absolute production cross sections for prompt χc and studies of non-prompt χcproduction have not been previously performed at the LHC.
This note presents measurements of the inclusive production of the χc1and χc2states inppcollisions at a centre-of-mass energy √
s=7 TeV at the LHC. The χcstates are reconstructed through the radiative decays χcJ → J/ψ γ(with J/ψ → µ+µ−), where the photon is reconstructed through its conversion into an electron-positron (e+e−) pair. Photon conversions reconstructed in the ATLAS inner tracking detector offer the very good mass resolution needed to individually resolve the χc1 and χc2states. The
χc0production rate is not measured explicitly as the inclusive yield of χc0in the data sample used in this analysis is considered to be too small to perform a reliable measurement.
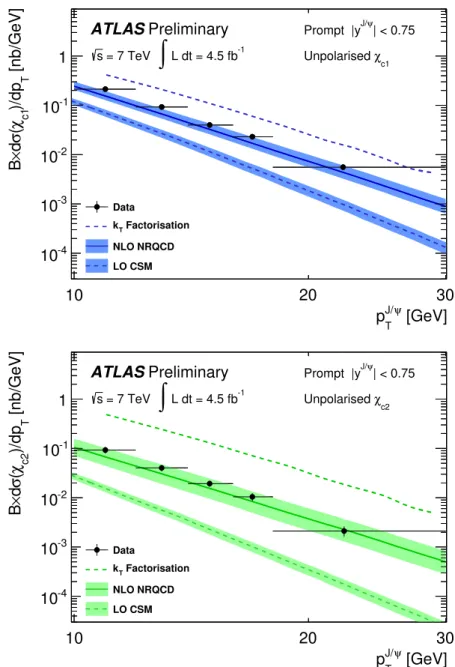
The inclusive production of the χc1and χc2states is separated experimentally into prompt and non- prompt components and measured differentially in both χctransverse momentumpχTcandJ/ψtransverse momentum pJ/ψT , within the rapidity region |yJ/ψ| < 0.75. The results measured as a function of pTJ/ψ and pχTc are presented within the regions 10 ≤ pJ/ψT < 30 GeV and 12 ≤ pχTc < 30 GeV respectively.
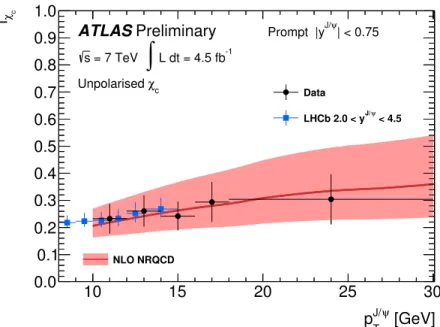
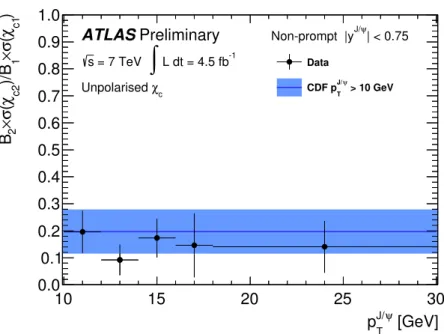
These new measurements are combined with existing measurements of inclusive J/ψproduction [6] to determine the fraction of promptJ/ψproduced in feed-down from χcdecays. The ratioσ(χc2)/σ(χc1) is a useful theoretical quantity as it is sensitive to the presence of possible colour octet contributions to χc production [14]. This cross section ratio is measured as a function of pTJ/ψfor prompt χc1 and χc2 production. These measurements are compared to theoretical predictions and to the measurements of other experiments. The branching fractionB(B±→ χc1K±) is also measured with the same data sample and event selection.
2 The ATLAS Detector, Data and Monte Carlo Samples
The ATLAS detector [15] is a general purpose particle physics detector with a cylindrical geometry1 with forward-backward symmetric coverage in pseudorapidityη. The detector consists of inner tracking detectors, calorimeters and a muon spectrometer combined with a three-level trigger system.
The inner tracking detector (ID) is composed of a silicon pixel detector, a silicon microstrip detector (SCT) and a transition radiation tracker (TRT), which together cover the pseudorapidity range|η|<2.5.
The ID directly surrounds the beam pipe and is immersed in a 2 T axial magnetic field generated by a superconducting solenoid. The calorimeter system surrounds the solenoid and consists of a highly granular liquid-argon electromagnetic calorimeter and an iron-scintillator/tile hadronic calorimeter. The muon spectrometer (MS) surrounds the calorimeters and consists of three large air-core superconducting magnets (each with eight coils), which generate a toroidal magnetic field. The MS is instrumented in three layers with precision detectors (monitored drift tubes and cathode strip chambers) that provide precision muon tracking covering|η| < 2.7 and fast trigger detectors (resistive plate detectors and thin gap chambers) covering the range|η|<2.4.
The ATLAS trigger is a three-level system consisting of a level-1 trigger implemented in hardware and a software-based two-stage high level trigger (HLT). The data sample used in this analysis is collected with a di-muon trigger. The level-1 muon trigger system identifies regions of interest (RoIs) by searching for coincidences between hits in different trigger detector layers within predefined geometrical windows enclosing the paths of muons with a given set of transverse momentum thresholds. The level-1 system also provides a rough measurement of muon position with a spatial granularity of∆φ×∆η≈0.1×0.1. The level-1 RoI then serves as a seed for HLT algorithms that use higher precision MS and ID measurements to reconstruct muon trigger objects. The selection performed by the HLT algorithms is discussed in Section 3.
The measurements presented in this note are performed with a data sample corresponding to an integrated luminosity of 4.5 fb−1 collected during the 2011 LHC proton-proton run at a centre-of-mass energy √
s = 7 TeV. The selected events were collected under stable LHC beam conditions with the detector in a fully operational state.
Four Monte Carlo (MC) simulation samples are used to estimate the photon conversion reconstruc- tion efficiency and to characterise the modelling of the χc signal components used in the fitting proce-
1ATLAS uses a right-handed coordinate system with its origin at the nominal interaction point (IP) in the centre of the detector and thez-axis along the beam pipe. Thex-axis points from the IP to the centre of the LHC ring, and they-axis points upward. Cylindrical coordinates (r, φ) are used in the transverse plane,φbeing the azimuthal angle around the beam pipe. The pseudorapidity is defined in terms of the polar angleθasη=−ln tan(θ/2).
dure. The samples consist of simulated χc1 → J/ψ γ → µ+µ−γ and χc2 → J/ψ γ → µ+µ−γ decays produced either directly or through the process pp → bbX¯ → χcX′. All samples are generated with P6 [16] and use the ATLAS 2011 MC underlying event and hadronisation model tuning [17]. The response of the ATLAS detector is simulated using G4 [18, 19]. The events are reconstructed using the same algorithms used to process the data. Each χcevent is overlaid with a number of minimum-bias ppevents such that the overall distribution of additional ppinteractions due to pile-up in data events is accurately described by the simulated samples.
3 Event and χcCandidate Selection
Events are selected that pass a di-muon trigger in which the HLT identifies two oppositely charged muons, each with transverse momentum pT > 4 GeV. The HLT fits the two candidate muon tracks to a common vertex and a very loose requirement on the vertex χ2 is imposed. Finally, a broad di- muon invariant mass cut (2.5<m µ+µ−
< 4.0 GeV) is applied to select di-muon candidates consistent with J/ψ → µ+µ− decays. Each event passing the trigger selection is required to contain at least one reconstructed primary ppcollision vertex formed from at least three reconstructed tracks with pT >
400 MeV.
In the offline analysis, muon candidates are formed from reconstructed ID tracks matched to tracks reconstructed in the MS. Each muon track is required to be reconstructed from at least six SCT hits and one pixel detector hit. For the low-pT muons (typically below 20 GeV) produced in J/ψ → µ+µ− decays, the track parameters measured in the ID provide more accurate measurements than the MS as they are not affected by muon energy loss in the calorimeters. Therefore, the ID measurements alone are used to reconstruct the momentum of muon candidates. Events are required to contain at least one pair of oppositely charged muons, each with transverse momentum pTµ > 4 GeV and|ηµ| < 2.3. Each muon pair is fitted to a common vertex and a very loose vertex quality requirement (fully efficient for genuine J/ψ → µ+µ−decays) is imposed. The di-muon pair is considered a J/ψ → µ+µ−candidate if the invariant mass of the pair, calculated from the track parameters recalculated by the vertex fit, satisfies 2.95< m µ+µ−
< 3.25 GeV. The event and J/ψ →µ+µ−candidate are retained for further analysis if the two muon candidates reconstructed offline are consistent with the objects reconstructed by the HLT (matched within∆R= p
(∆φ)2+(∆η)2< 0.01). The rapidity of the offline reconstructedJ/ψcandidate is required to satisfy |yJ/ψ| < 0.75. This selection retains only the candidates reconstructed within the region of the detector with the optimal di-muon mass resolution, which is necessary to reliably resolve the individual χcJ states.
Photon conversions are reconstructed from pairs of oppositely charged ID tracks whose helices inter- sect when projected onto the transverse plane. Tracks must be reconstructed with transverse momentum pT > 400 MeV and|η| < 2.3 and contain at least six SCT hits. Track pairs consistent with the photon conversion hypothesis are fitted to a common vertex with their opening angle constrained to be zero. The vertex fit is required to converge withχ2per degree of freedom [d.o.f.] < 5. To reject fake conversions fromπ0 → e+e−γdecays and other promptly produced track pairs, the radial displacement rof the re- constructed conversion vertex with respect to the zaxis is required to satisfy 40 < r < 150 mm. The reconstruction efficiency for converted photons reconstructed from only ID tracks decreases significantly beyond the upper limit of 150 mm. This fiducial region includes the three layers of silicon pixels in the ID, and so selects conversions occurring within these silicon pixel layers. In this analysis, no information from the calorimeters is used in the reconstruction of photon conversions. The reconstructed momentum of the converted photon is calculated frome+e−track parameters recalculated by the vertex fit with the invariant mass constrained to be zero. Reconstructed converted photons are required to have transverse momentumpγT >1.5 GeV and|ηγ|<2.0.
Candidate χc → J/ψ γ→µ+µ−γdecays are selected by associating a reconstructed photon conver-
sion with a candidateJ/ψ →µ+µ−decay. To reject combinations ofJ/ψ →µ+µ−decays and photons not consistent with a χcdecay, the impact parameter of the converted photon with respect to the di-muon vertex is required to be less than 5 mm. This requirement has a negligible inefficiency for genuine χc decays.
4 Cross Section Determination
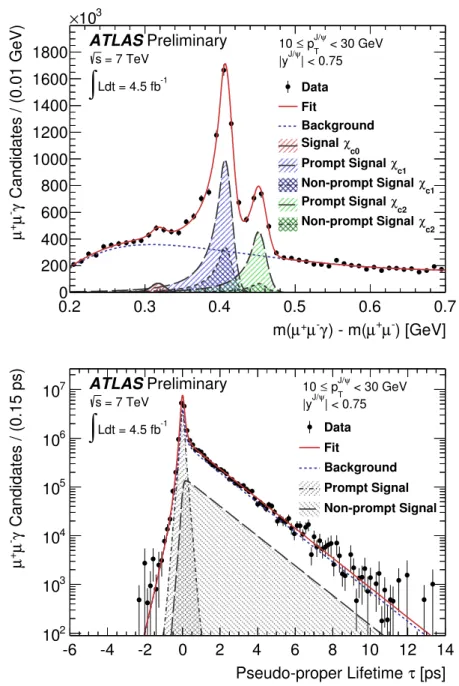
The distribution of mass difference ∆m = m µ+µ−γ
− m µ+µ−
is used to distinguish the χc1 and χc2states. This distribution is used in place of the three-body invariant mass as some partial cancella- tion of contributions from the di-muon mass resolution is achieved, resulting in improved overall mass resolution. Non-prompt χc candidates produced in the decays ofb-hadrons can be experimentally dis- tinguished from prompt χccandidates (produced in the primaryppinteraction) with the pseudo-proper decay time distributionτ. The pseudo-proper decay timeτis defined as:
τ= Lxy·mJ/ψ
|p~T| , (1)
wheremJ/ψis the world averageJ/ψmass andLxyis defined as Lxy= ~L·p~T
|p~T| , (2)
where ~Lis a vector pointing from the primary ppinteraction vertex to the J/ψ → µ+µ− decay vertex andp~T is the transverse momentum vector of theJ/ψ. The primary vertex with the highest trackP
p2T is used to calculateLxyon a per-candidate basis.
The differential χc1and χc2cross sections for prompt and non-prompt production in a given bin are measured from
dσ(χcJ)
d pχTc · B(χcJ → J/ψ γ)· B J/ψ→µ+µ−
= NJ
L ·∆pχTc , (3) whereLis the integrated luminosity,∆pχTcis the bin width inpχTcandNJis the acceptance- and efficiency- corrected χcJ yield for a given bin inpχTc. The same formula is also used to deduce the differential cross sections measured as a function ofJ/ψtransverse momentum withpχTcreplaced by pJ/ψT .
To obtain corrected prompt and non-prompt χc1and χc2yields, a weight is first determined for each χc candidate to correct for experimental efficiency and detector acceptance. Corrected yields are then extracted from a simultaneous two-dimensional unbinned maximum likelihood fit to the weighted mass difference∆mand pseudo-proper lifetimeτdistributions in bins of pχTc andpTJ/ψ. The differing produc- tion kinematics for prompt and non-prompt χc1 and χc2 result in a different detector acceptance and reconstruction correction for each yield. To account for these differences, the fit procedure is performed once for each measured yield, with the data weighted differently each time to accurately correct that particular yield. The correction weightwfor each χccandidate is calculated as
w−1 =A ·ǫtrig·ǫdi−muon·ǫconv, (4)
whereAis the detector acceptance,ǫtrigis the trigger efficiency,ǫdi−muonis the total muon reconstruction efficiency andǫconvis the total conversion reconstruction efficiency.
4.1 Acceptance
The detector acceptanceAis defined as the probability that final state decay products in a χc→J/ψ γ→ µ+µ−γ decay fall within the fiducial region defined by pTµ > 4 GeV and |ηµ| < 2.3 for muons and pγT >1.5 GeV and|ηγ|< 2.0 for photons. The acceptance depends strongly on the angular distributions of the decay products in their respective decay frames. The form of these angular distributions is a function of the polarisation of the χcJwith respect to a given axis.
The angular distribution of theµ+in theJ/ψrest frame for inclusive production is described by d2N
dcosθdφ ∝ 1 3+λθ
h1+λθcos2θ+λφsin2θcos 2φ+λθφsin 2θcosφi
, (5)
whereθandφare the polar and azimuthal angles respectively between theµ+and the chosen polarisation axis [20, 21]. Similarly, the angular distribution of the J/ψin the χcJ rest frame is described by
d2N
dcosΘdΦ ∝ 1 3+λΘ
h1+λΘcos2Θ +λΦsin2Θcos 2Φ +λΘΦsin 2ΘcosΦi
, (6)
whereΘandΦare the polar and azimuthal angles respectively between the J/ψand the chosen polar- isation axis [20, 21]. This distribution is valid for χc1, and is also valid for χc2 if contributions from higher-order multipoles to the radiative transition χc2 → J/ψ γare neglected (the E1 approximation).
This approximation is motivated by the fact that the current experimental data suggest that higher-order multipoles in bothJ=1,2 radiative decays represent less than 10% of the total amplitude [3]. The values of theλparameters in Equations 5 and 6 are determined by theJ/ψand χcpolarisations respectively.
For the radiative decay χc → J/ψ γ, it has been shown that the angular distribution of theµ+in the J/ψrest frame and the J/ψin the χc rest frame are identical (i.e. λΘ= λθ,λΦ= λφ,λΘΦ = λθφ) if one measures the anglesΘ,Φandθ, φwith respect to parallel polarisation axes [20, 21]. Furthermore, this choice of axes reduces the dependence of theλparameters in Equation 5 on the higher-order multipole contributions to the radiative transitions [20]. In this analysis, the helicity frame is used and the polari- sation axis is defined as the χcJline of flight in the laboratory frame. The dependence of the acceptance corrections on χc polarisation calculated with this system of axes and angular distributions is found to give results consistent with using the three angle cascade approach including all spin correlations de- scribed in Ref. [22] for the fiducial region used in this note.
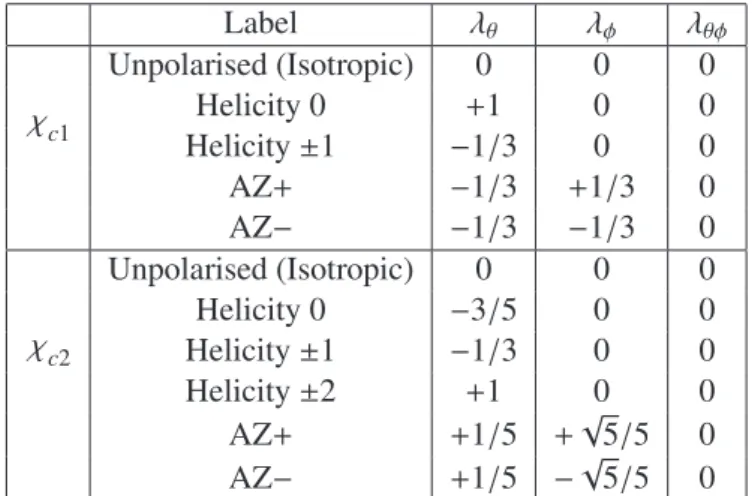
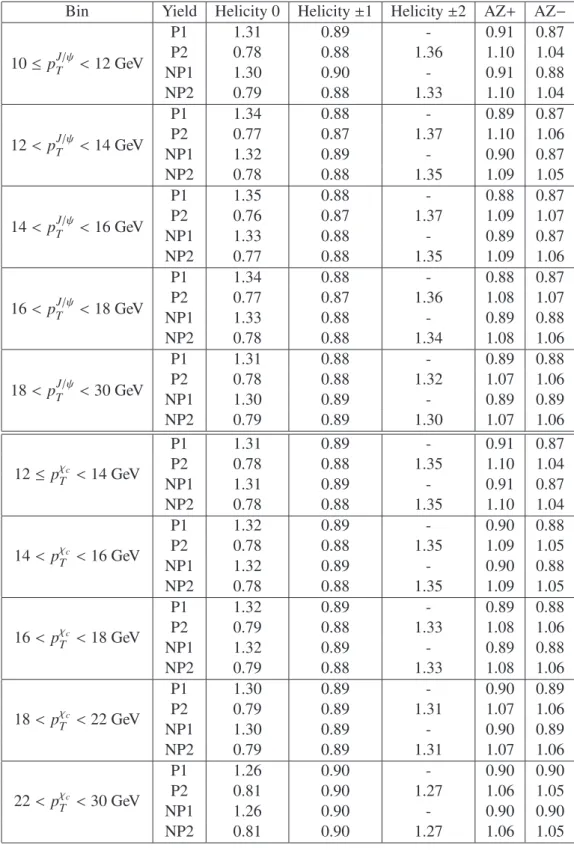
Scenarios are identified (four for χc1 and five for χc2) that span the allowed λ parameter space and give rise to the most extreme variations in the acceptance. These are detailed in Table 1. The scenarios correspond to the pure helicity eigenstates of the χc1and χc2 states along with two scenarios with an azimuthal anisotropy (AZ+ and AZ−). These scenarios are used to calculate the uncertainty envelope associated with polarisation effects. The central value for the acceptance has been calculated by assuming the χcJ are unpolarised, with isotropic angular distributions for the χc and J/ψ decays (λθ = λφ = λθφ = 0). Polarisation scenarios with non-zero values forλθφ are found to result in relative changes in the acceptance far below any of the scenarios shown in Table 1.
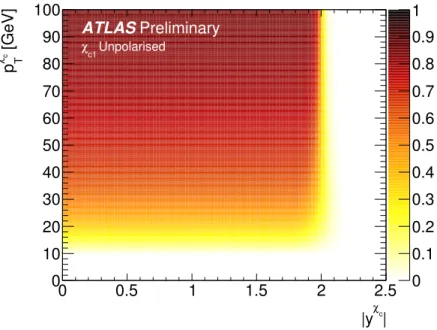
Two-dimensional acceptance maps binned inpχTc and|yχc|are derived for each polarisation scenario using a high statistics generator-level MC simulation. The angular distributions of the decays χc → J/ψ γand J/ψ → µ+µ− are generated according to Equations 5 and 6 with theλparameters shown in Table 1. Figure 1 shows the acceptance map for χc1 → J/ψ γ → µ+µ−γ decays calculated assuming unpolarised production. The acceptance is significantly reduced at high rapidity due to the fiducial cut
|ηγ| < 2.0. Since J/ψ → µ+µ− candidates are only reconstructed within |yJ/ψ| < 0.75, none of the reconstructed χccandidates approaches this region. The acceptance also decreases significantly towards low pχTcand is negligible belowpχTc <10 GeV.
The cross section measurements binned in pχTc are corrected directly with acceptance maps as de- scribed above. The acceptance correction for the measurements binned in pTJ/ψ is sensitive to the pχTc
Label λθ λφ λθφ
χc1
Unpolarised (Isotropic) 0 0 0
Helicity 0 +1 0 0
Helicity±1 −1/3 0 0
AZ+ −1/3 +1/3 0
AZ− −1/3 −1/3 0
χc2
Unpolarised (Isotropic) 0 0 0
Helicity 0 −3/5 0 0
Helicity±1 −1/3 0 0
Helicity±2 +1 0 0
AZ+ +1/5 +√
5/5 0
AZ− +1/5 −√
5/5 0
Table 1: The set of χc1and χc2polarisation scenarios studied.
spectrum used as input to the simulation and must be calculated with an alternative approach. Accep- tance corrections are derived for each measured pTJ/ψbin with the same simulation used to generate the acceptance maps, but with the χcdecays generated with a transverse momentum spectrum taken from a fitted parameterisation of the differential cross sections measured as a function of pχTc as presented in this note.
4.2 Trigger Efficiency
The di-muon trigger efficiency is determined fromJ/ψ→µ+µ−andΥ→µ+µ−decays in data using the method described in Ref. [23]. The di-muon trigger efficiencyǫtrigis defined as the efficiency with which the trigger system can select events that pass the full offline di-muon selection. The method factorises the total efficiency into three parts,
ǫtrig=ǫRoI
pµT1,q1·ηµ1
·ǫRoI
pµT2,q2·ηµ2
·cµ+µ− ∆R,|y(µ+µ−)|
, (7)
where ǫRoI is the efficiency with which the trigger system can identify a single muon with transverse momentumpTµand charge-signed pseudorapidityq·ηµas a RoI. The factorcµ+µ−is present to correct for inefficiencies associated with the di-muon aspects of the trigger. These include vertexing and opposite muon charge requirements and effects associated with the finite size of the muon RoI. The factorcµ+µ−
and the single muon efficiencyǫRoIare determined using a sample ofJ/ψ→µ+µ−decays selected with a single muon trigger with an 18 GeV transverse momentum threshold. ǫRoIis derived in two-dimensional bins of pµT andq·ηµ from the fraction of fittedJ/ψ →µ+µ−decays that pass the high-pT single muon trigger and that also pass the di-muon trigger selection (corrected for di-muon effects with cµ+µ−). The average total di-muon trigger efficiency forJ/ψ →µ+µ− decays with 10≤ pTJ/ψ < 30 GeV is between 50% to 60% for the fiducial region studied.
4.3 Muon Reconstruction Efficiency
The efficiency to reconstruct and identify both muons from the decay J/ψ →µ+µ−is described by the equation
ǫdi−muon =ǫtrk
pµT1, ηµ1
·ǫtrk
pµT2, ηµ2
·ǫµ
pµT1,q1·ηµ1
·ǫµ
pµT2,q2·ηµ2
. (8)
0 0.1 0.2 0.3 0.4 0.5 0.6 0.7 0.8 0.9 1
c|
|yχ
0 0.5 1 1.5 2 2.5
[GeV]cχ Tp
0 10 20 30 40 50 60 70 80 90 100
ATLASPreliminary
Unpolarised χc1
Figure 1: The acceptance for χc1→J/ψ γ→µ+µ−γdecays as a function ofpχTcand|yχc|. The quantity ǫtrk is the reconstruction efficiency for muon tracks subject to the ID track selection de- scribed in Section 3 and is determined to be (99±1)% over the full kinematic region studied [23]. The single muon identification efficiencyǫµ is derived from an analysis of a sample of J/ψ →µ+µ−decays in data, unbiased by any muon selection criteria as described in Ref. [23]. The muon identification ef- ficiency is binned in charge-signed pseudorapidityq·ηµ to account for the charge asymmetry in muon reconstruction due to the toroidal magnetic field. The muon identification efficiency reaches a plateau of around 98% for muons withpTµ >8 GeV.
4.4 Conversion Reconstruction Efficiency
The photon conversion reconstruction efficiencyǫconvis determined from the MC simulated χc →J/ψ γ event samples described in Section 2. The transverse momentum distribution of generated χc events in the samples is reweighted to reproduce the distribution observed in data. The decay products in the simulated samples of radiative χc decays are propagated through the full ATLAS detector simulation.
The description of the ID material distribution in the MC simulation samples is checked by comparing the distributions of various conversion observables (including conversion vertex fit χ2, vertex position and kinematic variables) measured in data and MC simulation. The distributions are found to be in good agreement and no significant discrepancies are observed. Studies of the ID material description in the MC simulation with secondary hadronic interactions also exhibit good agreement with data [24].
The total conversion reconstruction efficiencyǫconvis factorised into two parts, ǫconv=Pconv ηγ
·ǫrecoγ
pγT,|ηγ|
, (9)
wherePconvis the probability that a photon will convert within the fiducial region for conversions (40<
r < 150 mm) and ǫrecoγ is the efficiency of the conversion reconstruction algorithm. The conversion probabilityPconvis derived from the ratio of the number of generated photons from radiative χcdecays that convert in the fiducial region of the ID to the total number of photons from radiative χc decays.
Pconvis calculated in bins ofηγto account for changes in the detector material traversed for photons of
different pseudorapidity. No significant dependence ofPconvon photon energy is observed for photons within the kinematic fiducial region (pγT >1.5 GeV). The conversion probability varies from around 7%
to 11% within the fiducial region studied.
The conversion reconstruction efficiencyǫrecoγ is determined from the equation
ǫrecoγ =Nrecoγ /Nconvγ , (10)
where Nconvγ is the number of simulated photons from radiative χc decays that convert in the fiducial region of the ID andNrecoγ is the number of reconstructed photon conversions. This ratio is calculated in bins of pγT and|ηγ|as no significant asymmetry in photon pseudorapidity is observed. The conversion reconstruction efficiency is around 25% at pγT = 1.5 GeV and approaches a plateau of approximately 35% for pγT >5.0 GeV.
4.5 Extraction of Corrected Yields
Corrected χcJyields are extracted by performing a simultaneous fit to the mass difference
∆m=m µ+µ−γ
−m µ+µ−
and pseudo-proper timeτdistributions of weighted χccandidates. Separate unbinned maximum likelihood fits are performed in bins of both J/ψ candidate transverse momentum pJ/ψT and χc candidate transverse momentum pχTc. The fits are performed within the χcsignal region of 0.2<∆m<0.7 GeV and no restriction onτis applied. The full probability density function (PDF) used to perform the fits has the form:
F(∆m, τ, δτ)= fSig·FSig(∆m, τ, δτ)+ 1− fSig
·FBkgd(∆m, τ, δτ), (11) where fSig is the fraction of χc signal candidates determined by the fit, whileFSig andFBkgdare PDFs that respectively model the signal and background components of the mass difference and pseudo-proper time distributions. The quantityδτis the per-candidate uncertainty on the pseudo-proper time calculated from the covariance matrix of the di-muon track vertex fit. The distributions of the pseudo-proper time uncertaintyδτobserved in the background (∆m< 0.3 GeV or∆m> 0.48 GeV) and signal (background subtracted within 0.3 < ∆m < 0.48 GeV) regions are found to be consistent within their uncertainties.
Consequently, PDF terms for the δτdistribution factorise in the likelihood and are not included in the combined PDF used in the fit [25].
The signal PDFFSigis composed of a number of components:
FSig(∆m, τ, δτ)=fSigP ·h
f0P·M0(∆m)+ 1− f0P
·
f1P·M1(∆m) +
1− f1P
·M2(∆m)i
·TSigP (τ, δτ) +
1− fSigP
·h
f0NP·M0(∆m)+
1− f0NP
·
f1NP·M1(∆m) +
1− f1NP
·M2(∆m)i
·TSigNP(τ, δτ) ,
(12) where the PDFs MJ(∆m) model the χcJ signal components of the∆mdistribution andTSig(N)Pmodel the (non-)prompt χc signal contributions to the pseudo-proper lifetime distribution. The parameter fSigP is the fraction of the total χc signal that is promptly produced, f0(N)Pis the fraction of (non-)prompt signal identified as χc0and f1(N)Pis the fraction of (non-)prompt signal (excluding χc0contributions) identified as χc1.
The χc1 and χc2 signals M1,2(∆m) are each described by Crystal Ball (CB) functions [26]. The CB function is characterised by a Gaussian core with a widthσi(associated with the PDF Mi(∆m)) and