ATLAS-CONF-2012-069 06July2012
ATLAS NOTE
ATLAS-CONF-2012-069
July 2, 2012
Search for anomalous production of prompt like-sign lepton pairs with the ATLAS detector
The ATLAS Collaboration
Abstract
An inclusive search for anomalous production of two prompt, isolated leptons with the same electric charge is presented. The search is performed in a data sample corresponding to 4.7 fb
−1of integrated luminosity collected in 2011 at
√s=7 TeV by the ATLAS detector at the LHC. Pairs of high-
pTleptons (e
±e±and
µ±µ±) are selected and the dilepton invariant mass distribution is examined for any deviation from the Standard Model background ex- pectation. No excess is found, and upper limits on the production of like-sign lepton pairs due to contributions from physics beyond the Standard Model are placed as a function of the dilepton mass within a fiducial region close to the experimental selection cuts. The 95%
confidence level upper limits on the cross section of anomalous
e±e±or
µ±µ±production range between 1.7 fb and 45.7 fb depending on the dilepton mass and flavour combination.
c Copyright 2012 CERN for the benefit of the ATLAS Collaboration.
Reproduction of this article or parts of it is allowed as specified in the CC-BY-3.0 license.
1 Introduction
Events containing two prompt, high-transverse momentum ( p
T) leptons of equal electric charge are rarely produced in the Standard Model (SM) but occur with an enhanced rate in many models of new physics.
For instance, left-right symmetric models [1–4], Higgs triplet models [5–7], the little Higgs model [8], fourth-family quarks [9], supersymmetry [10], universal extra dimensions [11], and the Zee-Babu neu- trino mass model [12–14] may produce final states with two same-charge leptons.
In the analysis described here, pairs of isolated, high-p
Tleptons are selected and the invariant mass of the dilepton system (e
±e
±and µ
±µ
±) is examined inclusively and separately for positively- and negatively-charged pairs.
The ATLAS Collaboration has previously reported inclusive searches for new physics in the like-sign dilepton final state in a data sample corresponding to an integrated luminosity of 34 pb
−1[15] and in like- sign muon pairs with 1.6 fb
−1[16]. No significant deviation from SM expectations was observed, and fiducial cross-section limits as well as limits on several specific models of physics beyond the SM were derived. The CDF Collaboration has performed similar inclusive searches [17,18] without observing any evidence for new physics. The ATLAS and CMS Collaborations have also performed several searches for like-sign leptons produced in association with jets or missing transverse momentum [19–26].
This article is organised as follows. A brief description of the ATLAS detector is given in Section 2.
The data and simulation samples, the event selection, and the background determination are explained in Sections 3, 4, and 5, respectively. The systematic uncertainties on the background estimate and signal acceptances are summarised in Section 6. In Section 7 the number of observed lepton pairs in data is compared to the background estimate, and in Section 8 these results are used to derive upper limits on the fiducial cross section for like-sign dilepton production in a kinematic region closely related to the experimental event selection.
2 The ATLAS detector
The ATLAS detector [27] consists of an inner tracking system, calorimeters, and a muon spectrometer.
The inner detector (ID), directly surrounding the interaction point, is composed of a silicon pixel detector, a silicon strip detector, and a transition radiation tracker, all contained within a 2 T axial magnetic field.
It covers the pseudorapidity
1range
|η
|< 2.5 and is enclosed by a calorimeter system consisting of elec- tromagnetic and hadronic sections. The electromagnetic part is a lead/liquid-argon sampling calorimeter, divided into a barrel (
|η
|< 1.475) and two end-cap sections (1.375 <
|η
|< 3.2). The barrel (
|η
|< 0.8) and extended barrel (0.8 <
|η
|< 1.7) hadronic calorimeter sections consist of iron and scintillating tiles, while the end-cap (1.5 <
|η
|< 3.2) and forward (3.1 <
|η
|< 4.9) calorimeters are composed of copper or tungsten and liquid-argon.
The calorimeter system is surrounded by a large muon spectrometer (MS) built with air-core toroids.
This spectrometer is equipped with precision chambers (composed of monitored drift tubes and cathode strip chambers) to provide precise position measurements in the bending plane in the range
|η
|< 2.7. In addition, resistive plate chambers and thin gap chambers with a fast response time are used primarily to trigger muons in the rapidity ranges
|η
| ≤1.05 and 1.05 <
|η
|< 2.4, respectively. The resistive plate chambers and thin gap chambers also provide position measurements in the non-bending plane, which are used to improve the pattern recognition and the track reconstruction.
1ATLAS uses a right-handed coordinate system with its origin at the nominal interaction point (IP) in the centre of the detector and thez-axis along the beam pipe. Thex-axis points from the IP to the centre of the LHC ring, and theyaxis points upward. Cylindrical coordinates (r, φ) are used in the transverse plane,φbeing the azimuthal angle around the beam pipe. The pseudorapidity is defined in terms of the polar angleθasη=−ln tan(θ/2).
The ATLAS detector has a three-level trigger system [28]. The Level-1 muon trigger searches for hit coincidences between different muon trigger detector layers inside programmed geometrical windows that define the muon transverse momentum and provide a rough estimate of its position. It selects muons in the rapidity range
|η
|< 2.4. The Level-1 electron trigger selects local energy clusters of cells in the electromagnetic section of the calorimeter. For low-energy electron clusters, low activity in the hadronic calorimeter nearby is required. The Level-1 trigger is followed by a high-level, software-based trigger selection which is similar to that of the full event reconstruction.
3 Data sample and Monte Carlo simulation
This analysis is carried out using a data sample corresponding to an integrated luminosity of 4.7
±0.2 fb
−1of pp collisions, recorded in 2011 at a centre-of-mass energy of 7 TeV. In this dataset, the average number of interactions per beam crossing ranges from about six in the first half of the year to about fifteen at the end of 2011.
The data are selected using single muon and single electron triggers with p
Tthresholds of 10-11 GeV and 16 GeV at Level-1, respectively. At the high-level trigger, a muon with p
T> 18 GeV is required, while for electrons, the threshold was 20 GeV in early 2011 and 22 GeV in the later part of the year.
To ensure no efficiency loss for very high-p
Telectrons, a trigger with a threshold of 45 GeV is also considered which has no requirement on the hadronic calorimeter energy deposits near the electron at Level-1.
Monte Carlo (MC) simulation is used to estimate some of the background contributions and to de- termine the selection efficiency and acceptance for possible new physics signals. The dominant SM processes that contribute to prompt like-sign dilepton production are WZ and ZZ, with smaller contribu- tions from W
±W
±, t tW, and ¯ t tZ. These are all estimated using MC simulation. For processes with a ¯ Z boson, the contribution from γ
∗ →ℓ
+ℓ
−due to internal or external bremsstrahlung of final state quarks or leptons is also simulated for m(ℓ
+ℓ
−) > 0.1 GeV. For the generation of WZ and ZZ events, S
[29]
is used, and W
±W
±, t tW ¯ , and t tZ ¯ production are generated with M
G
[30] for the matrix element and P
[31] for the parton shower and fragmentation. The W
±W
±sample includes the W
±W
∓W
±process.
The normalisation of the WZ and ZZ MC samples is based on cross sections determined at next-to- leading-order (NLO) with MCFM [32]. The cross sections times branching ratios for W
±Z
→ℓ
±νℓ
±ℓ
∓and ZZ
→ℓ
±ℓ
∓ℓ
±ℓ
∓, where ℓ
±is an electron, muon, or tau lepton, after requiring two charged leptons with the same electric charge and with p
T> 20 GeV and
|η
|< 2.5, are 372 fb and 91 fb, respectively.
For t tW ¯ and t tZ ¯ production, the higher-order corrections are calculated in Ref. [33] and [34–36], respectively. The cross sections are 169 fb for t¯ tW and 129 fb for t¯ tZ production. The full higher-order corrections for W
±W
±+2 jets production have not been calculated. However, for parts of the process, theNLO QCD corrections have been shown to be small [37, 38]. Based on this, no correction is applied to the LO cross section.
Opposite-sign dilepton events due to Z/γ
∗, t t, and ¯ W
±W
∓production constitute a background if the
charge of one of the leptons is misidentified. The Z/γ
∗process is generated with P
, and the cross
section is calculated at next-to-next-to-leading order (NNLO) using PHOZPR [39]. The ratio of this
cross section to the leading-order cross section is used to determine a mass dependent QCD K-factor
which is applied to the result of the leading-order simulation [40]. Higher-order electroweak corrections
(beyond the photon radiation included in the simulation) are calculated using H
[41, 42], yielding
an electroweak K-factor due to virtual heavy gauge boson loops. The production of t t ¯ is modelled
using MC@NLO [43] showered with H
[44], and the normalisation is obtained from approximate
NNLO QCD calculations using H
[45]. The production of W
±W
∓is generated using H
, and
the cross section is normalised to the NLO value calculated with MCFM. The production of Zγ
→ℓℓγ
and Wγ
→ℓνγ constitutes a background if the photon converts to an e
+e
−pair. A
[46] is used to generate Wγ production, and the cross section is normalised to be consistent with the ATLAS Wγ cross- section measurement for p
T(γ) > 15 GeV [47]. The Zγ process is implicitly accounted for in simulation of the Z/γ
∗process.
In addition, a variety of new physics signals is simulated in order to study the efficiency and accep- tance of the selection cuts. Pair production of doubly charged Higgs bosons (pp
→H
±±H
∓∓) via a vir- tual Z/γ
∗exchange is generated using P
for H
±±mass values between 50 GeV and 1000 GeV [48].
Production of a right-handed W boson (W
R) decaying to a charged lepton and a right-handed neutrino (N
R) [49, 50], and pair production of heavy down-type fourth generation quarks (d
4) decaying to tW are generated using P
. Like-sign top-quark pair production can occur in models with flavour-changing neutral currents, e.g. via a t-channel exchange of a Z
′boson with utZ
′coupling. Since the left-handed coupling is highly constrained by B
0d −B ¯
0dmixing [51], only right-handed top quarks (t
R) are consid- ered. A sample is generated with the P
[52] generator, based on an effective four-fermion operator uu
→tt corresponding to Z
′masses
≫1 TeV [53]. The parton shower and hadronisation are performed with P
.
Parton distribution functions taken from CTEQ6L1 [54] are used for the M
G
and A
samples and MRST2007 LO
∗∗[55] is used for the P
and H
samples. For the t t ¯ MC@NLO sample, CTEQ6.6 [56] parton distribution functions are used, while for the generation of diboson samples with S
the CTEQ10 [57] parametrisation is used.
The detector response to the generated events is simulated with the ATLAS simulation framework [58]
using G
4 [59], and the events are reconstructed with the same software used to process the data. Sim- ulated pileup interactions generated with P
are overlaid on the hard scatter events to closely emulate the pileup conditions present in the data. The simulated response is corrected for the small differences in efficiencies, momentum scales, and momentum resolutions between data and simulation.
4 Event selection
Events are selected if they contain at least two electrons or muons of the same electric charge with p
T> 20 GeV. The higher-p
Tlepton in e
±e
±events is required to have p
T> 25 GeV. At least one muon with p
T> 20 GeV or one electron with p
T> 25 GeV is required to match an object that passed the relevant high-level trigger. These p
Tthresholds are chosen such that they are well above the trigger thresholds. In addition to the lepton selection, events must have a primary vertex reconstructed with at least three tracks with p
T> 0.4 GeV. If more than one interaction vertex is reconstructed in an event, the one with the highest
Pp
2T, summed over the tracks associated with the vertex, is chosen as the primary vertex.
Electrons are identified as compact showers in the electromagnetic section of the calorimeters matched to a reconstructed track in the inner detector using the tight criteria described in Ref. [60]. These criteria include requirements on the transverse shower shapes and the geometrical match between the track and shower, and reject electrons associated with reconstructed conversion vertices. Electrons must have
|η
|< 2.47, excluding the transition region between the barrel and end-cap calorimeters (1.37 <
|η
|< 1.52). The electron tracks are refitted with the Gaussian Sum Filter algorithm to account for radiative energy losses (bremsstrahlung) in the detector material [61].
Muons are formed from tracks reconstructed in the inner detector combined with tracks reconstructed in the muon spectrometer [62]. To reduce the charge mismeasurement rate the independent charge mea- surements from these two detectors are required to agree. Muons must have
|η
|< 2.5.
The inner detector tracks of electron and muon candidates are required to be consistent with orig-
inating from the primary interaction vertex. The requirements are
|d
0|< 1.0 mm,
|z
0sin θ
|< 1.0 mm,
and
|d
0/σ(d
0)
|< 3, where d
0(z
0) is the track impact parameter with respect to the primary vertex in the
transverse (longitudinal) plane and σ(d
0) is the estimated uncertainty on the d
0measurement of typically 15 µm. To ensure precise impact-parameter measurements, a hit in the innermost pixel detector layer is required if the track traverses an active detector component. This requirement also reduces background from conversion electrons.
Both electrons and muons are required to be isolated from other activity in the event. The isolation energy, E
Tcone∆Riso, is the sum of transverse energies in calorimeter cells (including electromagnetic and hadronic sections) in a cone
∆R = p∆η2+ ∆φ2
<
∆Risoaround the lepton direction. This quantity is corrected for the energy of the electron object as well as energy deposits from pileup interactions. The track isolation, p
cone∆RT iso, is analogously defined as the sum of the transverse momenta of tracks with p
T> 1 GeV in a cone of
∆R<
∆Risoaround the lepton direction. For muons, p
cone0.4T< 0.06
×p
T(µ) and p
cone0.4T< 4 GeV
+0.02
×p
T(µ) are required. For electrons, the requirements are p
cone0.3T/ p
T(e) < 0.1 and E
Tcone0.2< 3 GeV
+(p
T(e)
−20 GeV)
×0.037. These requirements are chosen to maintain good efficiency for prompt leptons over a large p
Trange while rejecting a large fraction of non-prompt leptons, particularly at low p
T.
Selected leptons are required to be separated from jets to suppress leptons from hadronic decays.
For this purpose, jet candidates are reconstructed from topological clusters in the calorimeter [63] using the anti-k
talgorithm [64] with a distance parameter of 0.4. Their energies are corrected for calorimeter non-compensation, upstream material, and other instrumental effects, and quality criteria are applied to remove reconstructed jets not arising from hard-scattering interactions [65]. Jets are required to have p
T> 25 GeV,
|η
|< 2.8 , and 75% of the momentum of the tracks within the jet originating from the primary event vertex. Any jet within a distance
∆R< 0.2 of a candidate electron is discarded to avoid counting the electron as a jet. Electrons and muons are then required to be separated by
∆R> 0.4 from any jet with p
T> 25 GeV
+0.05
×p
T(ℓ).
Lepton pairs are selected if they contain two same-flavour leptons with the same electric charge passing the above selection requirements with invariant mass, m(ℓ
±ℓ
±) > 15 GeV. For e
±e
±pairs, the mass range 70-110 GeV is additionally vetoed due to large backgrounds from opposite-sign electron pairs where the charge of one lepton is misidentified. Any combination of two same-flavour leptons is considered, allowing more than one lepton pair per event to be included.
5 Background determination
Backgrounds to this search arise from three principal sources: SM production of prompt, like-sign lepton pairs (prompt background); production of opposite-sign lepton pairs where the charge of one lepton is misidentified (charge flip) or where a photon converts into an e
+e
−pair; and from hadrons or leptons from hadronic decays (non-prompt background).
5.1 Prompt lepton backgrounds
SM processes resulting in two prompt leptons of the same electric charge are WZ, ZZ, W
±W
±, t tW ¯ , and t¯ tZ production. The background due to these processes is determined from MC simulation using the samples and cross sections described in Section 3. Other SM processes are not expected to contribute significantly to the background and are neglected.
5.2 Charge misidentification and photon conversions
Charge misidentification can occur for high-momentum tracks when the resolution of the tracking detec-
tor is unable to resolve the curvature of the track. This misidentification can occur for both electrons and
muons. In the momentum range of a few hundred GeV relevant for this analysis, the background arising
from this source is determined to be negligible based on MC simulation. The rate of misidentification is studied in data with muons from Z
→µµ decays where the muons are selected based only on the MS (ID) measurements to study the ID (MS) mismeasurement. The combined probability to mismeasure the charge both in the ID and in the MS is found to be consistent with zero and an upper limit ranging from 5
×10
−10at low p
Tto 7
×10
−2for p
T ∼400 GeV is placed. This upper limit is used to determine the systematic uncertainty for muons. For electrons this effect is expected to be small compared to the source described below [27], and is taken directly from MC simulation.
Another source of charge misidentification occurs for electrons when a high-momentum photon is radiated and converts into an e
+e
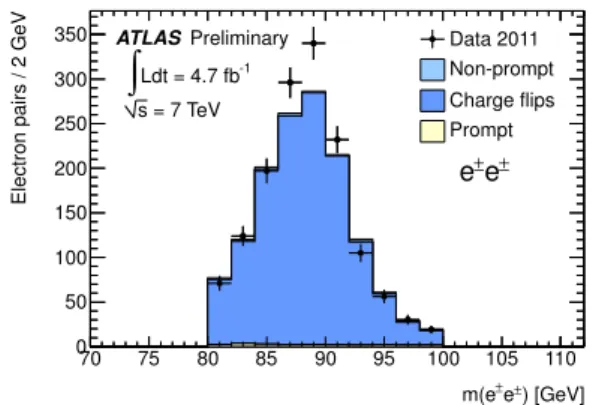
−pair. Electron candidates are rejected if they are associated with conversion vertices [60]. However, for asymmetric conversions, sometimes only one of the tracks is reconstructed and its charge may be different than the charge of the original electron that radiated the photon. The rate for this type of charge misidentification to occur is measured as the relative fraction of like-sign e
±e
±pairs with 80 < m(ee) < 100 GeV as a function of the electron η following the procedure explained in Ref. [66]. The simulation is found to overestimate this rate by about 15%. An η-dependent scaling is applied to the simulated rate to account for this overestimate, and the simulation is then used to predict the backgrounds from Z/γ
∗, t t, and ¯ W
±W
∓production. In the central (forward) region the rate increases from about 0.01% (0.6%) at p
T ≈50 GeV to 0.3% (4%) at p
T ≈300 GeV. An uncertainty of
±
(10
−20)% (depending on η) on this misidentification rate is derived by comparing different methods to determine this factor and by considering the statistical uncertainty.
Production of Wγ
→ℓνγ and Zγ
→ℓ
+ℓ
−γ can lead to like-sign lepton pairs if the photon converts.
This background is determined using the MC samples described in Section 3. Since this background is closely related to the charge misidentification for electrons described above, the MC-based estimate is also scaled down by 15% and the same systematic uncertainty of
±(10
−20)% is applied.
5.3 Non-prompt lepton backgrounds
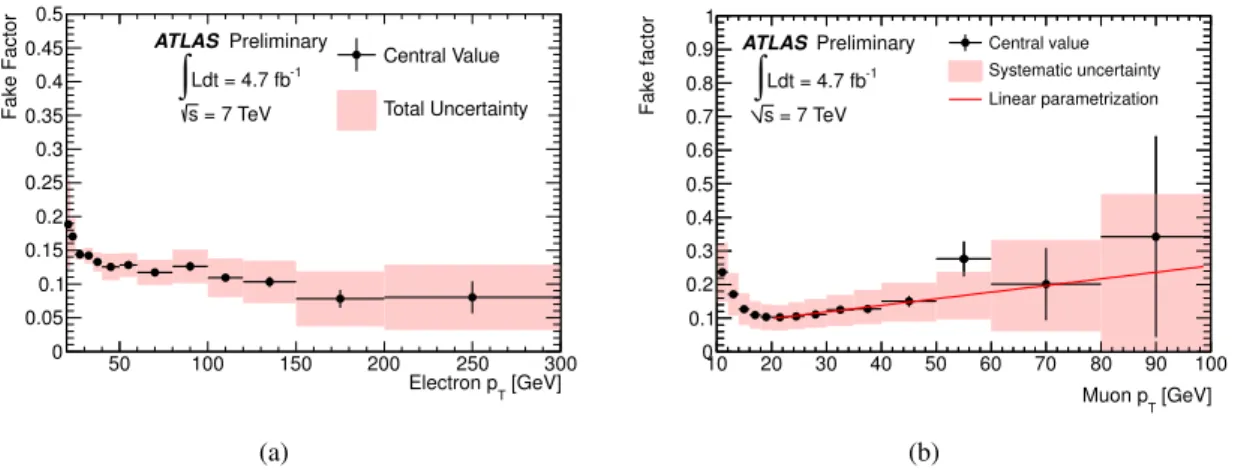
The non-prompt background is determined directly from data. For both electrons and muons, the de- termination relies on measuring a factor f that is the ratio of the number of selected leptons fulfilling the analysis selection cuts (N
S) to the number of leptons failing these selection cuts but passing a less stringent set of requirements, referred to as anti-selected leptons (N
A):
f
=N
SN
A.
The factor f is determined as a function of p
Tand η in a data sample dominated by non-prompt leptons.
Any contamination of prompt leptons in the numerator and denominator is subtracted using MC simu- lation. The details of the anti-selected definitions and the regions used for measuring f depend on the lepton flavour and are described in more detail below.
The primary sources of non-prompt muons are semi-leptonic decays of b- and c-hadrons. For the anti- selection, the isolation cut described in Section 4 is inverted, but a looser requirement of p
cone0.4T/ p
T(µ) <
1.0 is placed. The measurement of f is done in a sample dominated by non-prompt muons with
|
d
0|/σ(d
0) > 5 and
|d
0|< 10 mm. These muons are selected from dimuon events with p
T(µ) > 10 GeV, m(µµ) > 15 GeV, and where Z boson candidates have been vetoed. Simulated muons from b- and c- hadron decays are used to determine the expected difference between f for muons with
|d
0|/σ(d
0) > 5 (used in the data-driven determination of f ) and muons with
|d
0|/σ(d
0) < 3 (used in the event selection).
In simulation, muons with
|d
0|/σ(d
0) < 3 are more isolated, so a correction factor of 1.34
±0.34 is applied to f . The resulting value of f is about 0.10 at p
T=20 GeV and increases to about 0.25 at p
T =100 GeV.
One source of uncertainty in this procedure is that the fraction of non-prompt muons from pion and kaon
decays may be larger for muons passing the analysis-level impact parameter criteria than for those used
in the measurement of f . The uncertainty due to the contribution of light-flavour decays is assessed
by exploiting the difference in the muon momentum measurement in the ID and the MS, which is ex- pected to be large for kaons or pions decaying in the ID or calorimeters. The difference between f for light-flavour decays and heavy-flavour decays is combined with the difference in the relative fraction of non-prompt muons from heavy-flavour decays to give an uncertainty of
±15% on f . The total systematic uncertainty on f is the quadratic sum of the statistical error, the uncertainty on the prompt background subtraction, the correction for the isolation-dependence on the impact parameter significance cut, and the uncertainty in the contribution of pion and kaon decays. It is about
±37% at low p
Tand
±100% for
p
T> 100 GeV.
For electrons, the main non-prompt backgrounds arise from heavy-flavour decays, charged pions that shower early in the calorimeter, and neutral pions decaying to two photons where one of the photons converts to an e
+e
−pair. The anti-selected electrons must have either
|d
0|/σ(d
0) > 3 or fail the medium electron identification cuts while passing the loose electron cuts, as defined in Ref. [60]. The inversion of the impact parameter cut enhances the heavy flavour background, while the inversion of the medium identification cuts enhances the pion backgrounds. A sample dominated by non-prompt electrons is selected by triggering on a high- p
Telectron candidate and requiring that the event contain a jet with p
T> 20 GeV. Contamination from prompt electrons is reduced by requiring there to be only one electron candidate and requiring the transverse mass
2, between the electron and the missing transverse momentum (E
missT) to be below 40 GeV. The value of f is found to be about 0.18 at E
T =20 GeV and decreases to about 0.10 at E
T =100 GeV. A systematic uncertainty is determined accounting for the statistical uncertainty, the prompt background subtraction, varying the p
Trequirement of the jet in the event, and assessing any trigger bias. The uncertainty is about
±10% at low E
Tand increases to
±100% for E
T>
300 GeV. Alternate anti-selection definitions are used to assess the overlap between the non-prompt and charge misidentification backgrounds, as well as the contributions of light- and heavy-flavour jets to the non-prompt background. For the former, a correction is made to the non-prompt background, amounting to
±(11
−25)%, and the full correction is taken as a systematic uncertainty. For the latter, an uncertainty of
±(4
−84)% is found, depending on the invariant mass threshold considered.
A background prediction is derived from f using dilepton pairs where one or both leptons is anti- selected but which pass all other event selection criteria. The non-prompt background prediction is then given by
N
non-prompt =NA+S
X
i=1
f ( p
T1, η
1)
+NS+A
X
i=1
f ( p
T2, η
2)
−NA+A
X
i=1
f ( p
T1, η
1) f ( p
T2, η
2), (1) where N
A+S(N
S+A) is the number of pairs where the subleading (leading) lepton fulfils the selection criteria and the other lepton fulfils the anti-selection. N
A+Ais the number of pairs where both leptons are anti-selected. The prompt contribution to N
A+S, N
S+A, and N
A+Ais subtracted based on MC predictions.
The variables p
T1and η
1(p
T2and η
2) refer to the kinematic properties of the leading (subleading) lepton.
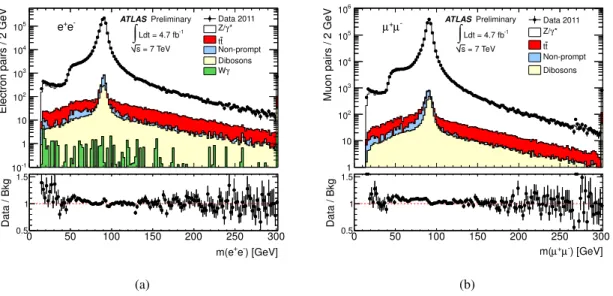
The background estimates are verified in a number of control regions that are designed to probe specific sources of backgrounds. The understanding of prompt leptons is tested in a sample requiring two leptons of opposite charge. This sample is dominated by the Z/γ
∗process in all three final states and the data agree with the background prediction to better than 5%. The electron charge misidentification background is verified in pairs with like-sign electrons with 80 < m(e
±e
±) < 100 GeV. The non-prompt background is tested by inverting the isolation cut but requiring a looser isolation cut value. The heavy- flavour background is tested by inverting the
|d
0|/σ(d
0) cut. For electrons, the light-flavour background is additionally tested by inverting some of the shower shape criteria. The data agree with the background prediction in the various control regions within the systematic uncertainties.
2The transverse mass is defined as q
2ETmisspT(e)(1−cos∆φ(e,EmissT )) whereEmissT is the missing transverse momentum and∆φ(e,EmissT ) is the difference between the azimuthal angles of the electron andETmiss.
6 Systematic uncertainties
Several systematic effects can change the signal acceptance and the background estimate. Uncertainties on the event selection efficiencies and the luminosity affect the predicted yield of signal events as well as those backgrounds that are estimated from MC simulation. Uncertainties on the trigger efficiencies, lepton identification efficiencies, and lepton momentum scales are determined using W, Z, and J/Ψ decays [67–69]. The uncertainties on the lepton identification efficiencies result in an uncertainty on the number of like-sign pairs of
±(3
−4)%. Effects resulting from uncertainties in the muon momentum scale and resolution are negligible. For electrons the energy scale is known to
±1%, and its impact on the signal acceptance is below 0.1% while the background estimate is affected by up to
±3.5%. The uncertainty due to the trigger efficiencies are < 1% in all channels. The luminosity uncertainty is
±3.9% [70, 71].
The uncertainties on the production cross sections of the SM processes affect the predicted yield of the prompt lepton background. For WZ and ZZ production, an uncertainty of
±10% is estimated due to higher-order corrections by varying the renormalisation and factorisation scales by a factor of two.
The uncertainty due to the parton distribution functions is evaluated using the eigenvectors provided by the CTEQ10 set [57] of parton distribution functions using the prescription given in Ref. [72] and adding in quadrature the difference between the central cross-section values obtained using this set and that obtained with the MRST2008NLO [55] parton distribution functions. The resulting uncertainty on the cross section is
±7%. For t¯ tW, t¯ tZ and W
±W
±production a normalisation uncertainty of
±50% is assigned.
The production of Z/γ
∗, t t, and ¯ W
±W
∓also constitute a background in the ee channel due to charge misidentification. The PDF uncertainties for Z/γ
∗and t t ¯ are computed using the MSTW2008 NNLO PDF sets [73] and the renormalisation and factorisation scales are varied by factors of two to derive the uncertainties due to higher-order QCD corrections. For Z/γ
∗, an additional systematic uncertainty is attributed to electroweak corrections [40]. The total uncertainties on the Z/γ
∗and t t ¯ cross sections are
±
8% and
+10/-11% respectively. TheW
±W
∓cross-section uncertainty is determined using the same scale and PDF variations as for WZ and ZZ, yielding a total uncertainty of
±12%.
The systematic uncertainty on the background from non-prompt leptons is discussed in Section 5.3.
It includes a component due to the systematic uncertainties associated with the measurement of the ratio f and a component due to the statistical uncertainty on the number of anti-selected leptons. For m(ℓ
±ℓ
±) > 15 GeV it is
±33% for the µµ and
±38% for the ee final states, and it increases to nearly
±
100% at higher masses for both final states.
The probability of assigning the wrong charge to the lepton and its uncertainty is discussed in Sec- tion 5.2. For the µµ final state, charge misidentification results in an uncertainty of
+4.9−0.0events for m(ℓ
±ℓ
±) > 15 GeV to
+1.7−0.0events for m(ℓ
±ℓ
±) > 400 GeV. For electrons, the uncertainty on the charge flip background due to uncertainty in the charge mismeasurement rate ranges from
±15% to
±23% for the same lower mass thresholds. Photon conversions in Wγ and Zγ events are another source of like-sign lepton pairs as described in Section 5.2. The uncertainty varies between
±10% and
±20% depending on photon η and results in a relative uncertainty on this background source of
±(15
−18)% depending on m(ℓ
±ℓ
±).
Statistical uncertainties due to limited size of the background MC samples are also considered. Sys- tematic uncertainties on different processes from the same origin are assumed to be 100% correlated.
7 Comparison of data to the background expectation
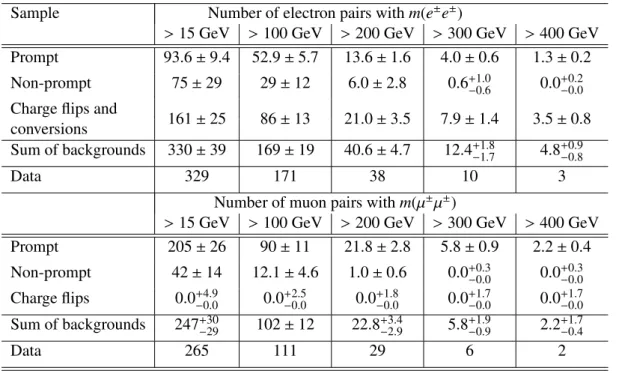
The predicted numbers of background pairs are compared to the observed numbers of like-sign lepton
pairs in Table 1. For the e
±e
±final state, about 30% of the background arises from prompt leptons in all
mass bins. The rest arises from leptons from hadronic decays, charge flips, or conversions. For the µ
±µ
±Table 1: Expected and observed numbers of pairs of isolated like-sign leptons for various cuts on the dilepton invariant mass, m(ℓ
±ℓ
±). The uncertainties shown are the quadratic sum of the statistical and systematic uncertainties. The prompt background contribution includes the WZ, ZZ, W
±W
±, t tW ¯ , and t¯ tZ processes. When zero events are predicted, the uncertainty corresponds to the 68% C.L. upper limit on the prediction.
Sample Number of electron pairs with m(e
±e
±)
> 15 GeV > 100 GeV > 200 GeV > 300 GeV > 400 GeV Prompt 93.6
±9.4 52.9
±5.7 13.6
±1.6 4.0
±0.6 1.3
±0.2
Non-prompt 75
±29 29
±12 6.0
±2.8 0.6
+1.0−0.6
0.0
+0.2−0.0Charge flips and
161
±25 86
±13 21.0
±3.5 7.9
±1.4 3.5
±0.8 conversions
Sum of backgrounds 330
±39 169
±19 40.6
±4.7 12.4
+1.8−1.74.8
+0.9−0.8Data 329 171 38 10 3
Number of muon pairs with m(µ
±µ
±)
> 15 GeV > 100 GeV > 200 GeV > 300 GeV > 400 GeV
Prompt 205
±26 90
±11 21.8
±2.8 5.8
±0.9 2.2
±0.4
Non-prompt 42
±14 12.1
±4.6 1.0
±0.6 0.0
+0.3−0.00.0
+0.3−0.0Charge flips 0.0
+4.9−0.00.0
+2.5−0.00.0
+1.8−0.00.0
+1.7−0.00.0
+1.7−0.0Sum of backgrounds 247
+30−29102
±12 22.8
+3.4−2.95.8
+1.9−0.92.2
+1.7−0.4Data 265 111 29 6 2
final state, the prompt background constitutes about 83% of the total background for m(µ
±µ
±) > 15 GeV, rising to nearly 100% of the total background for m(µ
±µ
±) > 400 GeV. The overall uncertainty on the background is about
±15% at low mass and
±30% at high mass.
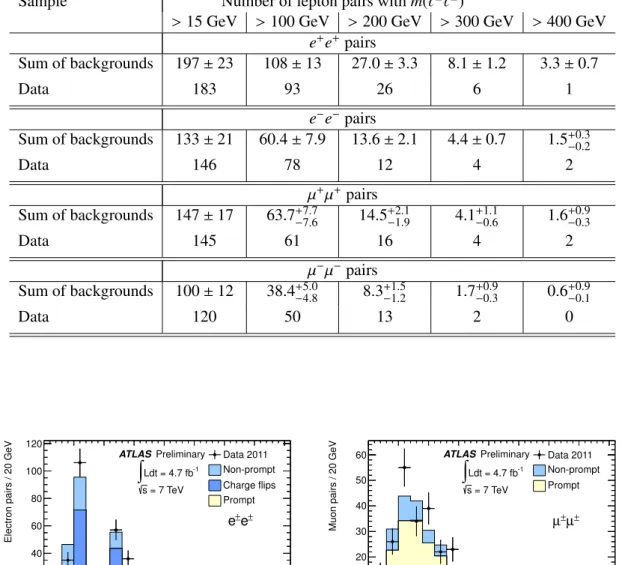
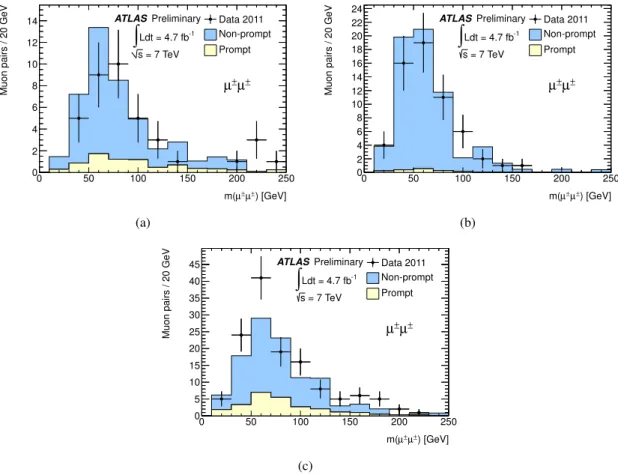
Table 2 shows the data compared to the background expectation separately for ℓ
+ℓ
+and ℓ
−ℓ
−events for the ee and µµ final states. The background is higher for the ℓ
+ℓ
+final state mostly due to the larger W
+Z versus W
−Z cross section in pp collisions.
The agreement of the data with the background expectation is evaluated using 1
−CL
b[74], defined as the one-sided probability of the background-only hypothesis to fluctuate up to the number of observed events. Statistical and systematic uncertainties and their correlations are fully considered for this calcu- lation. The largest upward deviations, observed for M > 100 GeV in the µ
−µ
−and e
−e
−channels, occur about 8% of the time in background-only pseudo-experiments.
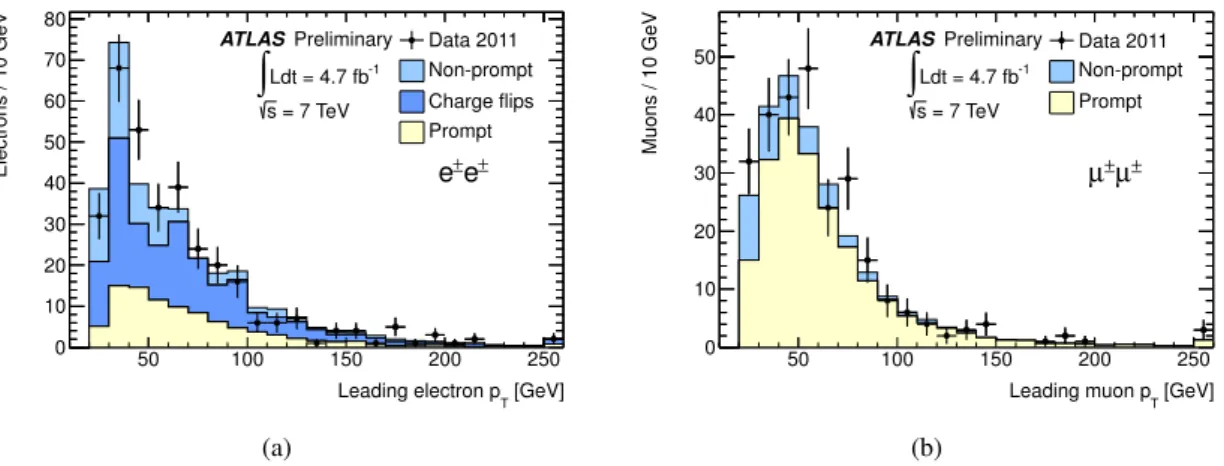
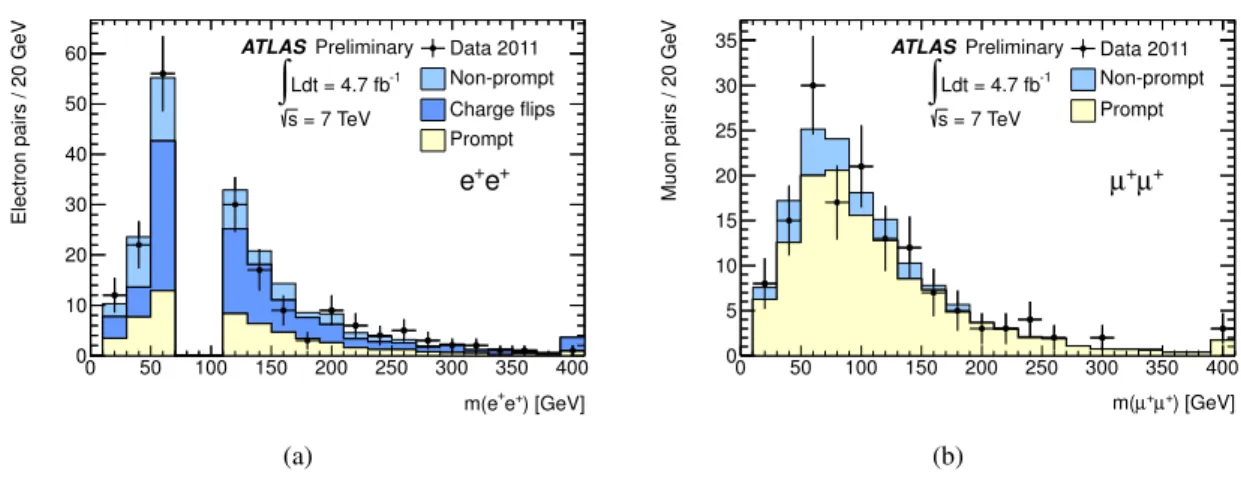
Figure 1 shows the dilepton invariant mass spectra for the e
±e
±and µ
±µ
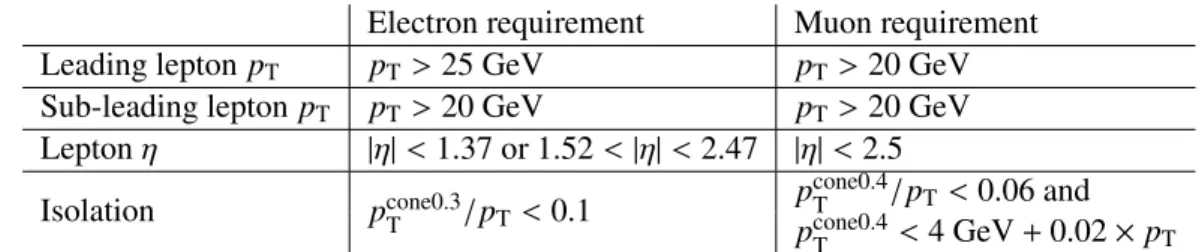
±final states, and Figure 2 shows the p
Tof the leading leptons. Good agreement with the background expectation is observed for both channels.
8 Upper limits on the cross section for prompt like-sign dilepton produc- tion
Since the data are consistent with the background expectation, upper limits are placed on contributions
due to processes from physics beyond the Standard Model. The 95% confidence level (C.L.) upper limit
on the number of events, N
95, is determined using the CL
smethod [74]. For the inclusive ℓ
±ℓ
±final
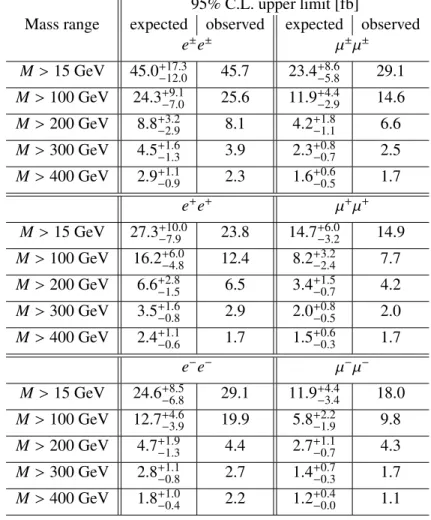
Table 2: Expected and observed numbers of positively- and negatively-charged lepton pairs for different lower limits on the dilepton invariant mass, m(ℓ
±ℓ
±). The uncertainties shown are the quadratic sum of the statistical and systematic uncertainties.
Sample Number of lepton pairs with m(ℓ
±ℓ
±)
> 15 GeV > 100 GeV > 200 GeV > 300 GeV > 400 GeV e
+e
+pairs
Sum of backgrounds 197
±23 108
±13 27.0
±3.3 8.1
±1.2 3.3
±0.7
Data 183 93 26 6 1
e
−e
−pairs
Sum of backgrounds 133
±21 60.4
±7.9 13.6
±2.1 4.4
±0.7 1.5
+0.3−0.2Data 146 78 12 4 2
µ
+µ
+pairs
Sum of backgrounds 147
±17 63.7
+7.7−7.614.5
+2.1−1.94.1
+1.1−0.61.6
+0.9−0.3Data 145 61 16 4 2
µ
−µ
−pairs
Sum of backgrounds 100
±12 38.4
+5.0−4.88.3
+1.5−1.21.7
+0.9−0.30.6
+0.9−0.1Data 120 50 13 2 0
) [GeV]
e±
m(e±
0 50 100 150 200 250 300 350 400
Electron pairs / 20 GeV
0 20 40 60 80 100 120
Data 2011 Non-prompt Charge flips Prompt ATLAS Preliminary
∫
Ldt = 4.7 fb-1 = 7 TeV se±
e±
(a)
) [GeV]
µ±
µ±
m(
0 50 100 150 200 250 300 350 400
Muon pairs / 20 GeV
0 10 20 30 40 50
60 Data 2011
Non-prompt Prompt ATLASPreliminary
∫
Ldt = 4.7 fb-1 = 7 TeV sµ±
µ±
(b)
Figure 1: Invariant mass distributions for e
±e
±(a) and µ
±µ
±(b) pairs passing the full event selection. The
data are shown as closed circles. The stacked histograms represent the backgrounds composed of pairs
of prompt leptons from SM processes, pairs with at least one non-prompt lepton, and for the electron
channels, backgrounds arising from charge misidentification and conversions. Events in the ee channel
with invariant masses between 70 GeV and 110 GeV are excluded because of the large background from
charge misidentification in Z
→e
±e
∓decays. The last bin is an overflow bin.
[GeV]
Leading electron pT
50 100 150 200 250
Electrons / 10 GeV
0 10 20 30 40 50 60 70 80
Data 2011 Non-prompt Charge flips Prompt ATLAS Preliminary
∫
Ldt = 4.7 fb-1 = 7 TeV se±
e±
(a)
[GeV]
Leading muon pT
50 100 150 200 250
Muons / 10 GeV
0 10 20 30 40
50 Data 2011
Non-prompt Prompt ATLASPreliminary
∫
Ldt = 4.7 fb-1 = 7 TeV sµ±
µ±
(b)
Figure 2: Leading lepton p
Tdistributions for e
±e
±(a) and µ
±µ
±(b) pairs passing the full event selection.
The data are shown as closed circles. The stacked histograms represent the backgrounds composed of pairs of prompt leptons from SM processes, pairs with at least one non-prompt lepton, and for the electron channels, backgrounds arising from charge misidentification and conversions. The last bin is an overflow bin.
states, the upper limit ranges from 97 pairs for m(ee) > 15 GeV to 4.4 pairs for m(µµ) > 400 GeV.
The limit on the number of lepton pairs can be translated to an upper limit on the cross section measured in a given region of phase space (here referred to as the fiducial region), σ
fid95, via
σ
fid95 =N
95ε
fid×RL
dt , (2)
where ε
fidis the efficiency for detecting events within the fiducial region and
RL
dt is the integrated luminosity of 4.7 fb
−1.
The value of ε
fidgenerally depends on the new physics process, e.g. the number of leptons in the final state passing the kinematic selection cuts or the number of jets that may effect the lepton isolation.
In order to minimise this dependence, the definition of the fiducial region is closely related to the analysis selection. In the MC generator, electrons or muons are selected as stable particles that originate from a W or Z boson, from a τ lepton, or from an exotic new particle (e.g. a H
±±or a right-handed W).
The generated electrons and muons are required to fulfil the p
T, η, and isolation requirements listed in Table 3, which mirror the selection requirements listed in Section 4. The generator-level track isolation, p
cone∆RT iso, is defined as the scalar sum of all stable charged particles with p
T> 1 GeV in a cone of size
∆Risoaround the electron or muon. The requirement on isolation energy (E
cone∆RT iso) placed in the electron selection is not emulated in the fiducial region definition, because the measurement of isolation energy in the calorimeter has a poor resolution. Pairs of like-sign leptons must have m(ℓ
±ℓ
±) > 15 GeV and for e
±e
±, the mass range 70-110 GeV is additionally excluded.
The fiducial efficiency, ε
fid, is defined as the fraction of lepton pairs passing this selection that also fulfil the experimental selection criteria as described in Section 4. It is determined for a variety of new physics models: H
±±bosons with mass between 50-1000 GeV, fourth generation quarks decaying to Wt with masses of 300-500 GeV, like-sign top-quark production via a contact interaction, and right-handed W bosons decaying to ℓ
±ℓ
±via a right-handed neutrino with m(W
R)
=800-2500 GeV. These models are chosen as they cover a broad range of jet multiplicities and lepton p
Tspectra.
For m(ℓ
±ℓ
±) > 15 GeV in the e
±e
±channel, the fiducial efficiencies range from 43% for models with
low-p
Tleptons to 70% for models with high-p
Tleptons. The primary reason for this dependence is that
Table 3: Summary of requirements on generated leptons in the fiducial region. The definition of the isolation variable, p
cone∆RT iso, is given in the text.
Electron requirement Muon requirement Leading lepton p
Tp
T> 25 GeV p
T> 20 GeV Sub-leading lepton p
Tp
T> 20 GeV p
T> 20 GeV Lepton η
|η
|< 1.37 or 1.52 <
|η
|< 2.47
|η
|< 2.5
Isolation p
cone0.3T/ p
T< 0.1 p
cone0.4T/p
T< 0.06 and p
cone0.4T< 4 GeV
+0.02
×p
Tthe electron identification efficiency varies by about 15% over the relevant p
Trange [60]. For the higher mass thresholds the efficiencies are slightly larger. The efficiencies are also derived for ℓ
+ℓ
+and ℓ
−ℓ
−pairs separately and found to be independent of the charge.
To derive the upper limit on the fiducial cross section, the lowest efficiency values are taken for all mass thresholds, i.e. 43.4% for the e
±e
±and 60.6% for the µ
±µ
±analysis. The 95% C.L. upper limits on the cross section, σ
fid95, are calculated using Equation 2 and given in Table 4. The limits range from 45.7 fb to 1.7 fb for the inclusive ℓ
±ℓ
±analysis depending on the mass cut and the final state and are generally within 1σ of the expected limits. Upper limits are also derived on the ℓ
+ℓ
+and ℓ
−ℓ
−cross sections using the same efficiencies as for the inclusive limits.
9 Conclusions
An inclusive search for anomalous production of like-sign lepton pairs was presented using 4.7 fb
−1of pp collision data at
√s
=7 TeV recorded by the ATLAS experiment at the LHC. The data are found to agree with the background expectation in e
±e
±and µ
±µ
±final states both in overall rate and in the kinematic distributions. The data are used to constrain new physics contributions with like-sign lepton pairs within a fiducial region of two isolated leptons with high transverse momentum within the rapidity range of the tracking system (
|η
|< 2.5). The 95% confidence level upper limits on the cross section of new physics processes within this fiducial region range between 1.7 fb and 45.7 fb for ℓ
±ℓ
±pairs depending on the dilepton invariant mass.
References
[1] J. C. Pati and A. Salam, Phys. Rev. D
10(1974) 275.
[2] R. N. Mohapatra and J. C. Pati, Phys. Rev. D
11(1975) 566.
[3] G. Senjanovic and R. N. Mohapatra, Phys. Rev. D
12(1975) 1502.
[4] T. Rizzo, Phys. Rev. D
25(1982) 1355; addendum ibid.
27, (2983) 657.[5] J. E. Cieza Montalvo, N. V. Cortez, J. Sa Borges, and M. D. Tonasse, Nucl. Phys. B
756(2006) 1;
erratum ibid.
796422 (2008).
[6] H. Georgi and M. Machacek, Nucl. Phys. B
262(1985) 463.
[7] J. F. Gunion, R. Vega, and J. Wudka, Phys. Rev. D
42(1990) 1673.
Table 4: Upper limits at 95% C.L. on the fiducial cross section of non-SM physics for ℓ
±ℓ
±pairs. Given are the expected limits and their 1σ uncertainties and the observed limits in data for the ee and µµ final states inclusively and separated by charge.
95% C.L. upper limit [fb]
Mass range expected observed expected observed e
±e
±µ
±µ
±M > 15 GeV 45.0
+17.3−12.045.7 23.4
+8.6−5.829.1 M > 100 GeV 24.3
+9.1−7.025.6 11.9
+4.4−2.914.6 M > 200 GeV 8.8
+3.2−2.98.1 4.2
+1.8−1.16.6 M > 300 GeV 4.5
+1.6−1.33.9 2.3
+0.8−0.72.5 M > 400 GeV 2.9
+1.1−0.92.3 1.6
+0.6−0.5