ATLAS-CONF-2012-169 05/01/2013
ATLAS NOTE
ATLAS-CONF-2012-169
December 13, 2012 Minor revision: January 4, 2013
Updated results and measurements of properties of the new Higgs-like particle in the four lepton decay channel with the ATLAS detector
The ATLAS Collaboration
Abstract
This note presents an update of the search results and a first measurement of the proper- ties of the newly observed Higgs-like particle in the decay channelH→ZZ(∗) →`+`−`0+`0−, where`, `0 =eorµ, using 4.6 fb−1and 13.0 fb−1of proton-proton collisions at √
s=7 TeV and 8 TeV, respectively, recorded with the ATLAS detector. An excess of events over back- ground is seen, with a minimum p0 value of 0.0021% (4.1 standard deviations) atmH = 123.5 GeV in the combined analysis of the two datasets. The fitted Higgs mass is measured to bemH = 123.5±0.9 (stat)±0.3 (syst) GeV, and the signal strength (the ratio of the ob- served cross-section to the expected SM cross-section) at this mass is found to beµ=1.3+0.5−0.4. A spin-parity analysis is performed on the events with 115 GeV<mH <130 GeV. The 0+ state is found to be favoured over the 0−, 2+and 2−states with 0−excluded by 2.7σwhen compared to 0+.
Revised references and minor textual correction with respect to the version of December 13, 2012
c Copyright 2013 CERN for the benefit of the ATLAS Collaboration.
Reproduction of this article or parts of it is allowed as specified in the CC-BY-3.0 license.
1 Introduction
The Brout-Englert-Higgs (BEH) mechanism in the context of the Standard Model (SM) is the source of electroweak symmetry breaking and results in the appearance of the Higgs boson [1–3]. Recently the ATLAS and CMS experiments have reported the observation of a new particle in the search for the SM Higgs boson [4, 5], where the most sensitive channels are H → ZZ(∗) → 4`, H → γγ, and H→WW(∗) →eνµν. An important step in the confirmation of the new particle as the SM Higgs boson is the measurement of its spin, charge conjugation and parityJCP, predicted to be 0++.
The search for the SM Higgs boson through the decayH→ZZ(∗) →4`, where`=eorµ, provides good sensitivity over a wide mass range. Four distinct final states, µ+µ−µ+µ− (4µ),µ+µ−e+e−(2µ2e), e+e−µ+µ− (2e2µ), and e+e−e+e− (4e), are selected. The 2µ2e and 2e2µmodes differ by the flavor of the lepton pair closest to the Z mass. The largest background in this search comes from continuum (Z(∗)/γ∗)(Z(∗)/γ∗) production, referred to asZZ(∗)hereafter. For masses below∼160 GeV, there are also important background contributions fromZ+jets andt¯tproduction, where the additional charged lepton candidates arise either from decays of hadrons withb- orc-quark content or from mis-identification of jets. The observation that the new particle decays into theγγ final state excludes the spin 1 state [6, 7]
and defines its charge conjugation to be even. The analysis described here concentrates on the spin and parity (JP) of theH →ZZ(∗) →4`decay to distinguish between the states with spin 0 and 2, even and odd parity, through the observed distributions of the twoZboson masses, one production and four decay angles.
This note updates the results presented in Ref. [4]. It includes a re-analysis of the √
s= 7 TeV data corresponding to an integrated luminosity of 4.6 fb−1collected in 2011, combined with an analysis of
√s = 8 TeV data corresponding to an integrated luminosity of 13.0 fb−1 collected between April and September 2012. The analysis, which was re-optimized before the 2012 data-taking, remains basically the same as the one described in Ref. [4]. Only a few minor changes have been introduced: the tightening of the electron identification for pT < 15 GeV to improve the background rejection for the final states with a pair of electrons from the lower massZ(∗)boson, only for √
s=8 TeV data; fixing them34sliding mass cut at 17.5 GeV form4` < 140 GeV to avoid a cut which changes across the new particle mass window; removing the use of the Z-mass constraint fit to simplify the systematic uncertainties for the mass measurement, and the use of a single set of data quality requirements for all final states, which slightly reduces the integrated luminosity relative to Ref. [4].
In the following, the ATLAS detector is briefly described in Section 2, and the signal and background simulation is presented in Section 3. The analysis of the √
s=8 TeV data collected in 2012 is discussed in Section 4 and that of the √
s=7 TeV data collected in 2011 is described in Section 5. The analysis of spin and parity is described in Section 6. After a description of the systematic uncertainties in Section 7, Section 8 presents the result of the combined analysis of the two data sets.
2 The ATLAS Detector
The ATLAS detector [8] is a multi-purpose particle physics detector with approximately forward-backward symmetric cylindrical geometry1. The inner tracking detector (ID) [9] covers|η| < 2.5 and consists of a silicon pixel detector, a silicon micro-strip detector, and a transition radiation tracker. The ID is sur- rounded by a thin superconducting solenoid providing a 2T axial magnetic field. A high-granularity lead/liquid-argon (LAr) sampling calorimeter [10] measures the energy and the position of electromag-
1ATLAS uses a right-handed coordinate system with its origin at the nominal interaction point. Thez-axis is along the beam pipe, thex-axis points to the centre of the LHC ring and they-axis is defined as pointing upwards. Polar coordinates (r,φ) are used in the transverse plane,φbeing the azimuthal angle around the beam pipe. The pseudo-rapidityηis defined as η=−ln[tan(θ/2)] whereθis the polar angle.
netic showers within|η| < 3.2. LAr sampling calorimeters are also used to measure hadronic showers in the end-cap (1.5 < |η| < 3.2) and forward (3.1 < |η| < 4.9) regions, while an iron/scintillator tile calorimeter [11] measures hadronic showers in the central region (|η| < 1.7). The muon spectrometer (MS) [12] surrounds the calorimeters and consists of three large superconducting air-core toroid magnets, each with eight coils, a system of precision tracking chambers (|η|<2.7), and fast tracking chambers for triggering. A three-level trigger system [13] selects events to be recorded for offline analysis.
3 Signal and Background Simulation
The H→ZZ(∗) →4`signal is modelled using the PMonte Carlo (MC) event generator [14, 15], which calculates separately the gluon fusion (ggF) and vector-boson fusion (VBF) production mecha- nisms with matrix elements up to next-to-leading order (NLO). The Higgs boson transverse momentum (pT) spectrum in the ggF process follows the calculation of Ref. [16], which includes QCD corrections up to NLO and QCD soft-gluon re-summations up to next-to-next-to-leading logarithm (NNLL), and the effects of finite quark masses are also taken into account [17]. Pis interfaced to P[18,19] for showering and hadronization, which in turn is interfaced to P[20,21] for quantum electrodynamics (QED) radiative corrections in the final state. Pis used to simulate the production of a Higgs boson in association with aWor aZboson.
The Higgs boson production cross sections and decay branching ratios, as well as their uncertain- ties, are taken from Refs. [22, 23]. The cross sections for the ggF process have been calculated to NLO [24–26], and next-to-next-to-leading order (NNLO) [27–29] in QCD. In addition, QCD soft-gluon re-summations calculated in the NNLL approximation are applied for the ggF process [30]. NLO elec- troweak (EW) radiative corrections are also applied [31,32]. These results are compiled in Refs. [33–35]
assuming factorisation between QCD and EW corrections. The cross sections for VBF processes are calculated with full NLO QCD and EW corrections [36–38], and approximate NNLO QCD corrections are available [39]. The cross sections for the associatedWH/ZHproduction processes are calculated at NLO [40] and at NNLO [41] in QCD, and NLO EW radiative corrections [42] are applied.
The Higgs boson decay branching ratios [43] to the different four-lepton final states are provided by P4[44, 45], which includes the complete NLO QCD+EW corrections and interference effects between identical final-state fermions. Table 1 gives the production cross sections and branching ratios forH→ZZ(∗)→4`, which are used to normalise the signal MC, for several Higgs boson masses.
The QCD scale uncertainties formH = 125 GeV [22] amount to+7−8% for the ggF process and±1%
for the VBF and associated WH/ZH production processes. The uncertainty on the production cross section due to uncertainties on the parton distribution function (PDF) andαsis±8% for gluon-initiated processes and ±4% for quark-initiated processes, estimated by following the prescription in Ref. [46]
and by using the PDF sets of CTEQ [47], MSTW [48] and NNPDF [49]. The PDF uncertainties are assumed to be 100% correlated among processes with identical initial states, regardless of these being signal or background [50].
The cross section calculations do not take into account the width of the Higgs boson, which is imple- mented through a relativistic Breit-Wigner line shape applied at the event-generator level. In the absence of a full calculation, the possible size of such effects is included as an extra signal normalisation system- atic uncertainty formH ≥300 GeV, on top of the one presented in Table 1, following a parametrisation as a function ofmH: 150%×(mH/TeV)3[23].
The ZZ(∗) continuum background is modelled using P[51] for quark-antiquark annihilation andgg2ZZ [52] for ggF, normalised to the MCFM prediction [53]. The QCD scale uncertainty has a
±5% effect on the expected ZZ(∗) background, and the effect due to the PDF and αs uncertainties is
±4% (±8%) for quark-initiated (gluon-initiated) processes. In addition, the shape uncertainty on the four-lepton invariant mass spectrum has been assigned as discussed in Ref. [23]. T[54, 55] is used
Table 1: Higgs boson production cross sections for ggF, VBF and associated production with aWorZ boson in ppcollisions at √
s = 8 TeV and √
s = 7 TeV [22]. The quoted uncertainties correspond to the total theoretical systematic uncertainties with linear sum of QCD scale and PDF+αs uncertainties.
The production cross section for the associated production with aW orZ boson is negligibly small for mH > 300 GeV. The decay branching ratio forH →ZZ(∗) →4`, with`=eorµ, is reported in the last column [22].
mH σ(gg→H) σ(V BF:qq0→Hqq0) σ(q¯q→WH) σ(q¯q→ZH) H→ZZ(∗)→4`
[GeV] [pb] [pb] [pb] [pb] [10−3]
√s=8 TeV
123 20.2±3.0 1.61±0.05 0.73±0.03 0.42±0.02 0.103
125 19.5±2.9 1.58+0.04−0.05 0.70±0.03 0.39±0.02 0.125 127 18.9±2.8 1.55±0.05 0.66+0.02−0.03 0.37±0.02 0.148
400 2.92+0.41−0.40 0.25±0.01 − − 1.21
600 0.52+0.08−0.07 0.097±0.004 − − 1.23
√s=7 TeV
123 15.8+2.3−2.4 1.25±0.03 0.60+0.02−0.03 0.33±0.02 0.103
125 15.3±2.3 1.22±0.03 0.57±0.02 0.32±0.02 0.125
127 14.9±2.2 1.20±0.03 0.54±0.02 0.30±0.02 0.148
400 2.05+0.30−0.29 0.18±0.01 − − 1.21
600 0.34+0.06−0.05 0.062+0.005−0.002 − − 1.23
for the simulation of τlepton decays. TheZ +jets production is modelled using A [56] and is divided into two sources: Z+light jets, which includesZc¯cin the masslessc-quark approximation and Zbb¯ from parton showers, andZbb¯ using matrix element calculations that take into account theb-quark mass. The MLM [57] matching scheme is used to remove any double counting of identical jets produced via the matrix element calculation and the parton shower, but this scheme is not implemented forb-jets.
Therefore,bb¯ pairs with separation∆R = q
(∆φ)2+(∆η)2 > 0.4 between theb-quarks are taken from the matrix-element calculation, whereas for∆R<0.4 the parton-showerbb¯ pairs are used. In this search theZ+jets background is normalised using control samples from data. For comparison between data and simulation, the QCD NNLO FEWZ [58, 59] and MCFM cross section calculations are used for inclusive Z boson andZbb¯ production, respectively. Thett¯background is modelled using MC@NLO [60] and is normalised to the approximate NNLO cross section calculated using H[61]. The effect of the QCD scale uncertainty on the cross section is+4−9%, while the effect of PDF andαsuncertainties is±7%. Both Aand MC@NLO are interfaced to H[62] for parton shower hadronization and to J[63]
for the underlying event simulation.
Generated events are fully simulated using the ATLAS detector simulation [64] within the G4 framework [65]. Additional ppinteractions in the same and nearby bunch crossings (pile-up) are in- cluded in the simulation. The MC samples are re-weighted to reproduce the observed distribution of the mean number of interactions per bunch crossing in the data.
For the spin and parity analysis discussed in Section 6, the JHU [66] leading-order generator is used to simulate the decay of a Higgs boson with a mass of 125 GeV. JHU allows the generation of the various spin and parity combinations whereas Ppermits only the SM 0+generation. The JHU generation is interfaced to the PMC generator for the parton showers, using the PDF set CTEQ6L1 [47] with the ATLAS underlying event tune [67,68]. The JHU simulation has been found to be in good agreement with Pin the case of 0+for the variables relevant to the spin and parity analysis. The JHU generated pTspectrum is slightly harder than for P. In order to avoid a bias on the event selection from this,
the JHU Higgs pT spectrum is re-weighted to that of Pat the fully simulated event level. This re-weighting is found to have no effect on the expected separation of the spin and parity states. Finally, for spin 2, only gg production is considered, ignoring a possible contribution fromqq¯ production.
4 Signal and Background Analysis of √
s = 8 TeV data
The data are subjected to quality requirements: events recorded during periods when the relevant detector components were not operating normally are rejected. These requirements are applied independently of the lepton final state. The resulting integrated luminosity is 13.0 fb−1for all final states.
4.1 Lepton reconstruction/identification and event selection
The data considered in this analysis are selected using single-lepton or di-lepton triggers. For the single- muon trigger the transverse momentum, pT, threshold is 24 GeV, while for the single-electron trigger the transverse energy,ET, threshold is 25 GeV. For the di-muon triggers the thresholds arepT=13 GeV for each muon orpT1 =18 GeV,pT2 =8 GeV in the case of the asymmetric di-muon trigger, while for the di-electron triggers the thresholds areET =12 GeV for each electron. The trigger efficiency is>97%
for events with muons and∼100% for four electron events.
Electron candidates consist of clusters of energy deposited in the electromagnetic calorimeter that are associated with ID tracks [69]. All tracks associated with electromagnetic clusters are re-fitted using a Gaussian-Sum Filter [70], which accounts for bremsstrahlung energy losses. The clusters are required to satisfy a set of identification criteria that require the longitudinal and transverse shower profiles to be consistent with those expected for electromagnetic showers. The electron transverse momentum is computed from the cluster energy and the track direction at the interaction point. Finally, for the present analysis some of the identification criteria have become stricter than the original optimisation at the beginning of 2012. Specifically, the low ET electron calorimeter requirements have been tightened in the transition region of the detector, and the pixel tracking requirements became stricter to improve conversion rejection. These tighter requirements are applied to all 2012 data.
Muon candidates are formed by matching reconstructed ID tracks with either complete or partial tracks reconstructed in the MS [71]. If a complete track is present, the two independent momentum measurements are combined; otherwise the momentum is measured using the ID or the MS information alone. The muon reconstruction/identification coverage is extended by using tracks reconstructed in the forward region (2.5<|η|<2.7) of the MS, which is outside the ID coverage. In the centre of the barrel region (|η| <0.1), which lacks MS geometrical coverage, ID tracks withpT >15 GeV are identified as muons using the profile of the associated energy deposits in the calorimeter.
This analysis searches for Higgs boson candidates by selecting two same-flavour, opposite-sign lep- ton pairs in an event. The impact parameter of each lepton along the beam axis is required to be within 10 mm of the reconstructed primary vertex. To reject cosmic rays, muon tracks are required to have a transverse impact parameter, defined as the impact parameter in the bending plane with respect to the primary vertex, of less than 1 mm. The primary vertex is defined as the reconstructed vertex with the highestP
p2Tof associated tracks among the reconstructed vertices with at least three associated tracks.
Each electron (muon) must satisfy ET > 7 GeV (pT > 6 GeV) and be measured in the pseudo- rapidity range|η| <2.47 (|η|<2.7). The highest pT lepton in the quadruplet must satisfypT >20 GeV, and the second (third) lepton in pT order must satisfy pT > 15 GeV (pT > 10 GeV). The leptons are required to be separated from each other by∆R > 0.1 if they are of the same flavour and∆R > 0.2 otherwise. The same-flavour and opposite-sign lepton pair closest to theZboson mass is referred to as the leading di-lepton and its invariant mass,m12, is required to be between 50 and 106 GeV. The remaining same-flavour, opposite-sign lepton pair is the sub-leading di-lepton and its invariant mass,m34, is required
to be in the rangemmin< m34 <115 GeV. The value ofmmindepends on the reconstructed four-lepton invariant mass, m4`, and is shown in Table 2. TheZ boson corresponding to the leading (sub-leading) di-lepton pair is labelled Z1(Z2). All possible same-flavour opposite-charge di-lepton combinations in the quadruplet must satisfym`` > 5 GeV to remove events containingJ/ψ→ll. Four different analysis sub-channels (4e, 2e2µ, 2µ2e, 4µ) ordered by the flavour of the leading di-lepton are defined.
Table 2: The lower thresholds applied tom34for reference values ofm4`. Form4`values between these reference values the selection requirement is obtained via linear interpolation.
m4` [ GeV] ≤140 160 165 180 ≥190 mminthreshold [ GeV] 17.5 30 35 40 50
TheZ +jets andtt¯background contributions are further reduced by applying impact parameter as well as track- and calorimeter-based isolation requirements on the leptons. The normalised track isolation discriminant is defined as the sum of the transverse momenta of tracks,ΣpT, inside a cone of∆R< 0.2 around the lepton, excluding the lepton track, divided by the leptonET. The tracks considered in the sum must come from the primary vertex and be of good quality; i.e., they must have at least four hits in the pixel and silicon strip detectors (“silicon hits”) andpT >1 GeV for muons, and at least nine silicon hits, one hit in the innermost pixel layer (theb-layer) andpT>0.4 GeV for electrons. Each lepton is required to have a normalised track isolation smaller than 0.15.
The normalised calorimetric isolation for electrons is computed as the sum of the positive-energy topological clusters with a reconstructed barycenter falling in a cone of∆R < 0.2 around the candidate electron cluster divided by the electron ET. The cut value is 0.20. The cells within 0.125× 0.175 in η×φ around the electron barycenter are excluded. The algorithm for topological clusters suppresses noise by keeping only those cells with a significant energy deposit and their neighbouring cells. The ambient energy deposition in the event from pileup as well as from the underlying event is subtracted event-by-event by calculating the transverse energy density from low-pT jets, averaged over azimuth in two η regions, and subtracting it from the isolation cone transverse energy. In the case of muons, the normalised calorimetric isolation discriminant is defined as the sum of the calorimeter cells,ΣET, inside a cone of ∆R < 0.2 around the muon direction, divided by the muon pT. Muons are required to have a normalised calorimetric isolation less than 0.30 (0.15 in case of muons without an ID track).
For both the track- and calorimeter-based isolation any contributions arising from other leptons of the quadruplet are subtracted. The impact parameter significance, defined as the impact parameter divided by its uncertainty,d0/σd0, for all muons (electrons) is required to be lower than 3.5 (6.5). The electron impact parameter is affected by bremsstrahlung and it thus has a broader distribution.
The combined signal reconstruction and selection efficiency for mH = 125 GeV is 37% for the 4µ channel, 23% for the 2e2µ/2µ2e channel and 20% for the 4e channel. The efficiency losses for the 4µchannel are predominantly due to the geometric acceptance and the kinematic selection, while the electron channels have some additional loss from electron reconstruction and identification, which worsens at low ET. The final discriminating variable for this search is the four lepton invariant mass, m4`. Figure 1 presents the m4` distributions of a simulated signal sample for each of the final states (with 2e2µ/2µ2ecombined), withmH =125 GeV, at √
s=8 TeV. The width of the reconstructed Higgs boson mass distribution is dominated by the experimental resolution formH<350 GeV, while for higher mHthe reconstructed width is dominated by the natural width of the Higgs boson. The predicted natural width of the Higgs boson is approximately 4 MeV (29 GeV) atmH=125 (400) GeV.
[GeV]
µ
m4
80 90 100 110 120 130 140
a.u. / 0.5 GeV
0 0.02 0.04 0.06 0.08
0.1 ATLAS Preliminary
0.04) GeV
± m = (124.49
0.04) GeV
± = (2.00 σ
= 125 GeV mH Gaussian fit
: 0.19 σ
± 2 fraction outside
Simulation
(a)
[GeV]
µ 2e/2e2 µ
m2
80 90 100 110 120 130 140
a.u. / 0.5 GeV
0 0.01 0.02 0.03 0.04 0.05 0.06 0.07 0.08 0.09
ATLAS Preliminary
0.05) GeV
± m = (123.92
0.04) GeV
± = (2.26 σ
= 125 GeV mH Gaussian fit
: 0.17 σ
± 2 fraction outside
Simulation
(b)
[GeV]
m4e
80 90 100 110 120 130 140
a.u. / 0.5 GeV
0 0.01 0.02 0.03 0.04 0.05 0.06
0.07 ATLAS Preliminary
0.09) GeV
± m = (123.18
0.07) GeV
± = (2.59 σ
= 125 GeV mH Gaussian fit
: 0.15 σ
± 2 fraction outside
Simulation
(c)
Figure 1: Invariant mass distributions for simulated (a)H →ZZ(∗)→4µ, (b)H→ZZ(∗) →2µ2e/2e2µ and (c)H→ZZ(∗) →4eevents formH =125 GeV, at √
s=8 TeV. The fitted range for the Gaussian is chosen to be:−2σto 2σ(−1.5σto 2.5σ) for the 4µ(2µ2e/2e2µ/4e) channel. The slightly reduced mean values arise from radiative losses which are more important for channels involving electrons [69].
4.1.1 Signal modeling
The method introduced for signal modeling in this note is intended for the measurement of Higgs prop- erties. The signal mass distributions are obtained from simulation after applying a smoothing pro- cedure [72] that reduces the statistical fluctuations in the shapes. The shapes and uncertainties are parametrised as continuous functions of the Higgs mass obtained from simulation at various values of mHand intermediate distributions are obtained by interpolation.
4.2 Background estimation
The level of the irreducibleZZ(∗)background is estimated using MC simulation normalised to the theo- retical cross section, while the rate and composition of the reducible``+jets andt¯tbackground processes are evaluated with data-driven methods. The composition of the reducible backgrounds depends on the flavour of the sub-leading di-lepton and different approaches are taken for the``+µµand the``+ee final states. Section 4.2.1 and Section 4.2.2 discuss these two cases, respectively, and the yields for all reducible backgrounds in the signal region are summarised in Table 3 of Section 4.2.3. The background estimates follow closely the methods of Ref. [4] which were described in more detail in Ref. [73]. The present analysis includes some improved estimates and more cross checks.
4.2.1 ``+µµbackground
The ``+µµreducible background arises fromtt¯andZ+jets, where the Z+jets component has both a heavy quarkZbb¯ part and another fromπ/K in-flight decays. The number of background events from tt¯andZ+ jets is estimated from two control regions: one with an enhancedbb¯ contribution and π/K in-flight decays suppressed, and the other with both components augmented.
The enhanced bb¯ control region is obtained by removing the isolation requirement from the sub- leading pair, and requiring at least one of the sub-leading leptons to fail the impact parameter significance requirement. This removes the ZZ(∗) contribution, and allows both the tt¯and heavy quark Z + jets backgrounds to be estimated simultaneously.
As seen in Fig. 2(a), them12distribution has a flattt¯component, fitted with a second order Chebychev polynomial, and a peak at theZ boson mass for theZ+jets component, fitted with a Breit-Wigner line-
[GeV]
m12
50 60 70 80 90 100
Events/4 GeV
0 10 20 30 40 50 60
Data
t Z+jets and t
t tZZ MC Z+jets MC
MC t tWZ
Preliminary ATLAS
Ldt=13.0 fb-1
∫
= 8 TeV:
s
(a)
[GeV]
m12
50 60 70 80 90 100
Events/4 GeV
0 10 20 30 40 50 60
Data
t Z+jets and t
t tZZ MC
Z+jets MC rescaled MC
t tWZ
Preliminary ATLAS
Ldt=13.0 fb-1
∫
= 8 TeV:
s
(b)
Figure 2: Distribution ofm12, for √
s=8 TeV, in the control region where the isolation requirements are not applied to the two sub-leading muons, and at least one of these muons is required to fail the impact parameter significance requirement. The fit used to obtain the yields fort¯tandZ+jets is presented in (a), with the MC expectations also shown for comparison. The same distribution with theZ+jets MC rescaled by the data fit is shown in (b).
shape convolved with a Crystal-Ball resolution function. The shapes used in the unbinned fit are obtained from MC and the resulting fit parameters are allowed to vary by 10% in the data fit. The MC clearly underestimates the rate in data forZ+jets/bb¯and is thus re-scaled to fit the data for further use, as can be seen in Fig. 2(b). The number of events in the control region is then extrapolated to the signal region with a transfer factor which uses the efficiency of the impact parameter and isolation requirements obtained from the bb¯ MC. The MC description of the selection efficiency has been verified with data using a control region obtained by requiring a Z boson and exactly one extra muon. ThisZ boson is selected using the leading di-lepton requirements of this analysis for the two highest pT same-flavour opposite sign leptons. The systematic uncertainties on the extrapolation factors are obtained from the comparison of the MC to thisZ+µcontrol sample. These are used to estimate the systematic uncertainties on the number of background events in the signal region.
Replacing the above requirement on the impact parameter with a corresponding one on the track isolation enhances the bb¯ and tt¯backgrounds, still removes the ZZ(∗) component and also preserves a possible π/K in-flight decay background. The residual number of events from a Z boson mass fit after removing the re-scaledbb¯ MC estimate previously obtained is interpreted as aπ/K in-flight decay contribution. The π/K in-flight decay contributes∼20% to theZ +jets background estimate given in Table 3.
Thet¯tbackground is cross-checked using a control region defined by selecting events with ane±µ∓ di-lepton pair with an invariant mass between 50 and 106 GeV, accompanied by an opposite sign di- muon satisfying them34 selection. Events with aZ boson candidate decaying to a pair of electrons or muons, in the aforementioned mass range, are excluded. Isolation and impact parameter requirements are applied only to the leptons of theeµpair. This gives an estimate comparable to them12fit.
Finally, the``+µµbackground is also estimated by performing the full analysis but selecting same- sign pairs for the sub-leading di-muons. In this case, there remains no event belowm4` = 160 GeV in
either the 4µ+µ−or 2e2µsub-channel. This is consistent with the above estimate.
4.2.2 ``+eebackground
A sample of reconstruction-level objects identified as electron candidates will contain true isolated elec- trons, electrons from heavy flavour semi-leptonic decays (Q), electrons from photon conversion (γ) or light jets mis-reconstructed as electrons and denoted as fake electrons (f).
An``+eebackground control region is formed by relaxing the electron selection criteria for the electrons of the sub-leading pair. The different sources of electron background are then separated into reconstruction categories which are electron-like (E), and fake-like (F), using appropriate discriminating variables [74]. The variables used are: fraction of high threshold hits in the Transition Radiation Tracker (RTRT), the energy in the first layer of the electromagnetic calorimeter (f1) and the lateral containment of the cluster in the azimuthal direction in the second layer of the electromagnetic calorimeter (Rφ). Since only events from this control region can enter the signal region, this method directly accounts for most of the fluctuations in data. The efficiency needed to extrapolate the background yield of each category from the control region to the signal region is obtained from MC. This method estimates the sum ofZ+jets andtt¯background contributions. As a cross-check the same method is also applied to a similar control region containing same-sign sub-leading di-electrons.
The `` + eebackground is also estimated using a control region with same-sign sub-leading di- electrons, where the three highest pT leptons satisfy all the analysis criteria and the remaining electron is required to only fulfill the good track criteria (silicon hits >=7 and pixel hits >=1) and the lateral containment of the cluster energy alongη(Rη). This method will be referred to as 3`+`hereafter. In this case a simultaneous fit of templates, obtained from the nb−layerhits and the RTRT distributions, is used to estimate the yields for the different truth components: f, γ and Q. The templates used are obtained from MC. Additional checks are performed by replacing the RTRTwith f1or the distance inηbetween the extrapolated impact point of the track on the calorimeter and the cluster barycenter using the strips (∆η1). The difference in the results is taken into account as a systematic uncertainty.
Finally, the``+eebackground is also estimated by performing the full analysis but selecting same- sign pairs for the sub-leading di-electrons. In this case, there remain 6 (2) events belowm4` =160 GeV in the 4e(2µ2e) sub-channels. Since thebb¯ background contribution is small, the same-sign estimate is expected to be close to the opposite-sign estimates. This is the case within the statistical uncertainty.
The expected``+eebackground yields in the signal region are summarised in Table 3.
4.2.3 Summary of background estimates
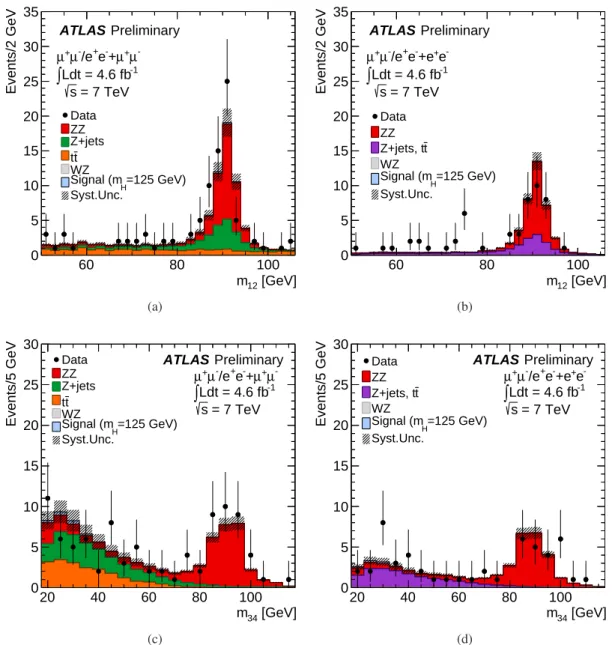
The results of all the background estimation methods are summarised in Table 3. The m12 and m34 distributions, for events selected by the analysis when relaxing the isolation and impact parameter re- quirements for the sub-leading di-lepton, are presented in Fig. 3. The events are divided according to the flavour of the sub-leading lepton pair into ``+µµand``+eesamples. In Figs. 3(a) and 3(c) them12 andm34 distributions are presented for``+µµevents, while in Figs. 3(b) and 3(d) the corresponding distributions are presented for``+eeevents. The shape and normalisation of the backgrounds discussed earlier are in good agreement with data. This is observed both for large values ofm34, where theZZ(∗) background dominates, and for lowm34values.
Table 3: Summary of the estimated numbers ofZ+jets andt¯tbackground events for the 13.0 fb−1 of
√s = 8 TeV data for the full mass range of the analysis after the kinematic selections described in the text. The “†” symbol indicates the estimates used for the background normalisation, the others being cross-checks. The first uncertainty is statistical, while the second is systematic. The sub-leading same sign full analysis estimates havem4`<160 GeV.
Method Estimate
4µ
m12fit:Z+jets contribution 1.8±0.4±0.4† m12fit: tt¯contribution 0.07±0.02±0.02† Sub-leading same sign full analysis 0
2e2µ
m12fit:Z+jets contribution 1.5±0.3±0.3† m12fit: t¯tcontribution 0.08±0.02±0.03† Sub-leading same sign full analysis 0
2µ2e
``+e±e∓ 4.7±0.7±0.7†
``+e±e± 3.5±0.7±0.7
3`+`(same-sign) 4.9±0.3±0.5 Sub-leading same sign full analysis 2
4e
``+e±e∓ 7.2±0.9±0.7†
``+e±e± 4.3±0.8±0.6
3`+`(same-sign) 4.5±0.4±0.6 Sub-leading same sign full analysis 6
[GeV]
m12
60 80 100
Events/2 GeV
0 20 40 60 80 100
Data ZZ Z+jets
t t
WZ =125 GeV)
Signal (mH
Syst.Unc.
Preliminary ATLAS
Ldt = 13.0 fb-1
∫ s = 8 TeV µ-
µ+ -+
+e
-/e µ µ+
(a)
[GeV]
m12
60 80 100
Events/2 GeV
0 20 40 60 80 100
Data ZZ
t Z+jets, t WZ
=125 GeV) Signal (mH
Syst.Unc.
Preliminary ATLAS
Ldt = 13.0 fb-1
∫ s = 8 TeV e-
+e+
e-
/e+
µ-
µ+
(b)
[GeV]
m34
20 40 60 80 100
Events/5 GeV
0 10 20 30 40 50 60 70 80 90 100
Data ZZ Z+jets
t t
WZ =125 GeV)
Signal (mH
Syst.Unc.
Preliminary ATLAS
Ldt = 13.0 fb-1
∫s = 8 TeV µ-
µ+ -+
+e
-/e µ µ+
(c)
[GeV]
m34
20 40 60 80 100
Events/5 GeV
0 10 20 30 40 50 60 70 80 90 100
Data ZZ
t Z+jets, t WZ
=125 GeV) Signal (mH
Syst.Unc.
Preliminary ATLAS
Ldt = 13.0 fb-1
∫s = 8 TeV e-
+e+
e-
/e+
µ-
µ+
(d)
Figure 3: Invariant mass distributions of the lepton pairs in the control sample defined by a Z boson candidate and an additional same-flavour lepton pair, for the √
s=8 TeV data set. The sample is divided according to the flavour of the additional lepton pair. In (a) them12 and in (c) them34distributions are presented for`` µ+µ−/e+e−
+µ+µ−events. In (b) them12and in (d) them34distributions are presented for`` µ+µ−/e+e−
+e+e−events. The kinematic selection of the analysis is applied. Isolation and impact parameter significance requirements are applied to the leading lepton pair only. The MC is normalized to the data-driven background estimations given in Table 3. Finally, the expected SM Higgs signal for mH =125 GeV is also shown.
5 Signal and Background Analysis of √
s = 7 TeV data
In this section the analysis of the 2011 √
s = 7 TeV data, using the same kinematic selection as the
√s=8 TeV analysis, is presented.
The data collected during 2011 are subjected to quality requirements identical to those used for the 2012 data. The resulting integrated luminosity is 4.6 fb−1for all final states.
5.1 Lepton Reconstruction/Identification and Event Selection
The data considered in this analysis are selected using single-lepton or di-lepton triggers. For the single- muon trigger the pT threshold is 18 GeV, while for the single-electron trigger the ET threshold is 20−22 GeV depending on the LHC data-taking period. For the di-muon and di-electron triggers the thresholds are pT =10 GeV for each muon, andET =12 GeV for both electrons.
For the √
s = 7 TeV data set, the electron reconstruction proceeds as described in Section 4.1, but without the improved electron track reconstruction and the cluster-to-track matching algorithm. The electron candidates are refitted using a Gaussian-sum filter, which improves the measured electron di- rection and thus the impact parameter resolution. Electron reconstruction and identification is similar to that used in Ref. [75].
The event selection is identical between √
s = 7 TeV and √
s = 8 TeV data analyses with the following exceptions for 2011:
− For the electron track isolation, included tracks are required to have at least seven silicon hits, one b-layer hit and pT >1 GeV.
− The calorimeter isolation of electrons is cell-based rather than topological cluster based and the calorimeter isolation normalised to the electronETcut is 0.3 instead of 0.2.
The combined signal reconstruction and selection efficiency formH = 125 GeV is 39% for the 4µ channel, 21% for the 2e2µ/2µ2echannel and 15% for the 4echannel.
5.2 Background Estimation
The background estimation strategy in the √
s=7 TeV data sample is identical to the √
s=8 TeV one, described in Section 4.2. The final expectations in the signal region are summarised in Table 4.
Figure 4 displays the invariant masses of lepton pairs in events with aZ boson candidate and an additional same-flavour lepton pair, selected by applying the kinematic requirements of the analysis, and by applying isolation requirements to the first lepton pair only. In Figs. 4(a) and 4(c) them12andm34 distributions are presented for``+µµevents, while in Figs. 4(b) and 4(d) the corresponding distributions are presented for ``+eeevents. The MC is rescaled to data for Z+jets/bb¯ in the Z+µµchannel as discussed for Fig. 2(b). The shape and normalisation of the backgrounds are in good agreement with data; this is observed both for large values ofm34, where theZZ(∗)background dominates, and for low m34values. Finally, the background rates for √
s=7 TeV agree within their uncertainties with the rates for √
s =8 TeV after accounting for the increasing cross sections forZ+jets/bb¯ andt¯twith increasing energy.
Table 4: Summary of the estimated numbers ofZ+jets andtt¯background events for the 4.6 fb−1 √ s= 7 TeV data for the full mass range of the analysis after the kinematic selections described in the text. The
“†” symbol indicates the estimates used for the background normalisation, the others being cross-checks.
The first uncertainty is statistical, while the second is systematic. The sub-leading same sign full analysis estimates havem4`<160 GeV.
Method Estimated
number of events 4µ
m12fit: Z+jets contribution 0.27±0.10±0.08† m12fit:t¯tcontribution 0.02±0.01±0.01† Sub-leading same sign full analysis 0
2e2µ
m12fit: Z+jets contribution 0.21±0.08±0.06† m12fit:tt¯contribution 0.02±0.01±0.01† Sub-leading same sign full analysis 0
2µ2e
``+e±e∓ 2.6±0.4±0.4†
``+e±e± 3.7±0.9±0.6
3`+`(same-sign) 2.0±0.5±0.3 Sub-leading same sign full analysis 0
4e
``+e±e∓ 3.1±0.6±0.5†
``+e±e± 3.2±0.6±0.5
3`+`(same-sign) 2.2±0.5±0.3 Sub-leading same sign full analysis 2
[GeV]
m12
60 80 100
Events/2 GeV
0 5 10 15 20 25 30 35
Data ZZ Z+jets
t t
WZ =125 GeV)
Signal (mH
Syst.Unc.
Preliminary ATLAS
Ldt = 4.6 fb-1
∫ s = 7 TeV µ-
µ+ -+
+e
-/e µ µ+
(a)
[GeV]
m12
60 80 100
Events/2 GeV
0 5 10 15 20 25 30 35
Data ZZ
t Z+jets, t WZ
=125 GeV) Signal (mH
Syst.Unc.
Preliminary ATLAS
Ldt = 4.6 fb-1
∫ s = 7 TeV e-
+e+
e-
/e+
µ-
µ+
(b)
[GeV]
m34
20 40 60 80 100
Events/5 GeV
0 5 10 15 20 25 30
Data ZZ Z+jets
t t
WZ =125 GeV)
Signal (mH
Syst.Unc.
Preliminary ATLAS
Ldt = 4.6 fb-1
∫s = 7 TeV µ-
µ+ -+
+e
-/e µ µ+
(c)
[GeV]
m34
20 40 60 80 100
Events/5 GeV
0 5 10 15 20 25 30
Data ZZ
t Z+jets, t WZ
=125 GeV) Signal (mH
Syst.Unc.
Preliminary ATLAS
Ldt = 4.6 fb-1
∫s = 7 TeV e-
+e+
e-
/e+
µ-
µ+
(d)
Figure 4: Invariant mass distributions of the lepton pairs in the control sample defined by a Z boson candidate and an additional same-flavour lepton pair for the √
s = 7 TeV data sample. The sample is divided according to the flavour of the additional lepton pair. In (a) the m12 and in (c) them34 distri- butions are presented for`` µ+µ−/e+e−
+µ+µ−events. In (b) them12 and in (d) them34distributions are presented for`` µ+µ−/e+e−
+e+e−events. The kinematic selections of the analysis are applied.
Isolation and impact parameter significance requirements are applied to the leading lepton pair only. The MC is normalized to the data-driven background estimations given in Table 4. Finally, the the expected SM Higgs signal formH=125 GeV is also shown.
6 Measurement of the Spin and Parity
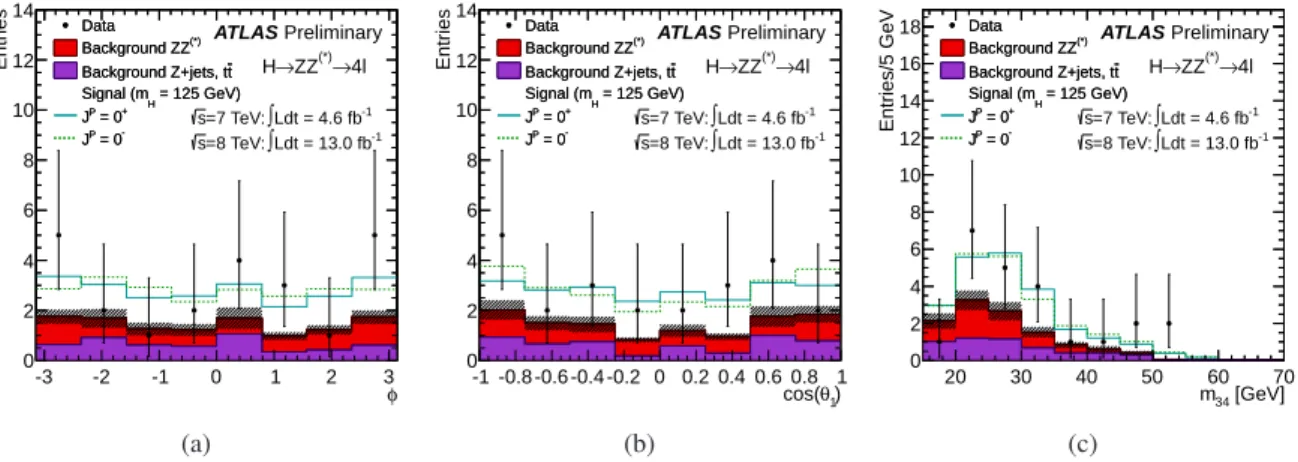
For X → ZZ(∗) → 4`decays, the observables sensitive to the underlying spin and parity of X are the masses of the two Z bosons, a production angle, θ∗, and four decay angles, Φ1, Φ, θ1 and θ2. The production and decay angles are illustrated in Figure 5 and are defined as:
− θ1 (θ2) is the angle between the negative final state lepton and the direction of flight ofZ1 (Z2) in theZrest frame.
− Φis the angle between the decay planes of the four final state leptons expressed in the four lepton rest frame.
− Φ1is the angle defined between the decay plane of the leading lepton pair and a plane defined by the vector of theZ1in the four lepton rest frame and the positive direction of the parton axis.
− θ∗is the production angle of theZ1defined in the four lepton rest frame.
Figure 5: Definition of the production and decay angles in anX →ZZ(∗) →4`decay. The illustration is drawn with the beam axis in the lab frame, theZ1andZ2in the Xrest frame and the leptons in their corresponding parent rest frame (see text for further description).
In the case of a spin zero boson, the production cross section does not depend on the production angleθ∗nor the decay angleΦ1sinceXhas no spin axis with which one can define these angles. In this case, different parities can be distinguished by studying the decay anglesΦ, θ1, θ2. On the other hand, all the angles are important when discriminating between the cases of non-zero integer spin. Finally, it should be noted that in the low mass region (mH <180 GeV) the shapes of them12andm34distributions become sensitive to spin and parity.
In this study, four hypotheses for spin/parity states are tested, namelyJP0+, 0−,2+, 2−. As mentioned in Section 1, the spin 1 hypothesis is excluded by the observation ofX →γγ, and is not considered for this note. The spin 2 states correspond to a graviton-like tensor with minimal couplings (2+m), equivalent to a Kaluza Klein graviton, and a pseudo-tensor (2−), both minimally suppressed by the energy scale.
This study follows the notation discussed in Refs. [66] and [76], with couplingsg1 (in production and decay) andg5 (in decay) set to 1 for 2+mand couplingsg1 (in production), andg8 andg9 (in decay) set to 1 for 2−, and only gluon fusion production is considered. The pseudo-tensor (2−) model [66] used