A TLAS-CONF-2013-022 10 Mar ch 2013
ATLAS NOTE
ATLAS-COM-CONF-2013-036
March 9, 2013
Inclusive cross sections of isolated prompt photons in pp collisions at
√ s = 7 TeV measured with the ATLAS detector using 4.7 fb −1 of data
The ATLAS Collaboration
Abstract
A measurement of the cross section for the production of isolated prompt photons in pp collisions at a center-of-mass energy √
s = 7 TeV is presented. The results are based on an integrated luminosity of 4.7 fb
−1collected with the ATLAS detector at the LHC. The cross section is measured as a function of photon transverse energy E
γTin the kinematic range 100 ≤ E
γT< 1000 GeV and in the pseudorapidity regions |η
γ| < 1.37 and 1.52 ≤ |η
γ| < 2.37.
The results are compared to leading-order parton-shower Monte Carlo models and next- to-leading-order perturbative QCD calculations. Next-to-leading-order perturbative QCD calculations show good agreement with the differential cross sections.
c
Copyright 2013 CERN for the benefit of the ATLAS Collaboration.
Reproduction of this article or parts of it is allowed as specified in the CC-BY-3.0 license.
1 Introduction
Prompt photon production at hadron colliders allows precise tests of perturbative QCD predictions [1]
by providing a colorless probe of the hard scattering process. The measurement is sensitive to the gluon content of the proton through the qg → qγ process, which dominates the prompt photon production cross section at the LHC, and can thus be used to constrain parton distribution functions (PDFs) [2].
Recent measurements of the production cross section of isolated prompt photons have been per- formed by ATLAS [3, 4] and CMS [5, 6] using pp collision data at √
s = 7 TeV at the LHC. Earlier mea- surements were made by CDF and D0 using p p ¯ collisions collected at √
s = 1.8 TeV and √
s = 1.96 TeV at the Tevatron [7, 8, 9, 10].
In this paper, the production cross section of isolated prompt photons is measured in the transverse energy (E
γT) range between 100 GeV and 1 TeV, extending the result of the previous ATLAS measure- ment [4] which covered the range between 45 GeV and 400 GeV. The di ff erential cross section as a func- tion of E
γTis measured in the pseudorapidity
1range |η
γ| < 1.37 (the barrel region) and 1.52 ≤ |η
γ| < 2.37 (the end-cap region). In these pseudorapidity regions photon reconstruction has a high e ffi ciency and a low background rate. The di ff erential cross section is also studied as a function of η
γfor E
γT> 100 GeV.
The data sample corresponds to an integrated luminosity of 4.71 ± 0.09 fb
−1[11]; thus this analysis uses a data set more than two orders of magnitude larger than that used in the previous measurement [4].
In the following, all photons produced in proton–proton collisions and not secondary to hadron de- cays are considered as “prompt”. They include both “direct” photons, which originate from the hard processes calculated in fixed-order perturbation theory, and “fragmentation” photons, which are the re- sult of the soft fragmentation of a colored high p
Tparton [12, 13]. Photons are considered “isolated”
if the transverse energy (E
Tiso) within a cone of radius ∆ R = p
(δη)
2+ (δφ)
2= 0.4 centered around the photon in the pseudorapidity and azimuthal angle (φ) is smaller than 7 GeV. In next-to-leading-order (NLO) parton-level theoretical calculations, E
isoTis calculated from all partons within the cone, while in the leading-order (LO) parton-shower Monte Carlo (MC) simulations it is calculated from all the gener- ated particles (except muons and neutrinos) inside the cone. Experimentally, E
isoTis calculated from the energy deposited in the calorimeters in a ∆ R = 0.4 cone around the photon candidate, corrected for the effects associated with the energy of the photon candidate itself, the underlying event and the additional pp interactions in the same bunch crossing (pileup) [14]. The main background for the prompt photons consists of photons from decays of light neutral mesons such as the π
0or η.
2 The ATLAS detector
ATLAS [15] is a multipurpose detector with a forward-backward symmetric cylindrical geometry and nearly 4π coverage in solid angle. The most relevant subdetectors for the present analysis are the inner tracking detector (ID) and the calorimeters.
The ID consists of a silicon pixel detector and a silicon microstrip detector covering the pseudora- pidity range |η| < 2.5, and a straw tube transition radiation tracker covering |η| < 2.0. It is immersed in a 2 T magnetic field provided by a superconducting solenoid. The ID allows efficient reconstruction of converted photons if the conversion occurs at a radius of less than 0.80 m.
The electromagnetic calorimeter (ECAL) is a lead / liquid-argon (LAr) sampling calorimeter provid- ing coverage for |η| < 3.2. It consists of a barrel section (|η| < 1.475) and two end-caps (1.375 < |η| <
1
ATLAS uses a right-handed coordinate system with its origin at the nominal interaction point (IP) in the center of the detector, and the
z-axis along the beam line. Thex-axis points from the IP to the center of the LHC ring, and they-axis pointsupwards. Cylindrical coordinates (r, φ) are used in the transverse plane,
φbeing the azimuthal angle around the beam line.
Observables labelled “transverse” are projected into the
x−yplane. The pseudorapidity is defined in terms of the polar angle
θas
η=−ln tan(θ/2).
3.2). The central region (|η| < 2.5) is segmented into three longitudinal layers. The first (inner) layer, covering |η| < 1.4 in the barrel and 1.5 < |η| < 2.4 in the end-caps, has a high η granularity (between 0.003 and 0.006 depending on η), which can be used to provide event-by-event discrimination between single-photon showers and two overlapping showers such as may be produced by π
0decay. The second layer, which collects most of the energy deposited in the calorimeter by the photon shower, has a cell granularity of 0.025 × 0.025 in η × φ. The third layer is used to correct high energy showers for leakage.
In front of the ECAL a thin presampler layer, covering the pseudorapidity interval |η| < 1.8, is used to correct for energy loss before the ECAL.
The hadronic calorimeter (HCAL), surrounding the ECAL, consists of an iron/scintillator-tile calorime- ter in the range |η| < 1.7, and two copper/LAr calorimeters spanning 1.5 < |η| < 3.2. The ECAL and HCAL acceptance is extended by two LAr forward calorimeters (using copper and tungsten as absorbers) up to |η| = 4.9.
A three-level trigger system is used to select events containing photon candidates. The first level (level-1) is implemented in hardware and is based on towers with a coarser granularity (0.1 × 0.1 in η × φ) than that of the ECAL. They are used to search for electromagnetic deposits in η × φ regions of 2 × 1 and 1 × 2 towers, within a fixed window of size 2 × 2 and with an E
γTabove a programmable threshold. The algorithms of the second and third level triggers (collectively referred to as the high-level trigger) are implemented in software. The high-level trigger exploits the full granularity and precision of the calorimeter to refine the level-1 trigger selection, based on improved energy resolution and detailed information on energy deposition in the calorimeter cells.
3 Data and simulated samples
3.1 Collision Data selection
The measurement presented here is based on proton-proton collision data collected at a center-of-mass energy of √
s = 7 TeV with the ATLAS detector at the LHC in 2011. Only events where both the calorimeter and the ID are fully operational and which have good data quality are used. Events are triggered using a high-level photon trigger, with a nominal E
Tγthreshold of 80 GeV. The trigger selection criteria on the fraction and profile of the energy measured in the various layers of the calorimeters are looser than the photon identification criteria applied in this analysis; see Section 4.3. For 2011, the average number of pp interactions in the same bunch crossing is nine on average. Events are required to have a reconstructed primary vertex consistent with the average beam-spot position and with at least three associated tracks.
3.2 Simulated events
To study the characteristics of signal and background events, MC samples are generated using PYTHIA 6.4 [16], a LO parton-shower MC generator, with the modified LO MRST2007 [17] PDF. The event generator parameters are set according to the ATLAS AMBT2 tune [18]. The ATLAS detector response is simulated using the GEANT4 program [19]. In order to have a realistic description of the experimental conditions under which the data are taken, pileup interactions are included in the simulation. The pileup in the simulation is tuned to reproduce the distribution of the reconstructed primary vertices per event ob- served in the analyzed data sample. These samples are then reconstructed with the same algorithms used for data. More details on the event generation and simulation infrastructure of the ATLAS experiment are provided in Ref. [20].
For the study of systematic uncertainties and for comparisons with the final cross sections, events are
generated with the HERWIG 6.5 [21] model using the ATLAS AUET2 tune [22] and the same PDFs as
used for the PYTHIA event generation. HERWIG and PYTHIA use different parton shower and hadronization models.
Signal MC samples include both hard-scattering photons from the LO processes qg → qγ and q q ¯ → gγ, and photons from QED radiation from quarks produced in QCD 2 → 2 processes.
To study background processes, MC samples enriched in photons from meson decays with an E
γT>
100 GeV are used. The samples are generated using all tree-level 2 → 2 QCD processes, removing γ-jet events from quark bremsstrahlung. Events are filtered after event generation by requiring the E
γTin a 0.18 × 0.18 region in η × φ at the truth particle level to be greater than 70 GeV.
4 Photon selection
The reconstruction of photons in the ATLAS detector is described in detail elsewhere (see Refs. [23, 24]).
The selection of photons is discussed in the following three sections: kinematic preselection, isolation selection and finally shower identification.
4.1 Photon kinematic preselection
As already detailed in Section 3, photon candidates are first required to have passed an 80 GeV trigger.
From these, only those with calibrated transverse energies above 100 GeV are retained for the subsequent analysis. The calibration includes an in-situ technique based on the Z boson mass peak [25]. In order to benefit from the fine segmentation of the first layer of the ECAL for identification of genuine prompt photons, the photon candidates should lie within the barrel or the end-cap pseudorapidity regions. After the selection, 2,666,325 photon candidates remain in the data sample.
4.2 Photon isolation selection
Isolation is an important observable for prompt photon studies. The prompt photon signal is expected to be more isolated from hadronic activity than the background. Also, because of the mixture of hard- scattering and fragmentation contributions in the prompt photon signal, it is important to have a well modeled isolation variable that can be linked to the parton-level isolation cut used in NLO QCD compu- tations. A robust isolation prescription will help limit the non-perturbative fragmentation contribution, which is poorly understood in theory, while retaining the signal produced from direct processes.
This study uses the same definition of the cone isolation variable, E
isoTas for the previous ATLAS measurement [4]. It is computed using calorimeter cells from both the ECAL and HCAL, in a cone of radius ∆ R = 0.4 around the photon candidate. The contributions from the 5 × 7 ECAL cells in the η × φ space around the photon barycenter are not included in the calculation. The expected small value of the leakage from the photons outside this region, evaluated as a function of the E
γTin simulated samples of single photons, is then subtracted from the isolation variable. The contribution to the photon isolation energy from the underlying event and pileup is subtracted using the procedure proposed in Refs. [26, 27]
and implemented as described in Ref. [3]. After these corrections, the transverse isolation energy of simulated prompt photons is independent of the E
γT. A residual mild dependence on in-time pileup (from collisions of protons in the same bunches as the photons produced from the hard scattering) is observed for this isolation variable. This is due to the inconsistent treatment of noise in the calculation of the uncorrected isolation variable. The uncorrected isolation is computed from cells without noise suppression whereas the pileup correction is computed from noise suppressed topological clusters. The pileup dependence of E
Tisois well modeled in the simulation.
In the following, all photon candidates having reconstructed isolation energies E
Tiso< 7 GeV are
considered experimentally “isolated”, while candidates with E
isoT> 7 GeV are considered “non-isolated”.
These definitions are applied to the data and to the MC calculations at both parton and particle level. The isolation requirement E
isoT< 7 GeV is looser than that used in the previous analysis [4]; and is chosen in order to optimize the signal purity and the photon reconstruction efficiency at high E
γT.
4.3 Photon shower-shape identification
Shape variables computed from the lateral and longitudinal energy profiles of the shower in the ECAL are used to further discriminate the signal from the background. The selection criteria do not depend on the photon candidate’s transverse energy, but vary as a function of the photon reconstructed pseudorapidity to take into account significant changes in the total thickness of the upstream material and variations in the calorimeter geometry or granularity. The same “tight” selection criteria used in the measurement of the isolated photon-pair production cross section [14] are applied. After the photon identification requirements, 1,329,035 (616,807) photon candidates remain in the barrel (end-cap) η
γregion. The fraction of converted photons is 32% (45%) in the barrel (end-cap) η
γregion. There are 19 photon candidates with E
Tγbetween 800 GeV and 1 TeV region. The total number of events with more than one good photon candidate after the photon identification requirements is 1240.
5 Background estimation and signal extraction
The main background for prompt photons is due to hadronic jets containing π
0mesons that carry most of the jet energy and that decay to photon pairs. Such background photons are expected to be less isolated than prompt ones due to activity from the other particles in the jet. The isolation energy, E
isoT, therefore provides a discrimination between prompt photons and photons from jets and meson decays. To avoid relying on the simulation to model accurately the energy flow inside jets and the fragmentation to π
0s, a data-driven technique is used as much as possible in order to extract the background isolation distribution.
This requires the selection of an unbiased background-enhanced sample of photon candidates.
Among the shower-shape variables used in the photon selection, some measured in the first ECAL layer are fairly uncorrelated with the E
isoT. A background-enhanced sample is provided by requiring the photon candidates to fail the “tight” identification criteria on at least one of four variables computed from the finely segmented first layer of the calorimeter, and to pass all the other criteria. From now on, such photons will be called “non-tight candidates”, while the photon candidates satisfying the “tight”
selection will be called “tight candidates”.
The residual background contamination in the selected event sample is estimated using the “two- dimensional side bands” method [3]. It is based on the definition of a “tight-isolated” signal region A and three background control regions B, C, D: “tight-non isolated”, “non tight-isolated” and “non tight- non isolated”, respectively. The basic method assumes that the control regions have negligible signal contamination and that the isolation energy distribution of background events is the same for tight and non-tight candidates. In that case the signal yield in region A, N
SA, can be obtained from the number N
kof events observed in data, in each of the four regions k = A, B, C, and D, as
N
SA= N
A− N
CN
BN
D. (1)
The method can easily be extended to account for deviations from the previous hypotheses, requiring only a limited knowledge of the signal and background properties: in that case, the equation to solve is
N
SA= N
A− R
BKG(N
B− c
BN
SA)(N
C− c
CN
SA)
(N
D− c
DN
SA) , (2)
where c
k=
NNksigA sigare the fractions of signal events expected in each of the three control regions, relative to the signal region A, and R
BKG=
NNbkgAB NbkgDbkgNCbkg
characterizes the correlation between the isolation and identification variables in background events (R
BKG= 1 when the correlations are negligible).
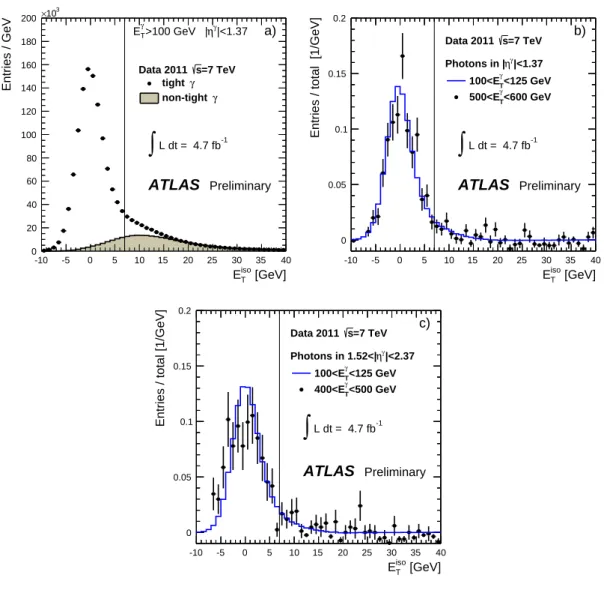
Figure 1(a) shows the distribution of E
isoTfor tight and non-tight candidates. The latter is normalized to the former in the background-dominated region E
Tiso> 15 GeV. The agreement between the two shapes for E
Tiso> 15 GeV reinforces the assumption that a good background estimation can be obtained from the non-tight sample. The excess of tight candidates over normalized non-tight candidates in the region E
Tiso< 15 GeV shows a clear peak for signal prompt photons. Fig. 1(b-c) show the isolation profile of photon candidates after subtracting the distribution of non-tight candidates (with the same normalization as applied in Fig. 1(a)), for di ff erent ranges of the photon candidate transverse energy in the two different η
γregions. The distributions of these signal-enriched samples are largely independent of the E
γTrange, as expected from the simulation.
In the following, Eq. (2) is used to estimate the prompt photon yield in the selected sample, with R
BKGfixed to 1 as observed (within uncertainties) in simulated background events. Results obtained neglecting signal leakage in the control regions, as in Eq. (1), or with R
BKG, 1 are used to evaluate systematic uncertainties. In the end-cap region the statistics are too low for the 500 to 600 GeV bin, therefore, the signal purity from the preceding bin is used instead.
The MC simulations indicate that the energy resolution of photons in the range 100 < E
γT< 600 GeV is close to 3%. The widths of the bins for the E
Tγ-di ff erential cross section measurement are chosen to keep the migration between neighboring E
γTbins below 1%. These residual migration effects, which affect the signal purity in a given E
γTbin, are taken into account using corrections based on the signal MC.
Background photons from meson decays are the largest contributing factor to the value of signal purity. Figure 2 shows the signal purity for prompt photons in region A as a function of E
Tγfor the barrel and end-cap regions. The signal purity is estimated from the data using the two-dimensional side band approach shown in Eq. (1). The shaded bands indicate systematic uncertainties on the signal purity as discussed in Section 8. The measured signal purity is larger than 90% and increases with E
γT. The signal purity estimated using the correlated approach shown in Eq. (2) agrees with that using the uncorrelated approach within 4%, and has a similar dependence on E
Tγ.
6 Residual background
A possible residual background could arise from electrons that fake photons; primarily high-p
Tisolated electrons from W or Z-boson decays that tend to be misidentified as converted photons. This is particu- larly the case when no hit in the innermost layer of the pixel detector is associated with the electron track and thus the electron is mistakenly assigned to a converted photon vertex. The corresponding misiden- tification probability is measured by studying the invariant mass spectrum of e
±γ combinations in the Z mass range. It was found that such contamination is ≈ 0.5% for E
γT< 400 GeV [4].
To understand the background from electrons for higher E
γT, a MC study was performed using a
sample of high-p
Telectrons. The current analysis neglects contributions from high-p
Tisolated electrons,
since the MC study indicates that the rate of misidentified photons with E
γT> 500 GeV originating from
electrons is less than 0.5%.
[GeV]
iso
ET
-10 -5 0 5 10 15 20 25 30 35 40
Entries / GeV
0 20 40 60 80 100 120 140 160 180 200
103
×
=7 TeV s Data 2011
γ tight
γ non-tight
|<1.37 ηγ
>100 GeV |
γ
ET
ATLAS
Preliminary L dt = 4.7 fb-1∫
a)
[GeV]
iso
ET
-10 -5 0 5 10 15 20 25 30 35 40
Entries / total [1/GeV]
0 0.05 0.1 0.15 0.2
=7 TeV s Data 2011
|<1.37 ηγ
Photons in |
<125 GeV
γ
100<ET
<600 GeV
γ
500<ET
ATLAS
Preliminary L dt = 4.7 fb-1∫
b)
[GeV]
iso
ET
-10 -5 0 5 10 15 20 25 30 35 40
Entries / total [1/GeV]
0 0.05 0.1 0.15 0.2
=7 TeV s Data 2011
|<2.37 ηγ
Photons in 1.52<|
<125 GeV
γ
100<ET
<500 GeV
γ
400<ET
ATLAS
Preliminary L dt = 4.7 fb-1∫
c)
Figure 1: (a): E
Tisodistribution of tight (solid dots) and non-tight (shaded gray region) photon candidates in data, for E
γT> 100 GeV for the central η
γregion. The latter is normalized to the former for E
isoT>
15 GeV. The excess of tight candidates over the normalized non-tight candidates for E
isoT< 15 GeV
shows a clear peak from signal prompt photons. (b)-(c): E
Tisodistributions of tight photons in the barrel
and end-cap regions after subtracting the normalized non-tight distribution, for two representative regions
with different E
γT. The vertical lines show the requirement E
Tγ< 7 GeV used to define the final cross
sections.
100 200 300 400 500 600 700 800 900 1000 0.8
0.85 0.9 0.95 1 1.05
1.1
[GeV]
γ
ET
100 200 300 400 500 600 700 800 900 1000
Signal purity
0.8 0.85 0.9 0.95 1 1.05
1.1
=7 TeV s Data 2011
|<1.37 η
|
|<2.37 η 1.52<|
L dt = 4.7 fb-1
∫
ATLAS
PreliminaryFigure 2: The signal purity for the barrel and end-cap η
γregions estimated from the data using the two- dimensional side band approach shown in Eq. (1). The shaded bands indicate statistical and systematic uncertainties on the signal purity determination as discussed in Section 8.
7 Cross section measurement
The differential cross section for the production of isolated prompt photons in a given phase space bin i is N
i/(C
i(γ) · ∆
i· R
Ldt), where N
iis the number of photons in a bin i after the background subtraction, C
i(γ) is a correction factor, ∆
iis the width of bin i and R
Ldt is the integrated luminosity. The correction factor, C
i(γ), is evaluated from the bin-by-bin ratio of the reconstructed and the particle-level prompt photons in the signal simulation. The photon reconstruction in the MC simulation was tuned using data-driven techniques [28]. The correction factor C
i(γ) accounts for photon reconstruction and selection e ffi ciency, as well as the event selection efficiency. They are discussed in more detail below:
• Photon reconstruction and selection efficiency. This is the efficiency for a particle level prompt photon, in the acceptance of the di ff erential cross section, to be reconstructed as a photon passing all the photon selection criteria outlined in Section 6. It is determined by using simulated sig- nal events after correcting the simulated calorimeter shower-shapes to match those observed in data [3]. The shower-shape corrections for the MC simulation are determined from the compari- son of data with the simulation in the control samples of photons selected in the same kinematic regions as used in this measurement.
• Event selection efficiency. This efficiency includes the trigger efficiency which is defined as the efficiency for an event to pass through a photon trigger with the an energy threshold of 80 GeV. The trigger e ffi ciency is determined using a data-driven technique based on low-E
Tγthreshold high-level triggers, and it is estimated to be 100
+0−3% for E
γT> 100 GeV [29].
The average value of the C
i(γ) estimated using PYTHIA is about 93% for the barrel region and 85%
in the end-cap region. It increases with E
Tγby approximately 2% in the range of E
Tγexplored in this
measurement.
8 Systematic uncertainties
The systematic uncertainties on the measured di ff erential cross sections are determined by changing the selection or the analysis procedure and repeating the analysis. The systematic variations affect the C
i(γ) and signal purity, thus lead to the overall change in the cross section. The largest uncertainties are described below:
• Uncertainty due to discrepancies between the true isolation energy and the reconstructed isolation energy. A typical shift between the true and reconstructed isolation in the MC simulation is less than 1 GeV [4]. The systematic uncertainty on the cross section was estimated by changing the true isolation requirement by ±1 GeV and recalculating the correction factors C
i(γ). This systematic variation leads to a typical uncertainty below 2% for all E
Tγexplored in this measurement.
• A typical shift between data and MC simulation for E
Tisois less than 0.5 GeV. Therefore, the measurement is repeated by keeping the isolation cut on data at E
isoT= 7 GeV, and varying the isolation threshold by ±0.5 GeV in the MC simulation. This uncertainty is found to be less than 1%, does not depend on E
γT, and is compatible with statistical uncertainty.
• Uncertainty due to photon energy measurement is calculated by varying the photon energy scale within the expected uncertainty in the MC simulation. This uncertainty mostly affects the C
i(γ).
The e ff ect of such a variation leads to an uncertainty between 2% at low E
Tγand 6% at large E
Tγ.
• Uncertainty on the C
i(γ) due to the choice of the MC generator is computed by considering HERWIG for the bin-by-bin correction. This uncertainty ranges from 2% at low E
Tγto 5% at E
γT> 800 GeV.
• Uncertainty on the background subtraction is estimated using alternative background subtraction techniques discussed in Section 5. Eq. (2) is modified to either neglect signal leakage or have R
BKG, 1. The background is subtracted by either neglecting correlations between the signal and background regions, or using the central values of the correlations estimated from simulated background events. This uncertainty on the cross section varies between 3% and 4% for all E
γTexplored in this measurement.
• Uncertainty arising from the definition of the background control regions is estimated by repeating the measurement using an alternative definition of the non-isolated region. The isolation require- ment was increased from 7 to 10 GeV. Such definition affects both the signal purity and the cor- rection factor C
i(γ). An effect of 1% or less for all E
γTexplored in this measurement is observed, which is compatible with statistical uncertainty.
• The measurement is repeated using an alternative definition of the photon transverse isolation energy, based on three-dimensional topological clusters of energy deposits in the calorimeters, a ff ecting mostly the photon reconstruction e ffi ciency. The same calorimeter cells are used for both the calculation of the photon isolation and for the subtraction of the contribution from the underlying event and pileup, thus providing a quantity which is less pileup dependent. A difference smaller than 5% is found between the alternative and the nominal results.
• The systematic uncertainty on the cross section due to the photon energy resolution is calculated by smearing the reconstructed energy in the MC simulations used for the background subtraction and C
i(γ). This uncertainty is typically 1% for all E
Tγexplored in this measurement.
• Uncertainty on the cross section due to insu ffi cient knowledge of the photon reconstruction ef-
ficiency is estimated by using different techniques for the photon identification as described in
Ref.[28]. An effect of 2% or less for all E
γTexplored in this measurement is observed.
• The presence of material in front of the calorimeter affects the photon conversion rate and the development of electromagnetic showers. Therefore the cross section measurement uncertainty depends on the accuracy of the detector simulation. The uncertainty associated with the imperfect knowledge of the material in front of the ECAL was estimated by comparing the measurements using MC samples simulated with the nominal ATLAS setup, and one with increased material.
The contribution of this systematic uncertainty on the cross sections was estimated to be 2% on average for all E
γTand increases to 6.5% at E
γT> 800 GeV.
• The relative systematic uncertainty on the cross section due to the uncertainty of the luminosity measurement is 1.8%. It is fully correlated among all E
Tand η bins of the differential cross sections.
The sources of systematic uncertainty are considered uncorrelated and thus the total systematic un- certainty is estimated by summing in quadrature all the contributions.
9 Theoretical predictions
The expected prompt-photon production cross section has been estimated using the JETPHOX 1.3 Monte Carlo program [12, 13], which implements a full NLO QCD calculation of both the direct and fragmen- tation contributions to the total cross section. The parton-level isolation, defined as the total E
Tfrom the partons produced with the photon inside a cone of radius ∆ R = 0.4 in η ×φ around the photon direction, is required to be smaller than 7 GeV. The fragmentation contribution in the JETPHOX calculation decreases with increasing E
γTand becomes negligible for E
γT> 500 GeV. Further details on the JETPHOX calcu- lation can be found in Ref. [30]. The calculation uses the NLO photon fragmentation function of BFG set II [31]. The CT10 [32] and MSTW2008NLO [33] PDFs for the proton are provided by the LHAPDF package [34]. The nominal renormalization (µ
R), factorization (µ
F) and fragmentation (µ
f) scales have been set to the photon transverse energy (µ
R= µ
F= µ
f= E
γT). Systematic uncertainties on the QCD cross sections are estimated in the following way:
• The scale uncertainty is evaluated by varying the three scales following the constraints:
– µ
R= µ
F= µ
f∈ [E
Tγ/2, 2E
γT];
– µ
R∈ [E
Tγ/2, 2E
Tγ], µ
F= µ
f= E
γT; – µ
F∈ [E
Tγ/2, 2E
Tγ], µ
R= µ
f= E
γT; – µ
f∈ [E
γT/2, 2E
γT], µ
R= µ
F= E
γT;
This leads to a change of the predicted cross section between 12% and 20%.
• The uncertainty on the di ff erential cross section due to insu ffi cient knowledge of the PDFs was ob- tained by repeating the JETPHOX calculation for 52 eigenvector sets of the CT10 PDF and applying a scaling factor in order to obtain the uncertainty for the 68% C.L. interval [30]. The corresponding uncertainty on the cross section increases with E
γTand varies between a few % at E
Tγ' 100 GeV and 15% at E
γT' 900 GeV.
• The e ff ect of the uncertainty on the value of the strong coupling constant, α
s, is evaluated following
the recommendation in Ref. [32]. This was done using di ff erent CT10 PDF sets with α
svalues
varied by ±0.002 around the central value, α
s= 0.118. Then, a scaling factor was applied in order
to obtain the uncertainty for the 68% C.L. interval. The average α
suncertainty on the cross section
is 4.5%, with a small dependence on E
Tγ.
In the following, the total uncertainty will include the three sources above added in quadrature, while the largest uncertainty, due to the scale variation will be shown as a separate band.
In order to perform a correct comparison with the JETPHOX calculation, the effects of hadronization, pileup and underlying events have to be understood because the isolation energy is directly sensitive to these e ff ects. The ambient-energy-density correction used for the E
isoTreconstruction reduces the effects from underlying events and pileup, but this effect may not be completely taken into account.
Using PYTHIA and HERWIG with different tunes, the combined effects from hadronization, pileup and the underlying events is estimated to be at the level of ±2%. This correction is small compared to the full uncertainty from other sources and is not included in the total theoretical uncertainty.
The measured cross sections are also compared to those from the LO parton-shower generators, PYTHIA and HERWIG. These models are described in Section 3.2. Both simulate the fragmentation com- ponents through the emission of photons in the parton shower.
10 Results
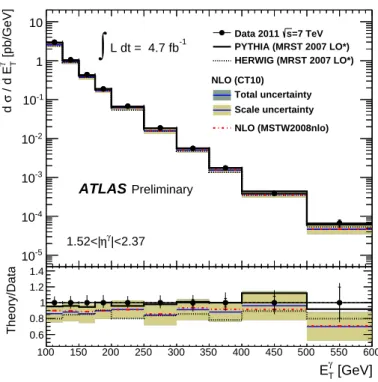
The di ff erential cross section for the production of isolated prompt photons is obtained from the number of signal events as discussed in Section 7. The measured E
γT-di ff erential cross sections together with the theoretical predictions are shown in Figs. 3 and 4 for the barrel and end-cap η
γregions, respectively.
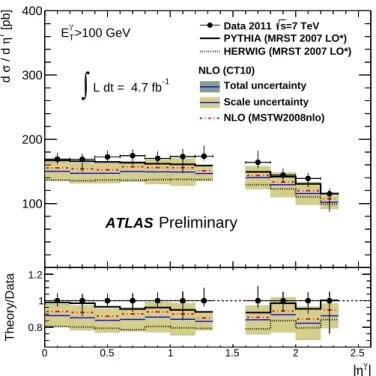
Figure 5 shows the cross section as a function of η
γfor E
Tγ> 100 GeV. This cross section is dominated by photons with E
Tγclose to the threshold cut E
γT= 100 GeV. The full error bars on the data points represent the combination of statistical and systematic uncertainties including the luminosity uncertainty (1.8%).
The inner error bars show statistical uncertainties. The shaded bands on the NLO predictions show the theoretical uncertainties as discussed in Section 9. The theoretical uncertainties due to the choice of the factorization and renormalization scales are shown as an inner band.
The NLO calculations agree with the data up to the highest E
Tγconsidered. The data are somewhat higher than the central NLO calculation for low E
Tγ, but agree within the theoretical uncertainty of the NLO calculation. This difference is also consistent throughout η
γas it is dominated by the low E
Tγrange of the measurement. The central values of the NLO calculation with the MSTW2008NLO PDF agree better with the data for the low E
γTregion and lie above the NLO calculation based on the CT10 PDF.
The predictions of the LO parton-shower MC generators, PYTHIA and HERWIG, are also shown in Figs. 3, 4 and 5. The PYTHIA model describes the data, while HERWIG indicates a lower cross section than that observed in the data. Both models describe the shape of the cross sections well.
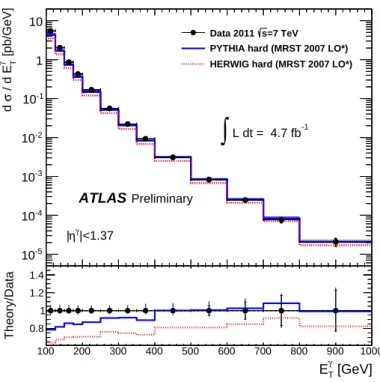
The data are also compared to MC predictions which include only direct photons from qg → qγ and q q ¯ → gγ processes calculated at LO QCD. Figure 6 shows that these MC generators predict a 20%
lower cross section at low E
γTthan when all the higher order fragmentation processes are included. This discrepancy is reduced at high E
γT, where the contribution from soft QCD becomes small. This shows that the higher order fragmentation processes are significant contributions to the shape of the predicted E
γTcross section.
The total inclusive cross section of direct photons calculated in the kinematic region E
Tγ> 100 GeV,
|η
γ| < 1.37 and E
isoT< 7 GeV is
σ(γ + X) = 234 ± 2 (stat)
+−913(syst) ± 4 (lumi) pb.
PYTHIA predicts that the cross section is 224 pb while HERWIG predicts 187 pb. The NLO calculations with the CT10 and MSTW2008NLO PDFs predict 203 ± 25 (theory) pb and 212 ± 24 (theory) pb, respec- tively, where the theory uncertainty is symmetrised and includes the scale, PDF and α
suncertainties.
The total cross section for direct photons within the kinematic range E
γT> 100 GeV, 1.52 ≤ |η
γ| <
2.37 and E
isoT< 7 GeV is
σ(γ + X) = 122 ± 2 (stat)
+−79(syst) ± 2 (lumi) pb
100 200 300 400 500 600 700 800 900 1000 10-5
10-4
10-3
10-2
10-1
1 10
100200300400500600700800900 1000
[pb/GeV]γ T / d Eσd
10-5
10-4
10-3
10-2
10-1
1 10
100200300400500600700800900 1000
[pb/GeV]γ T / d Eσd
10-5
10-4
10-3
10-2
10-1
1 10
|<1.37 ηγ
|
=7 TeV s Data 2011
PYTHIA (MRST 2007 LO*) HERWIG (MRST 2007 LO*) NLO (CT10)
Total uncertainty Scale uncertainty NLO (MSTW2008nlo)
L dt = 4.7 fb-1
∫
ATLAS
Preliminary100 200 300 400 500 600 700 800 900 1000
0.5 0.6 0.7 0.8 0.9 1 1.1 1.2 1.3 1.4
[GeV]
γ
ET
100 200 300 400 500 600 700 800 900 1000
0.6 0.8 1 1.2 1.4
Theory/Data
Figure 3: Measured (dots with error bars) and expected inclusive prompt photon cross section in the barrel η
γregion. The inner error bars on the data points show statistical uncertainties, while the full error bars show statistical and systematic uncertainties added in quadrature. The NLO theory prediction is shown as a shaded band which indicates theoretical uncertainties, while the LO parton shower MC generators are shown as lines.
which can be compared to 118 pb (PYTHIA) and 99 pb (HERWIG). The NLO calculations based on CT10 and MSTW2008NLO predict 105 ± 15 (theory) pb and 109 ± 15 (theory) pb, respectively.
11 Conclusion
A measurement of the differential cross sections for the inclusive production of isolated prompt photons in pp collisions at a center-of-mass energy of √
s = 7 TeV is presented using 4.7 fb
−1of collision data collected with the ATLAS detector at the LHC. The cross sections are presented as a function of photon transverse energy E
Tγand pseudorapidity η
γ. The E
γTkinematic range of this measurement spans from 100 GeV to 1 TeV, thus significantly extending the measured kinematic range previously published [4]
by ATLAS. The measured di ff erential cross section falls by more than five orders of magnitude in this kinematic range.
Both PYTHIA and HERWIG describe the shapes of the di ff erential cross sections. The HERWIG genera- tor predicts a smaller cross section compared to PYTHIA and the data. The MC studies presented in this paper indicate that soft QCD processes beyond the LO hard processes are needed for a good description of the data.
The data agree with the NLO predictions based on the CT10 and MSTW2008 PDF up to the highest
measured E
Tγ' 1 TeV. In this kinematic regime, the theoretical uncertainties due to the PDF of the proton
become significant. Thus the presented cross sections have the potential to provide additional constraints
on the proton PDF.
100 150 200 250 300 350 400 450 500 550 600 10-5
10-4
10-3
10-2
10-1
1 10
100150200250300350400450500550600
[pb/GeV]γ T / d Eσd
10-5
10-4
10-3
10-2
10-1
1 10
100150200250300350400450500550600
[pb/GeV]γ T / d Eσd
10-5
10-4
10-3
10-2
10-1
1 10
|<2.37 ηγ
1.52<|
=7 TeV s Data 2011
PYTHIA (MRST 2007 LO*) HERWIG (MRST 2007 LO*) NLO (CT10)
Total uncertainty Scale uncertainty NLO (MSTW2008nlo)
L dt = 4.7 fb-1
∫
ATLAS
Preliminary100 150 200 250 300 350 400 450 500 550 600
0.5 0.6 0.7 0.8 0.9 1 1.1 1.2 1.3 1.4
[GeV]
γ
ET
100 150 200 250 300 350 400 450 500 550 600 0.6
0.8 1 1.2 1.4
Theory/Data
Figure 4: Measured (dots with error bars) and expected inclusive prompt photon cross section in the
end-cap η
γregion. The inner error bars on the data points show statistical uncertainties, while the full
error bars show statistical and systematic uncertainties added in quadrature. The NLO theory prediction
is shown as a shaded band which indicates theoretical uncertainties, while the LO parton shower MC
generators are shown as lines.
0 0.5 1 1.5 2 2.5 50
100 150 200 250 300 350 400
0 0.5 1 1.5 2 2.5
[pb]γ η / d σd
100 200 300 400
0 0.5 1 1.5 2 2.5
[pb]γ η / d σd
100 200 300 400
>100 GeV
γ
ET Data 2011 PYTHIA (MRST 2007 LO*)s=7 TeV HERWIG (MRST 2007 LO*) NLO (CT10)
Total uncertainty Scale uncertainty NLO (MSTW2008nlo) L dt = 4.7 fb-1
∫
ATLAS Preliminary
0 0.5 1 1.5 2 2.5
0.7 0.8 0.9 1 1.1 1.2
γ| η
|
0 0.5 1 1.5 2 2.5
0.8 1 1.2
Theory/Data
Figure 5: Measured and expected inclusive prompt photon cross section as a function of |η
γ|, for photons
with transverse energies above 100 GeV excluding 1.37 < |η
γ| < 1.52. The data points show full error
bars which contain statistical, systematic, and luminosity uncertainties added in quadrature. The NLO
theory prediction is shown as a shaded band which indicates theoretical uncertainties, while the LO
parton shower MC generators are shown as lines.
100 200 300 400 500 600 700 800 900 1000 10-5
10-4
10-3
10-2
10-1
1 10
100200300400500600700800900 1000
[pb/GeV]γ T / d Eσd
10-5
10-4
10-3
10-2
10-1
1 10
100200300400500600700800900 1000
[pb/GeV]γ T / d Eσd
10-5
10-4
10-3
10-2
10-1
1 10
|<1.37 ηγ
|
=7 TeV s Data 2011
PYTHIA hard (MRST 2007 LO*) HERWIG hard (MRST 2007 LO*)
L dt = 4.7 fb-1
∫
ATLAS
Preliminary100 200 300 400 500 600 700 800 900 1000
0.7 0.8 0.9 1 1.1 1.2 1.3 1.4
[GeV]
γ
ET
100 200 300 400 500 600 700 800 900 1000
0.8 1 1.2 1.4
Theory/Data