ATLAS-CONF-2020-017 09June2020
ATLAS CONF Note
ATLAS-CONF-2020-017
2nd June 2020
Measurement of the dijet momentum balance in Pb+Pb and p p collisions at √
sNN = 5.02 TeV with the ATLAS detector
The ATLAS Collaboration
This note presents measurements of the dijet momentum balance of anti-kt R=0.4 jets at center-of-mass energy√
sNN= 5.02 TeV in Pb+Pb andppcollisions by the ATLAS experiment.
The measurement was performed using 1.72 nb−1 of Pb+Pb data and 260 pb−1 ofppdata collected in 2018 and 2017 respectively. This note presents distributions of the unfolded
1 Npair
dNpair
dxJ , where xJ is the ratio of the transverse momentum (pT) of the subleading jet to the leading jet, as a function of thepT of the leading jet and of collision centrality. In pp collisions thexJdistributions reach a maximum atxJ≈1 and decrease approximately linearly with decreasingxJ. In central Pb+Pb collisions for leading jets with 158< pT < 200 GeV, the xJ distributions are approximately constant forxJ > 0.5. Even at the highest leading jet pT measured, 398 < pT < 562 GeV, significant modification from the shape in pp collisions is observed. These measurements are compared with previous measurements at
√sNN= 2.76 TeV and are found to agree within the systematic uncertainties. These results will help in understanding the strength and mechanism for jet modifications in the quark-gluon plasma.
© 2020 CERN for the benefit of the ATLAS Collaboration.
Reproduction of this article or parts of it is allowed as specified in the CC-BY-4.0 license.
1 Introduction
The primary physics aim of the heavy-ion program at the Large Hadron Collider (LHC) is to produce and study the quark-gluon plasma (QGP), the high-temperature state of quantum-chromodynamics (QCD) matter in which quarks and gluons are no longer confined within protons and neutrons (for a recent review see Ref. [1]). Measurements of jets in heavy-ion collisions provide information about the short distance scale interactions of high energy partons with the QGP. The overall rate of jets at a given transverse momentum,pT, in Pb+Pb collisions is found to be reduced by approximately a factor of two compared to expectations based onppcollisions scaled by the increased partonic luminosity in Pb+Pb collisions, as demonstrated in the measurement of the nuclear modification factor in Ref. [2]. This suppression is observed to persist to the highest transverse momenta measured in Ref. [2], approximately 1 TeV. The mechanism for the observed suppression is thought to be the loss of energy outside the jet cone via interactions of the jet constituents with the QGP [1,3].
Pairs of jets have been found to have an enhanced probability to being momentum-imbalanced in Pb+Pb collisions compared toppcollisions [4–6]. The interpretation of these results is that the lower momentum, sub-leading, jet loses more energy than the higher momentum, leading, jet. The unequal energy loss of the jets in a dijet pair is thought to arise from unequal path lengths through the QGP depending on the geometry of the collision and the orientation of the jet trajectories [7]. Because this observable has two jets, which are both expected to lose some amount of energy, it can provide different sensitivity to the path length dependence of energy loss than single jet suppression and photon-jet balance. It is therefore of interest to have measurements of the dijet momentum balance covering as much of the kinematic range of the single jet measurements as possible.
First measurements of the dijet momentum imbalance were not unfolded for detector resolution [4,5]. A later measurement from ATLAS at√
sNN =2.76 TeV included a two-dimensional Bayesian unfolding to correct for detector resolution [6]. The momentum balance distributions in Pb+Pb collisions are observed to become more similar to those in ppcollisions with increasing leading-jet pT. However, due to the limited luminosity (0.14 nb−1) the highest leading-jetpTselection available in Ref. [6] includes all jets withpT >200 GeV hence the detailed high-pTbehavior of this observable is currently unknown.
This measurement extends the measurement of the dijet momentum balance to√
sNN = 5.02 TeV and uses 1.72 nb−1of Pb+Pb data collected in 2018 to extend the reach of this measurement to leading jets with 398< pT < 562 GeV. For comparison, 260 pb−1ofppdata at the same collision energy is used. Jets are reconstructed using the anti-kt[8] algorithm with a radius parameter ofR=0.4. As in Ref. [6], the variable of interest is the transverse momentum balance of back-to-back in azimuth1jets with|∆φ| ≡ |φ1−φ2| > 7π
8. The subscripts 1 and 2 refer to the leading and sub-leading jet, respectively. The momentum balance is defined in Equation1:
xJ= pT,2
pT,1 (1)
With the direct observable in this measurement being the dijet yield normalized by the number of jet pairs in a givenpT,1region,N1
pair dNpair
dxJ . This measurement is quoted forpT,1between 158 and 562 GeV for jets with|η| <2.1.
1ATLAS uses a right-handed coordinate system with its origin at the nominal interaction point (IP) in the center of the detector and thez-axis along the beam pipe. Thex-axis points from the IP to the center of the LHC ring, and they-axis points upwards.
Cylindrical coordinates(r, φ)are used in the transverse plane,φbeing the azimuthal angle around thez-axis. The pseudorapidity is defined in terms of the polar angleθasη=−ln tan(θ/2). Angular distance is measured in units of∆R≡p
(∆η)2+(∆φ)2.
2 ATLAS detector
The ATLAS detector [9] at the LHC covers nearly the entire solid angle around the collision point. It consists of an inner tracking detector surrounded by a thin superconducting solenoid, electromagnetic and hadronic calorimeters, a zero-degree calorimeter, and a muon spectrometer incorporating three large superconducting toroidal magnets. The inner-detector system is immersed in a 2 T axial magnetic field and provides charged particle tracking in the range|η| <2.5.
The high-granularity silicon pixel detector covers the vertex region and typically provides four measurements per track, the first hit being normally in the innermost layer. It is followed by the silicon microstrip tracker which usually provides four two-dimensional measurement points per track. These silicon detectors are complemented by the transition radiation tracker, which enables radially extended track reconstruction up to|η| =2.0.
The calorimeter system covers the pseudorapidity range|η| <4.9. Within the region|η| <3.2, electromag- netic calorimetry is provided by barrel and endcap high-granularity lead/liquid-argon (LAr) electromagnetic calorimeters, with an additional thin LAr presampler covering |η| < 1.8, to correct for energy loss in material upstream of the calorimeters. Hadronic calorimetry is provided by the steel/scintillating-tile calorimeter, segmented into three barrel structures within|η|< 1.7, and two copper/LAr hadronic endcap calorimeters. The solid angle coverage is completed with forward copper/LAr and tungsten/LAr calorimeter modules optimized for electromagnetic and hadronic measurements respectively.
The zero-degree calorimeters (ZDCs) are located symmetrically at z =±140 m and cover|η| >8.3. They are constructed from tungsten absorber plates, while Čerenkov light is transmitted via quartz fibers. In Pb+Pb collisions the ZDCs primarily measure “spectator” neutrons, which are neutrons that do not interact hadronically when the incident nuclei collide. A ZDC coincidence trigger is implemented by requiring the pulse height from each ZDC to be above a threshold set to accept the single-neutron peak.
A two-level trigger system is used to select interesting events [10]. The Level-1 trigger is implemented in hardware and uses a subset of detector information, including ZDC coincidence, to reduce the event rate to a design value of at most 100 kHz. This is followed by a software-based trigger level which reduces the event rate to several kHz.
3 Event and data selection
All events included in this analysis are required to contain at least one reconstructed vertex as well as to satisfy detector and data-quality requirements. These events are additionally required to have been selected by a jet trigger and have the leading jet in a region where the trigger is fully efficient. Although only a small fraction of Pb+Pb events (< 0.5%) contain multiple collisions, the anti-correlation between the total transverse energy deposited in the forward calorimeter,ΣEFCal
T , and the number of neutrons measured in the ZDC is used to suppress these events.
The overlap area of two colliding nuclei in Pb+Pb collisions is characterized by the total transverse energy deposited in the FCal [11]. This analysis uses five centrality intervals which are defined according to successive percentiles of theΣEFCal
T distribution obtained in Minimum Bias collisions. The centrality regions used in this analysis, starting at the most central (largestΣEFCal
T ) to peripheral (lowestΣEFCal
T )
collisions are: 0-10%, 10-20%, 20-40%, 40-60%, and 60-80%.
This analysis uses two Monte Carlo (MC) samples to evaluate the performance of the detector and analysis procedure, and to correct the measured distributions for detector effects. TheppMC used in this analysis includes 32×106Pythia8 [12]ppjet events at
√s=5.02 TeV with the A14 ATLAS tune [13] and the NNPDF23LO parton distribution functions (PDFs) [14]. Pileup from additionalppcollisions is generated by Pythia8, with parameter values set to the A3 tune [15] and using NNPDF23LO, with a distribution of the number of extra collisions matching that of data. The Pb+Pb MC sample uses 32×106ppPythia8 events with the same tune and PDFs as inppMC samples that are overlayed on top of events from a dedicated sample of Pb+Pb data events. This sample was recorded with a combination of minimum bias trigger and total energy triggers to enhance the statistics in central collisions. This “MC overlay”
sample was reweighted on an event-by-event basis such that it has the same centrality distribution as the jet-triggered data sample. The detector response in all MC samples was simulated using Geant4 [16, 17].
4 Jet Reconstruction and Analysis
Similar to previous ATLAS jet measurements [2] in Pb+Pb collisions, the jets were reconstructed using the anti-ktalgorithm [8] as implemented in the FastJet software package [18]. The jets were reconstructed with radius parameterR=0.4 by clustering calorimetric “towers” of spatial size∆η×∆φ=0.1× π
32. A background subtraction procedure was applied which uses the underlying event (UE) average transverse energy density,ρ(η, φ), where theφdependence accounts for azimuthal anisotropy due to correlations in particle production caused by flow [19]. The UE estimation is additionally corrected forηandφdependent non-uniformities of the detector. The jet reconstruction inppcollisions follows the same procedure as in heavy-ion collisions but without UE corrections for theηandφvariations in the detector response, as well as without azimuthal modulation of the UE.
The performance of the reconstruction of jets is characterized by evaluating the jet energy scale (JES) and jet energy resolution (JER), which corresponds to the mean and variance of thepreco
T /ptruth
T distribution where preco
T is the reconstructed jetpT andptruth
T is the pTof the matched generator-level jet, within∆R < 0.3.
Generator-level jets are built from particle four-vectors obtained from the MC generator and are defined by applying the anti-kt algorithm with radius parameterR=0.4 to stable particles with a proper lifetime greater than 30 ps, but excluding muons and neutrinos. Figure1shows the JES and the JER as a function ofptruth
T for Pb+Pb andppcollisions. The JES deviates from unity by up to 1.5% for 0-10% central Pb+Pb and up to 0.5% inppcollisions. The deviation from unity in the JES for ppcollisions arises from the application of a strong isolation cut in the calibration procedure which cannot be applied as part of this analysis. Due to the underlying event fluctuations in Pb+Pb collisions the JER degrades in central Pb+Pb collisions. The jet reconstruction efficiency is evaluated as the probability of a jet to be reconstructed with apTlarger than 44 GeV. Figure2shows that the jet reconstruction efficiency is greater than 90% (70%) in pp(central Pb+Pb) collisions forptruth
T >50 GeV.
This analysis considers the measured leading dijet pair constructed from the two highestpTjets in the event with reconstructedpT,1> 79 GeV,pT,2> 44 GeV and|η| <2.1. The dijets are required to be back to back in azimuth through requiring|∆φ| >7π/8. For these dijet pairs the symmetrized two-dimensional (pT,1,pT,2) distributions are measured. These distributions contain both the dijet signal as well as combinatoric contributions from uncorrelated jets. The contribution from combinatoric jets is estimated and subtracted by measuring the symmetrized two-dimensional (pT,1,pT,2) distribution of dijets within 1< |∆φ| <1.4 and
50 60 70 102 2×10² 3×10²
[GeV]
truth
pT
0.9 0.92 0.94 0.96 0.98 1 1.02 1.04 1.06 1.08 1.1
JES
0 - 10%
10 - 20%
20 - 40%
40 - 60%
60 - 80%
pp
ATLAS Simulation Preliminary
| < 2.1 η
| = 5.02 TeV
sNN
R = 0.4 kt
anti-
50 60 70 102 2×10² 3×10²
[GeV]
truth
pT
0 0.05 0.1 0.15 0.2 0.25 0.3 0.35 0.4 0.45 0.5
JER
0 - 10%
10 - 20%
20 - 40%
40 - 60%
60 - 80%
pp
ATLAS Simulation Preliminary
| < 2.1 η
| = 5.02 TeV
sNN
R = 0.4 kt
anti-
Figure 1: The JES (left) and JER (right) as a function ofptruth
T in Pb+Pb and inppcollisions.
20 30 40 50 102 2×10²
[GeV]
Truth
pT
0 0.2 0.4 0.6 0.8 1 1.2
Efficiency
ATLAS Simulation Preliminary
> 44 GeV
reco
pT
| < 2.8 η
| Pythia 8
Pb+Pb data overlay = 5.02 TeV
sNN
R = 0.4 kt
anti-
0 - 10%
10 - 20%
20 - 40%
40 - 60%
60 - 80%
pp
Figure 2: The efficiency for reconstructing jets as a function ofptruth
T for jets reconstructed withpreco
T >44 GeV for Pb+Pb collisions with the centrality selections: 0–10%, 10–20%, 20–40%, 40–60%, 60–80%.
normalizing to the∆φwindow of the measurement region, assuming a flat∆φdistribution of uncorrelated jets. In the kinematic range of this measurement the combinatoric background contribution is small.
The measured (pT,1,pT,2) distributions are unfolded for detector effects using the iterative Bayesian unfolding [20] procedure implemented in the RooUnfold [21] software package. The unfolding in this measurement is done on the two-dimensional (pT,1,pT,2) distribution, correcting for bin migration on both the leading and subleading jets. A separate response matrix is generated for each centrality selection in Pb+Pb collisions as well as pp collisions in order to properly model the centrality dependence in the response. The response matrix contains the relationship between truth (pT,1,pT,2) and reconstructed (pT,1,pT,2). It is populated with the leading and subleading truth jets in an event, matched to their corresponding reconstructed jets within a∆R < 0.3, the reconstructed jets are not required to have the highest reconstructedpT in the event. The response matrix is populated symmetrically in bothpT,1and pT,2, using a weighting function so that the prior better represents the measured data. The number of iterations in the unfolding was chosen to have a stable result with respect to the number of iterations while minimizing the amplification of statistical uncertainties. Five iterations are used in the 0–10% central collisions, and four iterations are used in all other cases. The unfolded (pT,1,pT,2) distributions are projected to 1-dimensional xJdistributions in bins ofpT,1. In order to populate the xJdistribution down to 0.32 without introducing a large efficiency correction, the projection toxJis done in bins ofpT,1>158 GeV.
5 Systematic Uncertainties
This analysis considers two main categories of systematic uncertainties: the uncertainties associated with the jet measurement and those associated with the unfolding. The contribution to the systematic uncertainties from the combinatoric background subtraction is negligible and therefore not included.
The uncertainties are applied to the jet response and propagated through the unfolding to the final xJ distributions.
The systematic uncertainty on the JES has four parts. First, there is a centrality-independent baseline component that is determined fromin situ studies of the calorimeter response for jets reconstructed following the procedure used in 13 TeVppcollisions [22,23]. The second, is a centrality-independent component accounting for the relative energy scale difference between the jet reconstruction procedures used in this note at 5 TeV and that used for 13 TeVppcollisions [24]. Potential inaccuracies in the MC sample in the description of the relative abundances of jets initiated by quarks and gluons and of the calorimetric response to quark and gluon jets are accounted for by the third component. The magnitude of this component was determined by comparing two generators, Pythia8 and Herwig7. The fourth, centrality-dependent, component accounts for a different structure and possibly a different detector response of jets in Pb+Pb collisions that is not modeled by the MC. The extent of this uncertainty is determined by the method used for 2015 and 2011 data [24] that compares calorimeterpT and the sum of the transverse momentum of charged particles within the jet in data and MC samples. To account for the uncertainty on the JES in the dijet measurement, each component is varied separately by±1 standard deviation in MC samples, applied as a function ofpT andη, and the response matrix is recomputed. The data are then unfolded with the modified matrices.
The uncertainty due to the JER is evaluated by repeating the unfolding procedure with modified response matrices, where an additional contribution is added to the resolution of the reconstructed pT using a Gaussian smearing procedure. The smearing factor is evaluated using anin situtechnique in 13 TeVpp data that involves studies of dijet energy balance [25,26] with additional contributions accounting for differences in calibration procedures for jet used in this analysis and those from 13 TeVppdata. Further, uncertainty is included to account for differences between the reconstruction used in this measurement and the jet reconstruction used in analyses of 13 TeVppdata. The resulting uncertainty from the JER is symmetrized.
The uncertainty on the unfolding procedure has three sources. The first source is the sensitivity to the prior. This was evaluated by modifying the weighting function used to set the prior in the response matrix, following the variations applied in Ref. [6]. This resulted in the modification of the prior with respect to unweighted MC being reduced (increased) for central (mid-central) collisions. The alternate prior in the most peripheral collisions is based on the unweighted MC. The second source is the sensitivity in the unfolding result to the minimum reconstructed jetpTused in the analysis. The nominal value is 44 GeV. This minimum jet reconstruction threshold was increased to 50 GeV and the analysis procedure was repeated, with the difference from the nominal result taken as the systematic uncertainty contribution.
Finally, the non-closure of the analysis in MC taken as a systematic uncertainty. These three components are first symmetrized and then combined together in quadrature to determine the total unfolding systematic uncertainty contribution.
Examples of the systematic uncertainties are shown for 0–10% and 60–80% central Pb+Pb collisions and inppcollisions in Figure3. The total uncertainties on thexJdistributions in central and mid-central events are driven approximately equally by the sensitivity to the unfolding as well as the JES- and JER-related
uncertainties. In peripheral Pb+Pb collisions andppcollisions the systematic uncertainties are driven by the jet-related uncertainties.
0.3 0.4 0.5 0.6 0.7 0.8 0.9 1
xJ
0.2 0.4 0.6 0.8 1 1.2 1.4 1.6 1.8 2
Fractional Uncertainty
Total Unfolding
JES and JER
Total Unfolding
JES and JER
< 178 GeV 158 < pT,1
0 - 10%
ATLAS Preliminary = 5.02 TeV
sNN Pb+Pb 1.72 nb-1
R = 0.4 kt
anti-
0.3 0.4 0.5 0.6 0.7 0.8 0.9 1
xJ
0.2 0.4 0.6 0.8 1 1.2 1.4 1.6 1.8 2
Fractional Uncertainty
Total Unfolding
JES and JER
Total Unfolding
JES and JER
< 178 GeV 158 < pT,1
60 - 80%
ATLAS Preliminary = 5.02 TeV
sNN Pb+Pb 1.72 nb-1
R = 0.4 kt
anti-
0.3 0.4 0.5 0.6 0.7 0.8 0.9 1
xJ
0.7 0.8 0.9 1 1.1 1.2 1.3
Fractional Uncertainty
Total Unfolding
JES and JER
Total Unfolding
JES and JER
< 178 GeV 158 < pT,1
ATLAS Preliminary = 5.02 TeV
sNN pp 260 pb-1
R = 0.4 kt
anti-
0.3 0.4 0.5 0.6 0.7 0.8 0.9 1
xJ
0.2 0.4 0.6 0.8 1 1.2 1.4 1.6 1.8 2
Fractional Uncertainty
Total Unfolding
JES and JER
Total Unfolding
JES and JER
< 282 GeV 251 < pT,1
0 - 10%
ATLAS Preliminary = 5.02 TeV
sNN Pb+Pb 1.72 nb-1
R = 0.4 kt
anti-
0.3 0.4 0.5 0.6 0.7 0.8 0.9 1
xJ
0.2 0.4 0.6 0.8 1 1.2 1.4 1.6 1.8 2
Fractional Uncertainty
Total Unfolding
JES and JER
Total Unfolding
JES and JER
< 282 GeV 251 < pT,1
60 - 80%
ATLAS Preliminary = 5.02 TeV
sNN Pb+Pb 1.72 nb-1
R = 0.4 kt
anti-
0.3 0.4 0.5 0.6 0.7 0.8 0.9 1
xJ
0.7 0.8 0.9 1 1.1 1.2 1.3
Fractional Uncertainty
Total Unfolding
JES and JER
Total Unfolding
JES and JER
< 282 GeV 251 < pT,1
ATLAS Preliminary = 5.02 TeV
sNN pp 260 pb-1
R = 0.4 kt
anti-
Figure 3: The systematic uncertainty contributions to theN1
pair dNpair
dxJ distributions for 158<pT,1 <178 GeV (top) and 251<pT,1<282 GeV (bottom) in 0–10% central Pb+Pb collisions (left), 60–80% central Pb+Pb collisions (middle), andppcollisions (right).
6 Results
The unfoldedxJdistributions are presented over a rapidity interval of|η| <2.1 and for leading jets inpT,1 intervals between 158 GeV and 562 GeV. Figure4shows thexJdistributions for 158< pT,1 <562 GeV in ppcollisions. At lowpT,1values, thexJdistributions increase approximately linearly with increasingxJ, and forpT,1 >250 GeV the distributions become steeper forxJ>0.7. The measurements are compared with the same distributions from Pythia8 and good agreement between the MC and the data is observed over the entirepT,1range of this measurement.
0.3 0.4 0.5 0.6 0.7 0.8 0.9 1
xJ
0 0.5 1 1.5 2 2.5 3 3.5 4 dxJ4.5
pair
dN
pairN1
< 178 GeV 158 < pT,1
260 pb-1
pp
R = 0.4 kt
anti- = 5.02 TeV
sNN
ATLAS Preliminary
pp PYTHIA8
0.3 0.4 0.5 0.6 0.7 0.8 0.9 1
xJ
0 0.5 1 1.5 2 2.5 3 3.5 4 dxJ4.5
pair
dN
pairN1
< 200 GeV 178 < pT,1
260 pb-1
pp
R = 0.4 kt
anti- = 5.02 TeV
sNN
ATLAS Preliminary
pp PYTHIA8
0.3 0.4 0.5 0.6 0.7 0.8 0.9 1
xJ
0 0.5 1 1.5 2 2.5 3 3.5 4 dxJ4.5
pair
dN
pairN1
< 224 GeV 200 < pT,1
260 pb-1
pp
R = 0.4 kt
anti- = 5.02 TeV
sNN
ATLAS Preliminary
pp PYTHIA8
0.3 0.4 0.5 0.6 0.7 0.8 0.9 1
xJ
0 0.5 1 1.5 2 2.5 3 3.5 4 dxJ4.5
pair
dN
pairN1
< 251 GeV 224 < pT,1
260 pb-1
pp
R = 0.4 kt
anti- = 5.02 TeV
sNN
ATLAS Preliminary
pp PYTHIA8
0.3 0.4 0.5 0.6 0.7 0.8 0.9 1
xJ
0 0.5 1 1.5 2 2.5 3 3.5 4 dxJ4.5
pair
dN
pairN1
< 282 GeV 251 < pT,1
260 pb-1
pp
R = 0.4 kt
anti- = 5.02 TeV
sNN
ATLAS Preliminary
pp PYTHIA8
0.3 0.4 0.5 0.6 0.7 0.8 0.9 1
xJ
0 0.5 1 1.5 2 2.5 3 3.5 4 dxJ4.5
pair
dN
pairN1
< 316 GeV 282 < pT,1
260 pb-1
pp
R = 0.4 kt
anti- = 5.02 TeV
sNN
ATLAS Preliminary
pp PYTHIA8
0.3 0.4 0.5 0.6 0.7 0.8 0.9 1
xJ
0 0.5 1 1.5 2 2.5 3 3.5 4 dxJ4.5
pair
dN
pairN1
< 398 GeV 316 < pT,1
260 pb-1
pp
R = 0.4 kt
anti- = 5.02 TeV
sNN
ATLAS Preliminary
pp PYTHIA8
0.3 0.4 0.5 0.6 0.7 0.8 0.9 1
xJ
0 0.5 1 1.5 2 2.5 3 3.5 4 dxJ4.5
pair
dN
pairN1
< 562 GeV 398 < pT,1
260 pb-1
pp
R = 0.4 kt
anti- = 5.02 TeV
sNN
ATLAS Preliminary
pp PYTHIA8
Figure 4: ThexJdistributions inppcollisions (full markers) for thepT,1selections measured here. The error bars indicate the statistical uncertainties and are sometimes smaller than the points. The boxes show the systematic uncertainties. Values from Pythia8 are also shown (open diamond markers).
The unfoldedxJdistributions forR=0.4 jets for all Pb+Pb centrality selections andppcollisions are shown in Figure5for the samepT,1selections as in the previous figure. For allpT,1selections the modification of thexJdistributions in Pb+Pb collisions compared toppcollisions increases for more central collisions.
For 158< pT,1 <178 GeV thexJdistributions in the most central Pb+Pb collisions are consistent with a constant as a function of xJfor xJ > 0.5. For less central collisions and higherpT,1selections the xJ
distributions increase with increasing xJ. For pT,1 < 224 GeV, the xJdistributions in 60–80% Pb+Pb collisions are significantly different than those inppcollisions; however, for 224< pT,1<282 GeV thexJ distributions in peripheral Pb+Pb collisions are very similar to those inppcollisions (forpT,1>282 GeV there are not enough jets in the 60–80% centrality selection to perform the measurement).
0.3 0.4 0.5 0.6 0.7 0.8 0.9 1
xJ
0 0.5 1 1.5 2 2.5 3 3.5 4 dxJ4.5
pair
dN
pairN1
pp 0 - 10% 10 - 20%
20 - 40% 40 - 60% 60 - 80%
ATLAS Preliminary
= 5.02 TeV sNN
Pb+Pb 1.72 nb-1
260 pb-1
pp
R = 0.4 kt
anti-
< 178 GeV pT,1
158 <
0.3 0.4 0.5 0.6 0.7 0.8 0.9 1
xJ
0 0.5 1 1.5 2 2.5 3 3.5 4 dxJ4.5
pair
dN
pairN1
pp 0 - 10% 10 - 20%
20 - 40% 40 - 60% 60 - 80%
ATLAS Preliminary
= 5.02 TeV sNN
Pb+Pb 1.72 nb-1
260 pb-1
pp
R = 0.4 kt
anti-
< 200 GeV pT,1
178 <
0.3 0.4 0.5 0.6 0.7 0.8 0.9 1
xJ
0 0.5 1 1.5 2 2.5 3 3.5 4 dxJ4.5
pair
dN
pairN1
pp 0 - 10% 10 - 20%
20 - 40% 40 - 60% 60 - 80%
ATLAS Preliminary
= 5.02 TeV sNN
Pb+Pb 1.72 nb-1
260 pb-1
pp
R = 0.4 kt
anti-
< 224 GeV pT,1
200 <
0.3 0.4 0.5 0.6 0.7 0.8 0.9 1
xJ
0 0.5 1 1.5 2 2.5 3 3.5 4 dxJ4.5
pair
dN
pairN1
pp 0 - 10% 10 - 20%
20 - 40% 40 - 60% 60 - 80%
ATLAS Preliminary
= 5.02 TeV sNN
Pb+Pb 1.72 nb-1
260 pb-1
pp
R = 0.4 kt
anti-
< 251 GeV pT,1
224 <
0.3 0.4 0.5 0.6 0.7 0.8 0.9 1
xJ
0 0.5 1 1.5 2 2.5 3 3.5 4 dxJ4.5
pair
dN
pairN1
pp 0 - 10% 10 - 20%
20 - 40% 40 - 60% 60 - 80%
ATLAS Preliminary
= 5.02 TeV sNN
Pb+Pb 1.72 nb-1
260 pb-1
pp
R = 0.4 kt
anti-
< 282 GeV pT,1
251 <
0.3 0.4 0.5 0.6 0.7 0.8 0.9 1
xJ
0 0.5 1 1.5 2 2.5 3 3.5 4 dxJ4.5
pair
dN
pairN1
pp 0 - 10% 10 - 20%
20 - 40% 40 - 60%
ATLAS Preliminary
= 5.02 TeV sNN
Pb+Pb 1.72 nb-1
260 pb-1
pp
R = 0.4 kt
anti-
< 316 GeV pT,1
282 <
0.3 0.4 0.5 0.6 0.7 0.8 0.9 1
xJ
0 0.5 1 1.5 2 2.5 3 3.5 4 dxJ4.5
pair
dN
pairN1
pp 0 - 10% 10 - 20%
20 - 40% 40 - 60%
ATLAS Preliminary
= 5.02 TeV sNN
Pb+Pb 1.72 nb-1
260 pb-1
pp
R = 0.4 kt
anti-
< 398 GeV pT,1
316 <
0.3 0.4 0.5 0.6 0.7 0.8 0.9 1
xJ
0 0.5 1 1.5 2 2.5 3 3.5 4 dxJ4.5
pair
dN
pairN1
pp 0 - 10% 10 - 20%
20 - 40%
ATLAS Preliminary
= 5.02 TeV sNN
Pb+Pb 1.72 nb-1
260 pb-1
pp
R = 0.4 kt
anti-
< 562 GeV pT,1
398 <
Figure 5: ThexJdistributions for 0–10%, 10–20%, 20–40%, 40–60% and 60–80% centrality selections in Pb+Pb collisions compared to those inppcollisions. Each panel presents a differentpT,1selection. The error bars, which are sometimes smaller than the points, show the statistical uncertainties and the boxes show the systematic uncertainties.
At the higher values of pT,1 some centrality classes are omitted from the plots because there are an insufficient number jets to perform the analysis.
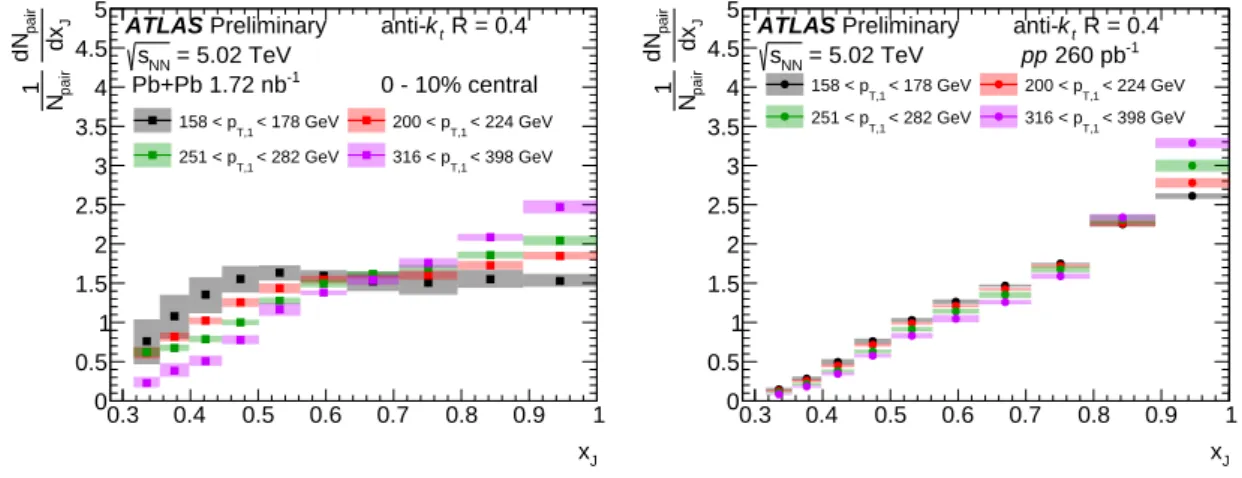
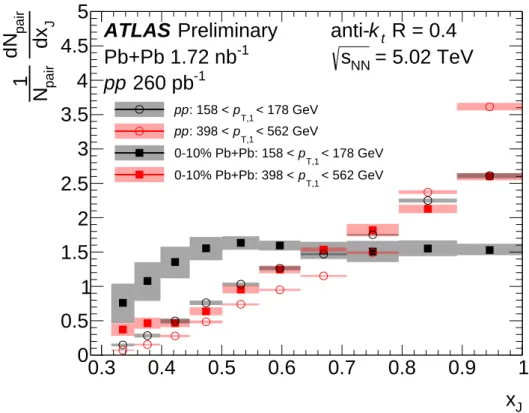
In order to investigate thepT,1dependence of thexJdistributions, Figures6and7shows these distributions in 0–10% and 60–80% central Pb+Pb andppcollisions with the differentpT,1selections overlaid. Qualitatively, both in Pb+Pb collisions and inppcollisions, thexJdistributions become steeper with increasingpT,1. To more clearly see thepT,1dependence of thexJdistributions, Figure8shows thexJdistributions for the lowest and highestpT,1selections in both 0–10% central Pb+Pb collisions andppcollisions. The shape of thexJdistribution for 158< pT,1<178 GeV in the most central Pb+Pb collisions are qualitatively different from bothppcollisions and the higherpT,1selection in the same centrality of Pb+Pb collisions. For the
higherpT,1selection, the distribution inppcollisions has approximately a 40% higher probability to have pairs withxJbetween 0.9 and 1.0 than at the lower pT,1selection.
0.3 0.4 0.5 0.6 0.7 0.8 0.9 1
xJ
0 0.5 1 1.5
2 2.5 3 3.5 4 4.5 dxJ 5
pair
dN
pairN1
< 178 GeV
158 < pT,1 200 < pT,1 < 224 GeV < 282 GeV
251 < pT,1 < 398 GeV
316 < pT,1
ATLAS Preliminary = 5.02 TeV sNN
Pb+Pb 1.72 nb-1
R = 0.4 kt
anti-
0 - 10% central
0.3 0.4 0.5 0.6 0.7 0.8 0.9 1
xJ
0 0.5 1 1.5
2 2.5 3 3.5 4 4.5 dxJ 5
pair
dN
pairN1 < 178 GeV
158 < pT,1 < 224 GeV
200 < pT,1
< 282 GeV
251 < pT,1 316 < pT,1 < 398 GeV
ATLAS Preliminary = 5.02 TeV
sNN pp 260 pb-1
R = 0.4 kt
anti-
Figure 6: ThexJdistributions in 0–10% central Pb+Pb collisions (left) andppcollisions (right) for differentpT,1 selections. The error bars, which are sometimes smaller than the points, show the statistical uncertainties and the boxes show the systematic uncertainties.
0.3 0.4 0.5 0.6 0.7 0.8 0.9 1
xJ 0
1 2 3 4 5 dxJ 6 pairdN pairN1
ATLAS Preliminary
= 5.02 TeV sNN 1.80 pb-1
pp
R = 0.4 kt anti-
< 178 GeV 158 < pT,1
< 282 GeV 251 < pT,1
< 562 GeV 398 < pT,1
0.3 0.4 0.5 0.6 0.7 0.8 0.9 1
xJ 0
1 2 3 4 5 dxJ 6 pairdN pairN1
ATLAS Preliminary
= 5.02 TeV sNN Pb+Pb 1.72 nb-1
0-10% Central
R = 0.4 kt anti-
< 178 GeV 158 < pT,1
< 562 GeV 398 < pT,1
0.3 0.4 0.5 0.6 0.7 0.8 0.9 1
xJ 0
1 2 3 4 5 dxJ 6 pairdN pairN1
ATLAS Preliminary
= 5.02 TeV sNN Pb+Pb 1.72 nb-1
60-80% Central
R = 0.4 kt anti-
< 178 GeV 158 < pT,1
< 282 GeV 251 < pT,1
Figure 7: The left panel shows a comparison of thexJdistributions across threepT,1bins inppcollisions. The center (right) panel shows the comparison across twopT,1bins in 0−10% (60−80%) Pb+Pb collisions. Note that the higherpT,1range shown for the 60–80% central collisions is lower than what is shown for 0–10% central collisions.
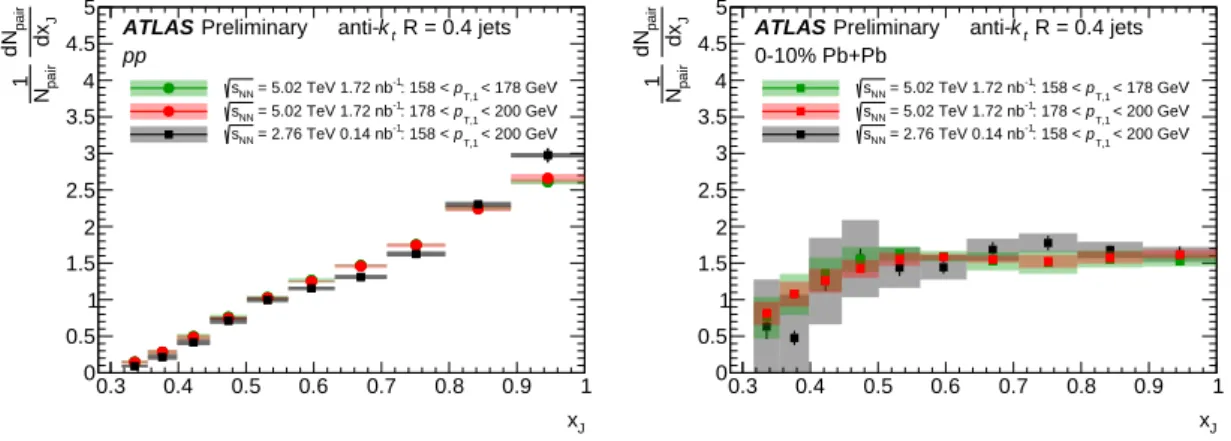
The collision energy dependence of thexJdistributions is interesting for a number of reasons. First, the momentum fractions of the incoming nucleons carried by the quarks and gluons which undergo the hard scattering should be different at the two collision energies with more gluon jets at the higher collision energy. Second, the initial (prior to quenching)xJdistributions are different at the two collision energies due to differences in the jet momentum spectra and the larger expected contribution to multi-jet events at the higher collision energy. Finally, the QGP in Pb+Pb collisions at 5.02 TeV is expected to have a higher temperature than at 2.76 TeV. The first and second reasons for differences would be present in bothppand Pb+Pb collisions, while the third is related only to Pb+Pb collisions. Figure9shows the comparison of thexJdistributions in this measurement at√
sNN = 5.02 TeV to the same measurement at
√sNN = 2.76 TeV [6] for both ppcollisions and the most central Pb+Pb collisions. Due to the smaller available luminosity at 2.76 TeV, this comparison is only possible forpT,1<200 GeV. The 5.02 TeV result has twopT,1selections (158–178 GeV and 178–200 GeV) that cover the range of the singlepT,1selection for the 2.76 TeV measurement that overlaps with the 5.02 TeV measurement range. Inppcollisions, thexJ