ATLAS-CONF-2010-047 28July2010
ATLAS NOTE
ATLAS-CONF-2010-047
July 15, 2010
Charged particle multiplicities in pp interactions at √
s = 2.36 TeV measured with the ATLAS detector at the LHC
The ATLAS Collaboration
Abstract
In December 2009 data at the centre-of-mass energy of √
s = 2.36 TeV were recorded with the ATLAS detector. This was the first time the LHC had been operated at this beam energy and stable beam conditions were not declared. Therefore, to ensure detector safety, the silicon strip detector was in standby mode with reduced sensor bias voltage, which makes track reconstruction more difficult. Two complementary methods were developed to measure the charged particle multiplicity distributions and, in particular, estimate the track reconstruction efficiency under these challenging conditions. The first uses the full In- ner Detector information and corrects the efficiency from the simulation using a data-driven technique. The second uses tracks reconstructed from pixel detector information only. The charged particle multiplicity and its dependence on transverse momentum and pseudorapid- ity are measured for events with at least one charged particle in the kinematic range |η | < 2.5 and p
T> 500 MeV. The average charged particle multiplicity at central pseudorapidity is measured to be 1.739 ± 0.019 (stat) ± 0.058 (syst) at √
s = 2.36 TeV.
1 Introduction
Inclusive charged particle distributions measured in pp and p p ¯ collisions at a range of different centre- of-mass energies [1–13] have been used to constrain phenomenological models of soft-hadronic inter- actions. The ATLAS experiment has previously measured inclusive charged particle distributions at centre-of-mass energies of √
s = 900 GeV [14] and 7 TeV [15].
On December 13th and 15th in 2009, ATLAS recorded collision data at a centre-of-mass energy of
√ s = 2.36 TeV which was temporarily the world record for high energy proton-proton collisions until the collisions at √
s = 7 TeV on 30 March 2010. This was the first time the LHC had been operated at these beam energies and stable beam conditions were not declared. As a consequence, the silicon strip detector (SCT) was not in full-operational mode. The SCT is one of three sub-detectors of the ATLAS Inner Detector (ID). The remaining two are a silicon pixel detector (pixel) and a transition radiation tracker (TRT). The ID provides full coverage in φ over a pseudorapidity range |η| < 2.5 [16]. Throughout the data-taking period at √
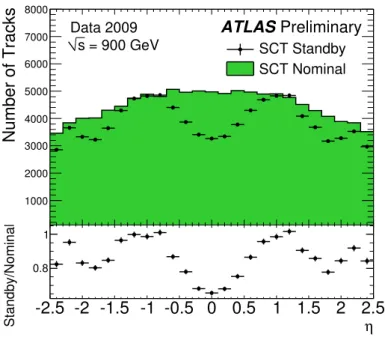
s = 2.36 TeV, the sensor bias voltage of the SCT was reduced from 150 V to 20 V, which leads to lower hit efficiencies and increased noise, because this voltage is not sufficient to fully deplete the sensor volume. This mode will be referred to as standby mode and the configuration with the SCT fully depleted at 150 V as nominal mode. Figure 1 shows how the distribution of the number of tracks as a function of pseudorapidity η is significantly altered when the SCT is operated in standby mode.
The data were analysed with two complementary methods: the pixel track method is based on tracks reconstructed with information from the pixel detector only and the ID track method uses tracks re- constructed from hits in the full ID with a modified reconstruction algorithm. The pixel track method introduces a technique to estimate a component of the track reconstruction efficiency from data, which reduces the dependence on the simulation. It is unaffected by the SCT conditions and has a reduced sen- sitivity to uncertainties on the ID material budget. The ID track method uses a correction factor derived from data to correct the efficiency estimated from the nominal simulation. It provides better track pa- rameter resolution and is similar to previous ATLAS analyses of charged particle multiplicities [14, 15].
The distributions of tracks reconstructed in the Inner Detector were corrected to obtain the following particle-level distributions at √
s = 2.36 TeV:
1 N
ev· dN
chdη , 1 N
ev· 1
2π p
T· d
2N
chdη dp
Tand 1 N
ev· dN
evdn
chwhere η is the pseudorapidity, p
Tthe transverse momentum, N
evis the total number of events with at least one charged particle with |η| < 2.5 and p
T> 500 MeV, N
chthe total number of primary charged particles
1in N
evand n
chthe number of charged particles per event. The multiplicity as a function of pseudorapidity is measured with both methods, the multiplicity with the pixel track method only and the multiplicity as a function of the transverse momentum with the ID track method. The lack of a fully tuned simulation sample makes unfolding the n
chdistribution difficult for the ID track, while the short pixel track length results in a significantly degraded momentum estimate. For this reason, the correction factors for the pixel track were integrated over p
T.
As both methods are highly correlated, no combination of the results was attempted. Therefore the measured charged particle multiplicity at central pseudorapidity is quoted for the pixel track method only, which will be shown to have a smaller systematic uncertainty. Comparisons are made to previous ATLAS measurements [14, 15] and to predictions from Monte Carlo (MC) models.
1Primary charged particles are defined as charged particles with a mean lifetimeτ>3×10⁻¹¹s directly produced inpp interactions or from the subsequent decays of particles with a shorter lifetime.
-2.5 -2 -1.5 -1 -0.5 0 0.5 1 1.5 2 2.5
Number of Tracks
1000 2000 3000 4000 5000 6000 7000 8000
η
-2.5 -2 -1.5 -1 -0.5 0 0.5 1 1.5 2 2.5
Standby/Nominal
0.8 1
ATLAS Preliminary
Data 2009= 900 GeV
s SCT Standby
SCT Nominal
Figure 1: The number of reconstructed tracks in data at √
s = 900 GeV as a function of η with the SCT in nominal and standby. The distributions are normalised to the number of events passing the trigger requirement.
The two analyses were performed independently. The technique to estimate the trigger and ver- tex efficiency, the contamination from beam background and non-primary particles, and the correction procedure used to correct the measured distributions to the primary charged particle distributions, are similar. However, the methods differ significantly in the estimation of the track reconstruction efficiency and the techniques used to assess the systematic uncertainties. The term track refers to either pixel tracks or ID tracks as appropriate. Tracks used to produce the corrected distributions are termed selected tracks.
2 Event and Track Selection
All data recorded by ATLAS at √
s = 2.36 TeV with the pixel detector fully operational are analysed.
The SCT was in standby for the full dataset at √
s = 2.36 TeV. Events were triggered using information from the Beam Pickup Timing devices (BPTX) and the Minimum Bias Trigger Scintillators (MBTS).
The BPTX are beam pick-ups attached to the beam pipe ± 175 m from the centre of the ATLAS detector and used to identify colliding bunches. The MBTS are mounted at each end of the detector and provide a pseudorapidity coverage of 2.09 < |η| < 3.84. In total, there were 8151 events from colliding proton bunches in which the MBTS trigger recorded at least one counter above threshold on each side. In addition two reference datasets were recorded at √
s = 900 GeV. One consisted of 27226 events with the SCT in standby and the other consisted of 59498 events from the same data taking period with the SCT at nominal voltage. The data-driven corrections to the track reconstruction efficiency were derived from these reference datasets for each method. As the beam spot size differs between the two centre-of-mass energies, the distributions obtained from the reference datasets were corrected to the beam spot size at
√ s = 2.36 TeV.
Events were required to contain a primary vertex reconstructed using at least two tracks with p
T>
150 MeV, and a transverse distance of closest approach with respect to the beamspot (BS) position
|d
0BS| < 4 mm. Vertex reconstruction for both methods uses tracks formed with full Inner Detector in- formation which fulfill identical vertex preselection requirements. The reconstructed beam spot position was used as a constraint in the vertex fit.
Events were also required to contain at least one selected track with p
T> 500 MeV and impact parameters with respect to the primary vertex, |d
0| < 1.5 mm and |z
0sinθ | < 1.5 mm. ID tracks were required to have at least one pixel hit, while pixel tracks were required to have at least one hit in the innermost pixel layer. In total, 5929 (5984) events were selected by this offline selection, which contained 38983 (44788) tracks for the ID track (pixel track) method.
The trigger and vertex reconstruction efficiencies are parameterised as a function of the number of tracks passing all track selection requirements except for impact parameter requirements. This is because the correction procedure requires the efficiency to be calculated for events without a primary vertex. The transverse impact parameter with respect to the beam spot was required to be within |d
0BS| < 4 mm. The multiplicity of these pre-selected tracks is termed n
BSSel. Preselected tracks differ from the tracks used in the vertex reconstruction by the hit and transverse momentum requirement for the ID track method. The pixel track method uses pixel tracks for the pre-selected tracks, but ID tracks for the vertex reconstruction.
3 Track Reconstruction
ID tracks were reconstructed with the robust settings of the inside-out track reconstruction algorithms [17].
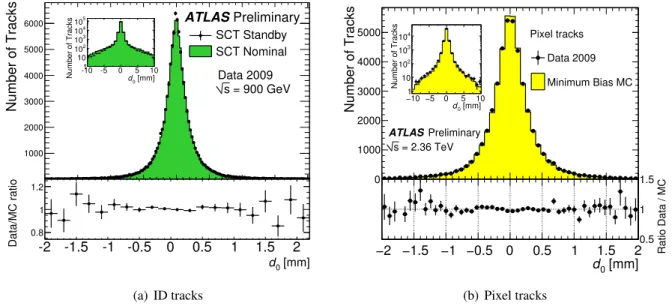
These settings loosen the track quality requirements to allow tracks to be reconstructed despite the low efficiency of the SCT. The robust reconstruction has been validated by comparing the performance be- tween data and simulation when the SCT was at nominal or in standby. Figure 2(a) shows that the transverse impact parameter distribution is not significantly different when the SCT is in standby. This is because the impact parameter resolution is dominated by the information from the pixel detector.
Pixel tracks were reconstructed using the same inside-out track reconstruction algorithm, but re- stricted to hits from the pixel detector. The pixel track method also uses tracks reconstructed from hits in the SCT and TRT, so-called SCT-TRT tracks, which were reconstructed by the inside-out algorithm and an additional outside-in sequence which starts the track finding process in the TRT. The SCT-TRT tracks were used to measure the relative track reconstruction efficiency and resolutions of pixel tracks in data.
The transverse impact parameter distribution of the pixel tracks is reasonably described by the sim- ulation (see Fig. 2(b)). However, fitting a constant line to the ratio between data and simulation yields a 20% deviation in the tails of the impact parameter distribution ( |d
0| > 2 mm). This deviation contributes to the systematic uncertainty on the rate of secondaries. The momentum resolution of pixel tracks is significantly worse than for ID tracks due to the reduced track length. The resolution is improved by approximately a factor two by refitting the pixel tracks with the primary vertex as an additional mea- surement as shown in Fig. 3(a). However, it remains a factor of 6 worse than for ID tracks. For events where no primary vertex was reconstructed, which are only used to calculate the vertex reconstruction efficiency, the beam spot was used as an additional measurement point for the pixel tracks. The p
Treso- lution of pixel tracks has also been studied in data by comparing the reconstructed p
Tof a pixel track to the corresponding SCT-TRT track. This relative resolution agrees well between data and simulation (see Fig. 3(b)). The relative resolution is dominated by the pixel track resolution as can be seen by comparing Fig. 3(a) and Fig. 3(b).
4 Background
The background from cosmic ray events and beam backgrounds have been previously estimated to be
below 10
−6and 10
−4respectively [14]. The contribution from additional interactions was estimated
-2 -1.5 -1 -0.5 0 0.5 1 1.5 2
Number of Tracks
1000 2000 3000 4000 5000 6000
[mm]
d0
-10 -5 0 5 10
Number of Tracks
1 10 102
103
104
105
[mm]
d0
-2 -1.5 -1 -0.5 0 0.5 1 1.5 2
Data/MC ratio
0.8 1 1.2
ATLASPreliminary
Data 2009 = 900 GeV s
SCT Standby SCT Nominal
(a) ID tracks
[mm]
d0
Number of Tracks
0 1000 2000 3000 4000 5000
[mm]
d0
Number of Tracks
0 1000 2000 3000 4000 5000
ATLASPreliminary = 2.36 TeV s
[mm]
d0
−2 −1.5 −1 −0.5 0 0.5 1 1.5 2 Ratio Data / MC 0.5 1 1.5 Pixel tracks
Data 2009 Minimum Bias MC [mm]
d0
−10 −5 0 5 10
Number of Tracks
1 10 102
103
104
(b) Pixel tracks
Figure 2: The distributions of the transverse impact parameter with respect to the primary vertex in data with the SCT in nominal and standby mode for ID tracks reconstructed with the robust setup at
√ s = 900 GeV (a). Comparison of the transverse impact parameter distribution with respect to the primary vertex of pixel tracks in data and simulation at √
s = 2.36 TeV (b).
η
−2.5 −2 −1.5 −1 −0.5 0 0.5 1 1.5 2 2.5 ) T(q/pσ x T p
0 0.02 0.04 0.06 0.08 0.1 0.12 0.14 0.16 0.18 0.2 0.22 0.24
Pixel Tracks, Minimum Bias MC Refit with Vertex No Refit
ATLASPreliminary = 900 GeV s
(a) Pixel track resolution
η
−2.5 −2 −1.5 −1 −0.5 0 0.5 1 1.5 2 2.5 ) T(q/pσ x Tp
0 0.02 0.04 0.06 0.08 0.1 0.12 0.14 0.16 0.18 0.2 0.22 0.24
ATLAS Preliminary = 900 GeV s Relative Resolution
Data 2009 Minimum Bias MC
(b) Pixel track relative resolution
Figure 3: The p
Tresolution of pixel tracks in simulation as a function of η reconstructed with and without the primary vertex constraint (a). Comparison of the relative resolution, the p
Tof pixel tracks measured with respect to the p
Tof the SCT-TRT tracks, in data and simulation at √
s = 900 GeV as a function of η (b).
to be below 0.1% at √
s = 7 TeV for the ID track method, and is expected to be significantly lower at
√ s = 2.36 TeV and is therefore neglected.
The selected track distributions are corrected for the fraction of secondary particles, which are es- timated to be approximately 2% (between 2% and 4%) for the ID (pixel) track method from the simu- lation. The secondary rate has previously been demonstrated to be well described by the simulation at
√ s = 900 GeV and √
s = 7 TeV [14, 15]. The fraction of secondaries is corrected as a function of p
Tand
η for the ID track method and η for the pixel track method. The background from fake tracks has been
estimated from simulation and was found to be below 0.01% for the ID track method and 0.1% for the pixel track method and no strong p
Tdependence was observed.
5 Selection Efficiency
The data were corrected to obtain inclusive spectra of charged particles for events containing at least one primary particle with p
T> 500 MeV and |η| < 2.5. Inefficiencies due to the trigger selection, vertex and track reconstruction as well as effects due to the momentum resolution and background from secondary particles were corrected.
The trigger efficiency at √
s = 2.36 TeV is assumed to be the same as measured at √
s = 900 GeV [14].
The trigger efficiency is close to 100%, but slightly lower for events with low n
BSSel. The vertex recon- struction efficiency was measured in data as a function of n
BSSel. The vertex reconstruction efficiency is 100% for events containing three or more pre-selected tracks. For events containing only one pre- selected track, the efficiency was 82% for the ID track method and 75% for the pixel track method. The efficiency is lower than previous measurements [14, 15] due to the low SCT efficiency, which decreases the efficiency to reconstruct the tracks used in the vertex fit. The vertex reconstruction efficiency differs between the two methods, because the pre-selected track collections differ and a slightly different vertex reconstruction configuration was used.
Track Reconstruction Efficiency The track reconstruction efficiency was estimated for each bin of the p
T-η acceptance from the simulation for the ID track method. For the pixel track method the track reconstruction efficiency is calculated as a function of η. The efficiency was defined as:
ε MC (x) = N
recmatched(x)
N
gen(x) , (1)
where
• x = p
T,η for the ID track method, and
• x = η for the pixel track method.
N
gen(x) is the number of generated particles in a bin and N
recmatched(x) is the number of reconstructed tracks matched to a generated charged particle in that bin. The pixel track method matches reconstructed particles to generated particles by requiring at least 60% of the hits of the track to originate from the primary particle. The ID track method matches primaries to reconstructed tracks within a η − φ cone of radius 0.05. The two matching techniques have been shown to be in good agreement.
Both methods apply a data-driven correction to the primary track reconstruction efficiency derived from the simulation at √
s = 2.36 TeV:
ε(x) = ε MC (x) · ε corr (η) (2) The correction is derived from the reference dataset at √
s = 900 GeV. For the pixel track method this correction factor, ε corr, is the ratio from data to simulation of the relative efficiency to reconstruct a pixel track if a SCT-TRT track has been reconstructed:
ε corr (η) = ε Data rel (η) ε MC
rel (η ) (3)
For the ID track method the efficiency is derived from simulation with nominal conditions, and ε corr
is used to correct for the lower SCT efficiency in standby mode. The correction factor, ε corr, is the ratio
of the number of reconstructed tracks with the SCT in standby (N sb
tr ) to the number of reconstructed tracks with the SCT at nominal (N nom
tr ):
ε corr (η ) = N sb tr (η) N nom
tr (η) (4)
The correction ε corr was assumed to be independent of p
T. The small potential dependency on the particle momentum due to slightly different ionisation was not significant in comparison to the statistical limitation of the dataset. At low p
T, tracks bend more in the transverse plane such that they have a longer path length in the silicon. The change to the efficiency was calculated and found to be negligible.
Although kaons are more heavily ionising than pions at low p
T, the fraction of kaons is small, such that even if kaons were reconstructed with twice the efficiency, the change to the average efficiency would be at the sub-percent level.
Pixel Track Efficiency Correction The relative pixel track reconstruction efficiency is measured by matching pixel tracks to SCT-TRT tracks using a χ
2criteria. The χ
2is calculated from the relative difference between the angular track parameters of the pixel and SCT-TRT tracks on a surface between the sub-detectors. An SCT-TRT track is matched to a pixel track if the χ
2is smaller than 10. The efficiency does not depend strongly on the value used for the matching cut.
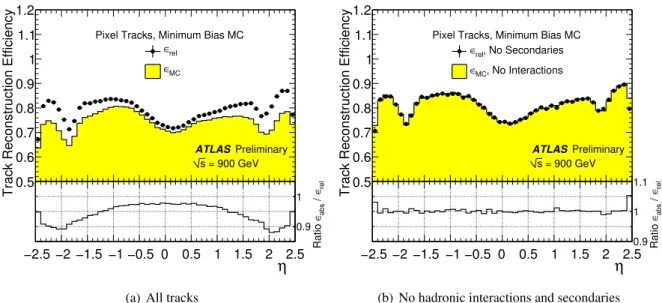
Figure 4(a) compares the relative efficiency to the primary reconstruction efficiency in simulation.
The two efficiencies agree to the few percent level at central pseudorapidity. However, at more forward values of the pseudorapidity, the relative efficiency is up to 10% higher. This discrepancy is due to hadronic interactions, secondaries and weakly decaying charged particles.
A primary particle which undergoes a hadronic interaction or decays weakly such that it is not re- constructed as either a pixel or a SCT-TRT track contributes to the primary efficiency but not the relative efficiency. Secondary tracks reconstructed as SCT-TRT tracks without a corresponding pixel track con- tribute to the relative efficiency, but not the primary efficiency. Figure 4(b) shows that, if these signatures are removed by requiring no loss or decay of the primary particle inside the silicon volume of the detec- tor and by removing tracks from secondary interactions in the corresponding MC samples, the primary and relative pixel track reconstruction efficiency agree to within 1% for most values of η. The 4%
discrepancy for 2.4 < |η| < 2.5 is taken as a systematic uncertainty.
Figure 5 shows that the relative efficiency obtained at √
s = 900 GeV but reweighted to the beam spot at √
s = 2.36 TeV, is consistent to within 2% with the relative efficiency obtained from simulation at √
s = 2.36 TeV. The ratio of these two relative efficiencies is the correction factor, ε corr, used for the pixel track method. No significant dependence of the correction factor on p
Twas observed.
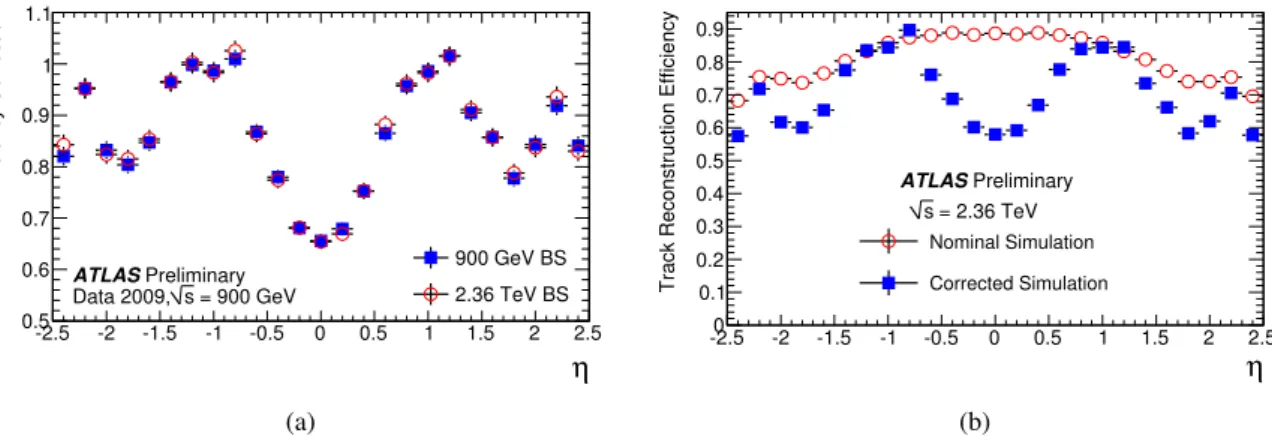
ID Track Efficiency Correction For the ID track method the track reconstruction efficiency in data is expected to be significantly different than in the nominal simulation samples. The sensors are only partially depleted and the hit reconstruction efficiency increases with the incidence angle. This means that in addition to the ID track reconstruction efficiency being lower, it varies strongly with the pseudora- pidity. The efficiency correction factor was derived using the reference datasets taken at √
s = 900 GeV.
Figure 6(a) shows the ratio of the number of tracks reconstructed with the SCT in standby to the num- ber of ID tracks reconstructed with the SCT in nominal mode at √
s = 900 GeV. The two datasets were normalised to the number of triggered events. The correction applied to the √
s = 2.36 TeV data is also derived from √
s = 900 GeV data, but corrected to the beam spot at √
s = 2.36 TeV.
The ID track reconstruction efficiency before and after this correction has been applied is shown in
Fig. 6(b). The correction was not found to depend significantly on p
T. The average ID track reconstruc-
tion efficiency is estimated to be 69% integrated over the pseudorapidity.
η Track Reconstruction Efficiency0.5
0.6 0.7 0.8 0.9 1 1.1 1.2
Pixel Tracks, Minimum Bias MC
∈rel
∈MC
ATLASPreliminary = 900 GeV s
η
−2.5 −2 −1.5 −1 −0.5 0 0.5 1 1.5 2 2.5
rel∈ / abs∈Ratio
0.9 1
(a) All tracks
η Track Reconstruction Efficiency0.5
0.6 0.7 0.8 0.9 1 1.1 1.2
Pixel Tracks, Minimum Bias MC , No Secondaries
∈rel
, No Interactions
∈MC
ATLASPreliminary = 900 GeV s
η
−2.5 −2 −1.5 −1 −0.5 0 0.5 1 1.5 2 2.5
rel∈ / abs∈Ratio
0.9 1 1.1
(b) No hadronic interactions and secondaries
Figure 4: The relative pixel track reconstruction efficiency with respect to the SCT-TRT tracks and the primary pixel track reconstruction efficiency as a function of η . (a) shows the efficiency for all primary particles and reconstructed tracks, while (b) shows the same efficiency but neglects particles which underwent hadronic interactions, weak decays and tracks from secondary particles.
η Track Reconstruction Efficiency0.5
0.6 0.7 0.8 0.9 1 1.1 1.2
, Pixel Tracks
∈rel
= 900 GeV s
Reweighted Data 2009, = 2.36 TeV s
Minimum Bias MC,
ATLASPreliminary
η
−2.5 −2 −1.5 −1 −0.5 0 0.5 1 1.5 2 2.5 Ratio Data / MC 0.9 1 1.1
Figure 5: Relative efficiency in reweighted data and simulation at √
s = 900 GeV and simulation at
√ s = 2.36 TeV
6 Correction Procedure
Events lost due to the trigger and vertex requirements are corrected for using a weight for each event:
w
ev(n
BSSel) = 1
ε
trig(n
BSSel) · 1
ε
vtx(n
BSSel) , (5)
η
-2.5 -2 -1.5 -1 -0.5 0 0.5 1 1.5 2 2.5
Efficiency Correction
0.5 0.6 0.7 0.8 0.9 1 1.1
900 GeV BS 2.36 TeV BS ATLASPreliminary
= 900 GeV s
Data 2009,
(a)
η
-2.5 -2 -1.5 -1 -0.5 0 0.5 1 1.5 2 2.5
Track Reconstruction Efficiency
0 0.1 0.2 0.3 0.4 0.5 0.6 0.7 0.8 0.9
Nominal Simulation Corrected Simulation ATLASPreliminary
= 2.36 TeV s
(b)
Figure 6: The efficiency correction factors for 900 GeV and 2.36 TeV as a function of η for the ID track method extracted from data at √
s = 900 GeV (a). The latter has been reweighted to the beamspot at √
s = 2.36 TeV. Track reconstruction efficiency as a function of η before and after the data-driven correction (b).
where ε
trig(n
BSSel) and ε
vtx(n
BSSel) are the trigger and vertex reconstruction efficiencies as a function of the number of pre-selected tracks, n
BSSel. For the pixel track method, n
BSSel, includes pixel tracks refitted to the beam spot in events without a reconstructed vertex.
The p
Tand η distributions of selected tracks were corrected by using a weight for each track:
w
trk(x) = 1
ε · (1 − f
sec(x)) ·(1 − f
okr(x)), (6) where ε is the track-reconstruction efficiency and f
sec(x) is the fraction of secondaries. Due to the p
Tand η resolution a certain fraction of the selected tracks are produced by particles outside the kinematic range.
This was corrected for in both methods by using a factor obtained from simulation, f
okr(x). Migrations between bins were found to depend only on the track momentum resolution and were corrected for using a resolution function obtained from simulation.
For the distributions expressed as a function of n
ch, a track-level correction was applied by using Bayesian unfolding [18] to correct back to the number of charged particles. A matrix M
ch,Sel, which expresses the probability that a particular multiplicity of selected tracks n
Selis due to n
chparticles, was populated using simulation and applied to obtain the n
chdistribution from the data. The resulting distri- bution was then used to re-populate the matrix and the correction was re-applied. This procedure was repeated without a regularisation term until convergence.
The matrix cannot correct for events lost due to track-reconstruction inefficiency. To correct for these missing events, a bin by bin correction factor w
f= 1/(1 −(1 − hε i)
nch) was applied to the n
chdistribution, where hεi is the average track-reconstruction efficiency.
7 Systematic Uncertainties
Trigger and Vertex Efficiency The systematic uncertainty on the trigger and vertex reconstruction
efficiency is measured as a function of the number of pre-selected tracks using the same strategy for
both methods. The systematic uncertainty on the trigger efficiency from [14] is 0.1% from the statistical
uncertainty, 0.1 % for n
BSSel< 4 from the difference in the efficiency calculated as a function of the number
of pre-selected or selected tracks and 0.2% for n
BSSel= 1 due to the correlation between the MBTS and the
control trigger used to measure the trigger efficiency in data. The systematic uncertainty on the vertex reconstruction efficiency is 0.1% (0.4%) for the ID track (pixel track) method. The uncertainty on the vertex reconstruction efficiency is larger for the pixel track method due to lower rejection power of the impact parameter cuts to beam background once the tracks have been fitted to the primary vertex.
Track Reconstruction A large component of the track reconstruction efficiency was taken from sim- ulation and therefore the systematic uncertainty stems from the level to which the simulation describes the data. Previous analyses have estimated that the dominant systematic uncertainty results from uncer- tainties on the ID material budget. Several studies [14, 19] have estimated the uncertainty on the material budget of the Inner Detector to be less than 10%. Therefore a simulation sample in which the Inner Detector material was scaled by 10% was used to estimate a 2% (4%) uncertainty on the pixel (ID) track reconstruction efficiency. The uncertainty is larger for the ID track method, because it is sensitive to the material throughout the silicon detector. Additional uncertainties for the ID track method for |η | > 1.6 account for observed differences between data and simulation.
The following additional contributions to the systematic uncertainty on the pixel track reconstruction efficiency have been considered:
• The uncertainty from the association of reconstructed to generated particles was estimated to be 1% by comparing the results from the hit-based matching with a cone-matching approach and additional variation of the cone size.
• A 40% uncertainty on the production cross-section of long-lived charged particles such as Σ or Ξ results in a systematic uncertainty of 0.5% on the pixel track reconstruction efficiency.
• The statistical uncertainty on the correction to the pixel track reconstruction efficiency is 0.7 %.
• The discrepancy between primary and relative pixel track reconstruction efficiency for 2.4 < |η| <
2.5 is 4%.
• Varying the value of the matching χ
2cut had a negligible impact on the efficiency.
• Uncertainties due to pixel track selection cuts and remaining misalignment were estimated to be below 1%.
The total uncertainty on the pixel track reconstruction efficiency is estimated to be 3.4% at η = 0.
Most systematic uncertainties on the ID track reconstruction efficiency are taken directly from [14, 15]. The major additional systematic uncertainty is on the efficiency correction factor. The uncertainty due to the statistical limitations of the reference dataset is 2%. An additional 3% uncertainty accounts for the extrapolation from √
s = 900 GeV to √
s = 2.36 TeV. This was estimated by comparing the fluctuations of the distributions of the number of ID tracks between √
s = 900 GeV and √
s = 2.36 TeV.
In total, the systematic uncertainty on the ID track reconstruction efficiency at central η is 6%.
Out of Phase Space Correction Due to the poor momentum resolution of the pixel tracks, the fraction of pixel tracks with reconstructed p
T> 500 MeV from primary particles with true p
T< 500 MeV is approximately 5%. The systematic uncertainty on this correction was estimated by comparing pairs of matched tracks in which the SCT-TRT track has p
T< 500 MeV and the pixel track has p
T> 500 MeV.
A difference of 1% was observed between data and simulation, which propagates into an uncertainty of 1.1% on the corrected distributions.
The η and p
Tresolutions of ID tracks were shown to be comparable between the datasets with the SCT in nominal and standby mode. Hence the out-of-phase space correction was estimated from the simulation at √
s = 2.36 TeV, using the technique from [14].
Fraction of secondary and fake tracks The systematic uncertainty on secondary and fake pixel tracks is estimated from the 20% discrepancy in the tails of the d
0distribution between data and simulation (see Fig. 2(b) ). This propagates into an uncertainty on the multiplicity at central pseudorapidity of 0.6%.
The fraction of secondaries and fakes for ID tracks is unchanged by the efficiency correction due to the lower depletion voltage because the efficiency is lower for both the numerator and the denominator.
In addition, the tails of the d
0distribution have been shown to be consistent between data and simulation.
The systematic uncertainty for ID tracks is taken from [14].
Number of events N
evThe total number of events N
evis obtained from the corrected (1/N
ev) ·(dN
ev/dn
ch) distribution. Several tests were made to assess the model dependence of the correction matrix for the pixel track method. Populating the matrix with different relative weights to the diffractive components in the simulation introduces larger systematic uncertainties on the lower bins of the n
chdistribution. The total number of events, however, varies by only 0.1%.
Assuming a 6% (3%) uncertainty on the ID track (pixel track) reconstruction efficiency introduces systematic uncertainties over the whole range of the n
chdistribution and changes the total number of events by 1.8% (0.5%). The statistical uncertainty on N
evwas found to be 1.2% for both methods. In addition, due to difficulties with unfolding the n
chdistribution for the ID track method caused by the rapidly changing efficiency and the lack of an appropriate simulation sample for the standby mode, a cross-check on the number of events was made. The number of events in the 0-bin was estimated from the track reconstruction efficiency and the n
chdistribution measured by the pixel track method and the correction increased by 1%.
Propagation of the Systematic Uncertainties The systematic uncertainty on the normalisation and the number of charged particles were treated separately with each of the components of the systematic uncertainty added in quadrature. They were then combined and the anti-correlation of the uncertainty on the number of events and the track reconstruction efficiency were accounted for when propagating them into the final distributions. The different contributions to the systematic uncertainty on the charged- particle density for each method at η = 0 are summarised in Table 1.
Most systematic uncertainties on the two methods are fully correlated. The 2% from the uncertainty on the material budget in the pixel detector is correlated. The remaining 3% uncertainty on the ID track method due to the material is uncorrelated. The uncertainties on the efficiency correction factors are uncorrelated as well as the out-of-phase-space correction.
8 Results
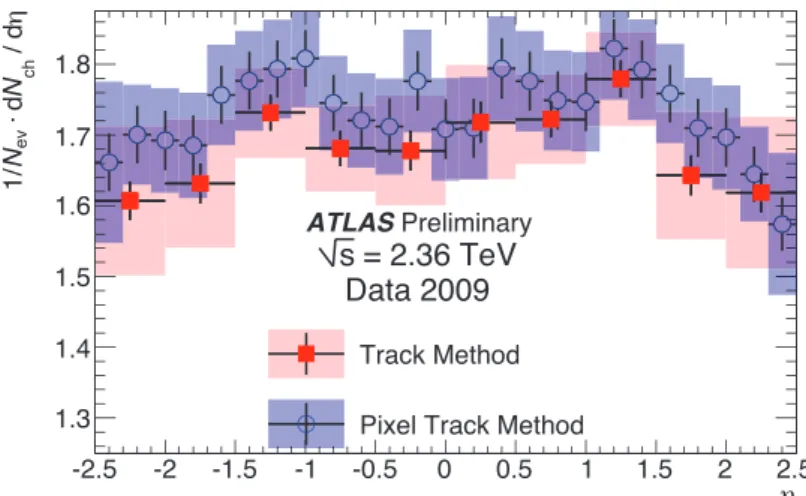
The corrected pseudorapidity density of primary charged particles in events with n
ch≥ 1 for p
T>
500 MeV and |η| < 2.5 is shown for both methods in Fig. 7. The results of the two methods are con- sistent to within 3%, approximately the size of the uncorrelated systematic uncertainties. The charged particle multiplicity is measured using the pixel track method and the charged particle multiplicity as a function of the transverse momentum by the ID track method. The results obtained for the reference run at √
s = 900 GeV are compared to the previously published results in Appendix A.
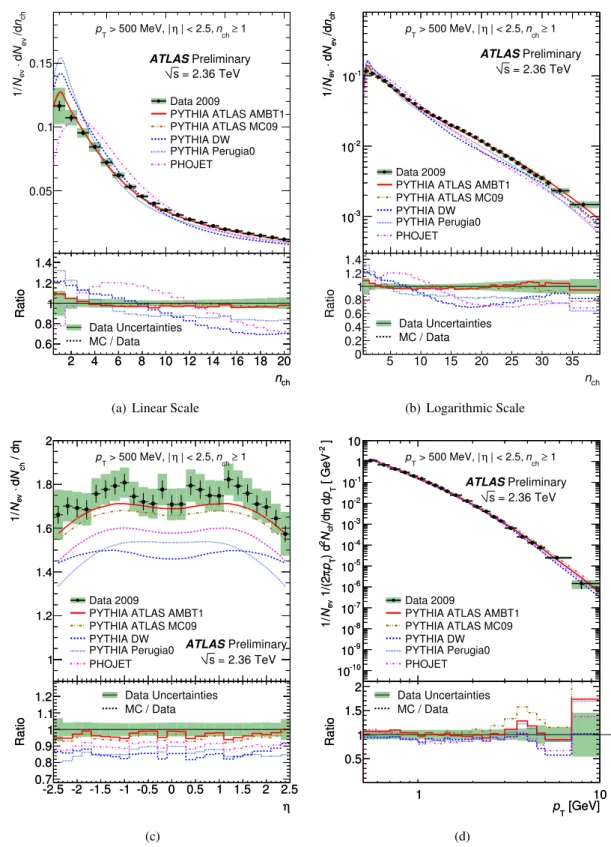
Figure 8 compares the corrected primary charged particles distributions with the predictions from models tuned to various different measurements. As in previous ATLAS measurements, the data are presented as inclusive inelastic distributions with minimal model-dependent corrections. In addition to the models used in previous comparisons, the new ATLAS tune (AMBT1 [20]) is shown, which was tuned to ATLAS results at √
s = 900 GeV and √
s = 7 TeV.
The multiplicity distribution as a function of n
chis shown in linear (Fig. 8(a)) and logarithmic scale
(Fig. 8(b)) for the pixel track method. The PYTHIA DW and Perugia models show an excess of events
Uncertainty on N
evSource of uncertainty Pixel track Method ID track Method
Vertex reconstruction efficiency 0.4% < 0.1%
Track reconstruction efficiency 0.5% 1.8%
Different Monte Carlo Tunes 0.1% 0.4%
Statistical uncertainty 1.2% 1.2%
Total uncertainty on N
ev1.4% 2.6%
Systematic uncertainty on (1/N
ev) · (dN
ch/dη)
Source of systematic uncertainty Pixel track method Track method Trigger and Vertex reconstruction efficiency 0.1% < 0.1%
Track reconstruction efficiency 3.4% 6 %
Out of phase space correction 1.1% < 0.1%
Secondary fraction 0.6% 0.1%
Correlated Uncertainty on N
ev-0.5% -1.8%
Uncorrelated Uncertainties from N
ev1.3% 1.7%
Total systematic uncertainty on (1/N
ev) ·(dN
ch/dη) 3.5% 4.5 %
Table 1: Summary of systematic uncertainties on the number of events, N
evand on the charged parti- cle density, (1/N
ev) · (dN
ch/dη) for |η | < 0.5. The uncertainty on N
evdue to the track reconstruction efficiency is anticorrelated to dN
ch/dη. All other sources are assumed to be uncorrelated.
η
-2.5 -2 -1.5 -1 -0.5 0 0.5 1 1.5 2 2.5
η / d chN d⋅evN1/
1.3 1.4 1.5 1.6 1.7 1.8
Track Method Pixel Track Method ATLASPreliminary
= 2.36 TeV s
Data 2009
Figure 7: Comparison of charged particle multiplicity distributions at √
s = 2.36 TeV between the pixel track and ID track methods.
for low n
ch. It reflects in the fact that the fraction of events for larger n
chis lower than that observed in data, which becomes visible at low n
chbecause the distribution is normalised to unity. PHOJET predicts a lower fraction of events at low n
ch, a higher fraction for n
ch< 12, and then a rapidly decreasing fraction.
The PYTHIA AMBT1 tune predicts a 5% excess of events for n
ch= 1, but otherwise agrees with the measured values to within 2%.
The charged-particle pseudorapidity density as measured by the pixel track method is shown in Fig. 8(c). It is measured to be approximately flat in range |η | < 1.5 and drops for higher values of η . An average value of 1.739 ± 0.019 (stat) ± 0.058 (syst) charged particles per event is measured for
|η| < 0.5 with the pixel track method. This is slightly higher than the prediction from AMBT1 or MC09.
The other models underestimate the multiplicity by 15%-20%. The shape of the distribution is consistent
with the models shown with the exception of PYTHIA DW.
The N
chdistribution versus transverse momentum as measured by the ID track method is shown in Fig. 8(d). Each entry has been weighted by 1/p
T. Most models describe the data in the measured momentum range, which is limited by the number of events in the dataset. The PYTHIA DW and PHOJET models underestimate the number of primary charged particles with p
T> 5 GeV.
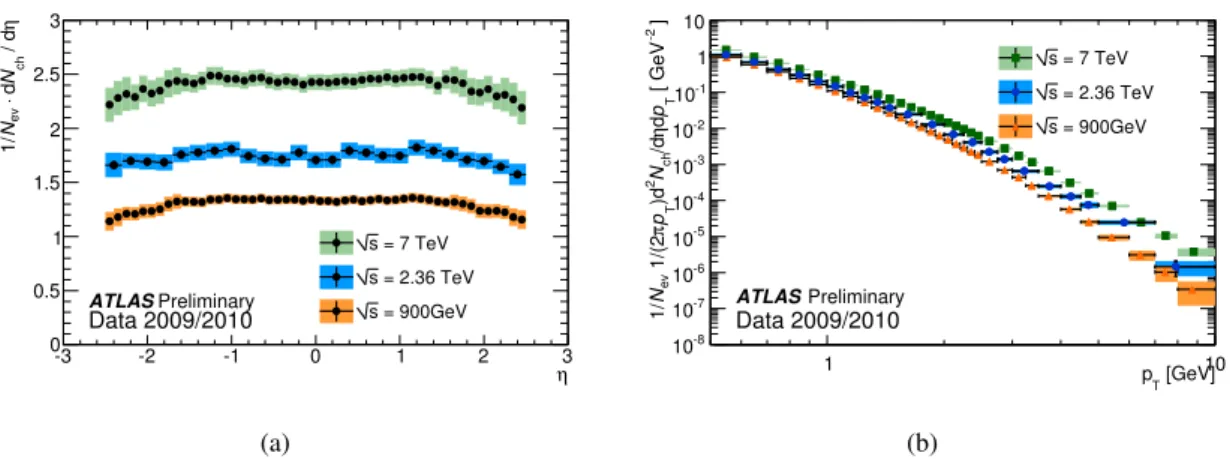
The charged particle multiplicity measurements at √
s = 2.36 TeV are compared to previous ATLAS measurements [14, 15] at different centre-of-mass energies in Fig. 9 and 10. The increase in the multi- plicity and hardening of the p
Tspectrum with increasing centre-of-mass energy is observed. At higher centre-of-mass energy the average multiplicity increases. Therefore the fraction of events at low n
chis relatively smaller than that of events at high n
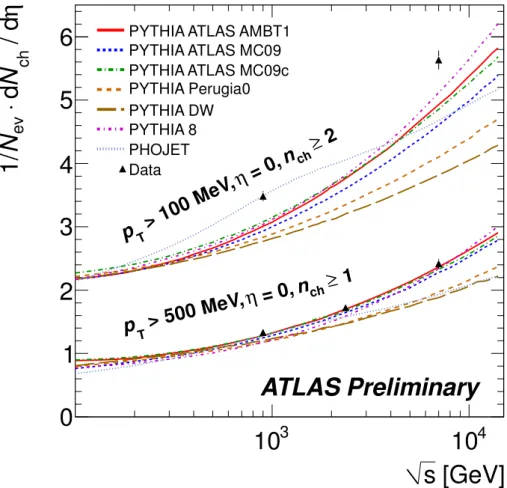
ch. The fraction of events with n
ch= 10 is approximately independent of the centre-of-mass energy. Finally, the dependence of the charged particle multiplicity at central pseudorapidity on the centre-of-mass energy is compared to the predictions from different mod- els, see Fig. 11. The ATLAS AMBT1 and MC09c tunes describe the increase with energy, while the Perugia tune predicts a slower increase in multiplicity with the centre-of-mass energy.
9 Conclusion
Charged-particle multiplicity measurements with the ATLAS detector at √
s = 2.36 TeV are presented.
The data were taken with the SCT in standby, which makes track reconstruction challenging. In to- tal 8151 proton-proton interactions were used to study the properties of events containing at least one charged particle within the kinematic range |η| < 2.5 and p
T> 500 MeV.
The analysis used two complementary methods: one measured the multiplicity using tracks recon- structed in the pixel detector only and the other used ID tracks with a data-driven correction for the track reconstruction efficiency. Consistent results were obtained between the two methods.
The charged particle multiplicity at η = 0 at √
s = 2.36 TeV is measured to be 1.739 ± 0.019 (stat)
± 0.058 (syst) using the pixel track method, which is in agreement with the prediction from the PYTHIA AMBT1 model.
References
[1] CMS Collaboration, V. Khachatryan et al., Transverse momentum and pseudorapidity distributions of charged hadrons in pp collisions at √
s = 0.9 and 2.36 TeV, JHEP 02 (2010) 041, arXiv:1002.0621 [hep-ex].
[2] ALICE Collaboration, K. Aamodt et al., First proton–proton collisions at the LHC as observed with the ALICE detector: measurement of the charged particle pseudorapidity density at
√ s = 900 GeV , Eur. Phys. J. C65 (2010) 111–125, arXiv:0911.5430 [hep-ex].
[3] CDF Collaboration, T. Aaltonen et al., Measurement of Particle Production and Inclusive Differential Cross Sections in p¯p Collisions at √
s = 1.96 TeV, Phys. Rev. D79 (2009) 112005, arXiv:0904.1098 [hep-ex].
[4] E735 Collaboration, T. Alexopoulos et al., Multiplicity dependence of transverse momentum spectra of centrally produced hadrons in ¯pp collisions at 0.3 TeV, 0.54 TeV, 0.9 TeV, and 1.8 TeV center-of-mass energy, Phys. Lett. B336 (1994) 599–604.
[5] UA1 Collaboration, C. Albajar et al., √ A Study of the General Characteristics of p¯p Collisions at
s = 0.2 TeV to 0.9 TeV , Nucl. Phys. B335 (1990) 261.
[6] CDF Collaboration, F. Abe et al., Pseudorapidity distributions of charged particles produced in ¯pp interactions at √
s = 630 GeV and 1800 GeV, Phys. Rev. D41 (1990) 2330.
[7] UA5 Collaboration, R. E. Ansorge et al., Charged particle multiplicity distributions at 200 and 900 GeV c.m. energy, Z. Phys. C43 (1989) 357.
[8] UA5 Collaboration, R. E. Ansorge et al., Charged particle correlations in p¯p collisions at c.m.
energies of 200, 546, and 900 GeV, Z. Phys. C37 (1988) 191–213.
[9] CDF Collaboration, F. Abe et al., Transverse momentum distributions of charged particles produced in ¯pp interactions at √
s = 630 GeV and 1800 GeV, Phys. Rev. Lett. 61 (1988) 1819.
[10] UA5 Collaboration, G. J. Alner et al., UA5: A general study of proton-antiproton physics at √ s = 546 GeV, Phys. Rept. 154 (1987) 247–383.
[11] UA5 Collaboration, R. E. Ansorge et al., Diffraction dissociation at the CERN pulsed p¯p collider at c.m. energies of 900 and 200 GeV, Z. Phys. C33 (1986) 175.
[12] ABCDHW Collaboration, A. Breakstone et al., Charged Multiplicity Distribution in pp Interactions at ISR Energies, Phys. Rev. D30 (1984) 528.
[13] UA1 Collaboration, G. Arnison et al., Transverse Momentum Spectra for Charged Particles at the CERN Proton anti-Proton Collider, Phys. Lett. B118 (1982) 167.
[14] The ATLAS Collaboration, Charged-particle multiplicities in pp interactions at √
s = 900 GeV measured with the ATLAS detector at the LHC, Phys Lett B 688, Issue 1 (2010) 21–42.
CERN-PH-EP/2010-004.
[15] The ATLAS Collaboration, Charged Particle Multiplicities in pp interactions at √
s = 7 TeV measured with the ATLAS detector at the LHC, ATLAS-CONF-2010-024.
[16] The ATLAS Collaboration, The ATLAS Experiment at the CERN Large Hadron Collider, JINST 3 S08003 (2008) .
[17] T. Cornelissen et al., Concepts, Design and Implementation of the ATLAS New Tracking (NEWT), . ATL-SOFT-PUB-2007-002.
[18] G. D’Agostini, A Multidimensional unfolding method based on Bayes’ theorem, Nucl. Instr. Meth.
A362 (1995) 487–498.
[19] The ATLAS Collaboration, Study of the Material Budget in the ATLAS Inner Detector with K
s0in 900 GeV Collision Data, ATL-CONF-2010-019.
[20] The ATLAS Collaboration, Charged particle multiplicities in pp interactions at √
s = 0.9 and 7 TeV in a diffractive limited phase space measured with the ATLAS detector at the LHC and a new PYTHIA6 tune, ATLAS-CONF-2010-031.
[21] The ATLAS Collaboration, Charged Particle Multiplicities in pp interactions with a lowered p
Tthreshold at √
s = 900 GeV and 7 TeV measured with the ATLAS detector at the LHC,
ATL-CONF-2010-046.
A Validation at √
s = 900 GeV
Figure 12 compares the charged particle multiplicities as a function of the pseudorapidity obtained with both methods at √
s = 900 GeV to the published results; the agreement is within 1%. The result for the
ID track method were obtained for the periods where the SCT was in standby and thus uses fewer bins
than the published data to minimise statistical fluctuations. The result of the pixel track method uses the
full reference run, because it is independent of the SCT detector conditions.
chn/dev N d⋅evN1/
0.05 0.1 0.15
≥ 1 nch
| < 2.5, > 500 MeV, | η pT
Data 2009
PYTHIA ATLAS AMBT1 PYTHIA ATLAS MC09 PYTHIA DW PYTHIA Perugia0 PHOJET ATLASPreliminary
= 2.36 TeV s
nch
2 4 6 8 10 12 14 16 18 20
Ratio
0.6 0.8 1 1.2 1.4
Data Uncertainties MC / Data
nch
2 4 6 8 10 12 14 16 18 20
Ratio
0.6 0.8 1 1.2 1.4
(a) Linear Scale
chn/dev N d⋅evN1/
10-3
10-2
10-1
≥ 1 nch
| < 2.5, > 500 MeV, | η pT
Data 2009
PYTHIA ATLAS AMBT1 PYTHIA ATLAS MC09 PYTHIA DW PYTHIA Perugia0 PHOJET
ATLASPreliminary = 2.36 TeV s
chn/dev N d⋅evN1/
10-3
10-2
10-1
nch
5 10 15 20 25 30 35
Ratio
0 0.2 0.4 0.6 0.8 1 1.2 1.4
Data Uncertainties MC / Data
(b) Logarithmic Scale η / dchN d⋅evN1/
1 1.2 1.4 1.6 1.8 2
≥ 1 nch
| < 2.5, > 500 MeV, | η pT
Data 2009
PYTHIA ATLAS AMBT1 PYTHIA ATLAS MC09 PYTHIA DW PYTHIA Perugia0 PHOJET
ATLASPreliminary = 2.36 TeV s
η / dchN d⋅evN1/
1 1.2 1.4 1.6 1.8 2
η -2.5 -2 -1.5 -1 -0.5 0 0.5 1 1.5 2 2.5
Ratio
0.7 0.8 0.9 1 1.1
1.2 Data Uncertainties MC / Data
η -2.5 -2 -1.5 -1 -0.5 0 0.5 1 1.5 2 2.5
Ratio
0.7 0.8 0.9 1 1.1 1.2
(c)
]-2 [ GeV Tp dη/dchN2) d Tpπ 1/(2evN1/
10-10
10-9
10-8
10-7
10-6
10-5
10-4
10-3
10-2
10-1
1 10
≥ 1 nch
| < 2.5, > 500 MeV, | η pT
Data 2009
PYTHIA ATLAS AMBT1 PYTHIA ATLAS MC09 PYTHIA DW PYTHIA Perugia0 PHOJET ]-2 [ GeV Tp dη/dchN2) d Tpπ 1/(2evN1/
10-10
10-9
10-8
10-7
10-6
10-5
10-4
10-3
10-2
10-1
1 10
ATLASPreliminary = 2.36 TeV s
[GeV]
pT
1 10
Ratio
0.5 1 1.5
2 Data Uncertainties MC / Data
[GeV]
pT
1 10
Ratio
0.5 1 1.5 2
(d)
Figure 8: Distribution of the charged particle multiplicity (a,b), the multiplicity as a function of the pseudorapidity at √
s = 2.36 TeV (c) and the charged particle multiplicity as a function of the transverse momentum (d) compared to the predictions from various Monte Carlo tunes. The charged particle multi- plicity and the multiplicity as a function of the pseudorapidity is measured using the pixel track method.
The charged particle multiplicity as a function of the transverse momentum is measured using the ID
track method. The error bars indicate the statistical uncertainty and the green bands denote the quadratic
sum of the statistical and systematic uncertainty on the measured data points.
η
-3 -2 -1 0 1 2 3
η / dchN d⋅evN1/
0 0.5 1 1.5 2 2.5 3
= 7 TeV s
= 2.36 TeV s
= 900GeV ATLASPreliminary s
Data 2009/2010
(a)
[GeV]
pT
1 10
]-2 [ GeV Tpdη/dchN2)d Tpπ 1/(2evN1/
10-8
10-7
10-6
10-5
10-4
10-3
10-2
10-1
1 10
= 7 TeV s
= 2.36 TeV s
= 900GeV s
ATLASPreliminary Data 2009/2010
(b)
Figure 9: The charged particle pseudorapidity and transverse momentum density for different centre of mass energies. The coloured bands denote the quadratic sum of the statistical and systematic uncertainty on each measurement. The charged particle multiplicity is measured using the pixel track method and the charged particle multiplicity as a function of the transverse momentum is measured using the ID track method.
nch
2 4 6 8 10 12 14 16 18 20
chn/devN d⋅ evN1/
0.02 0.04 0.06 0.08 0.1 0.12
0.14 s = 7 TeV
= 2.36 TeV s
= 900GeV s
ATLASPreliminary Data 2009/2010
(a)
nch
1 10
chn/devN d⋅ evN1/
10-4
10-3
10-2
10-1
1 s = 7 TeV
= 2.36 TeV s
= 900GeV s
ATLASPreliminary Data 2009/2010
(b)
Figure 10: The charged particle multiplicity for different centre of mass energies measured using the
pixel track method. The coloured bands denote the systematic uncertainty on each measurement.
[GeV]
s
10 3 10 4
η / d ch N d ⋅ ev N 1/
0 1 2 3 4 5 6
≥ 2 n
ch= 0, η
> 10 0 M eV , p
T≥ 1 n
ch= 0, η > 50 0 Me V, p
TATLAS Preliminary
PYTHIA ATLAS AMBT1 PYTHIA ATLAS MC09 PYTHIA ATLAS MC09c PYTHIA Perugia0 PYTHIA DW PYTHIA 8 PHOJET Data
Figure 11: Comparison of the ATLAS charged particle multiplicity measurements as a function of the centre of mass energy to different Monte Carlo tunes. The result at √
s = 2.36 TeV is measured using the
pixel track method. The results from the charged particle multiplicity measurement with a p
Tthreshold
of 100 MeV from [21] are also shown.
η
-2.5 -2 -1.5 -1 -0.5 0 0.5 1 1.5 2 2.5
η / d
chN d ⋅
evN 1 /
1 1.1 1.2 1.3 1.4 1.5
Published Track Method Pixel Track Method ATLAS Preliminary
= 900 GeV s
Data 2009