ATLAS-CONF-2010-073 28/07/2010
ATLAS NOTE
ATLAS-CONF-2010-073
July 28, 2010
Observation of inclusive electrons in the ATLAS experiment at √
s = 7 TeV
The ATLAS Collaboration
Abstract
This note presents the first observation of inclusive electrons in the collision data col- lected by the ATLAS experiment at
√s
=7 TeV, corresponding to a total integrated lu-
minosity of 13.8
±1.5 nb
−1. From a sample of 67124 selected electron candidates with
transverse energy above 7 GeV, a signal of 9920
±160 (stat.)
±990 (syst.) electrons,
predominantly from heavy flavour production (semi-leptonic decays of charm and beauty
hadrons), is extracted using a combination of particle identification techniques to determine
the dominant hadron and conversion background contributions from data. This signal is
compared to expectations from parton shower leading-order Monte Carlo simulations.
1 Introduction
A precise measurement of inclusive electron production at the LHC could lead to quantitative compar- isons with theory for the production of charm and beauty hadrons. It is also required to understand the basic processes which will be the main sources of backgrounds to measurements and searches involving one electron with high transverse energy E
Tin the final state, in particular the observation and early mea- surements of W
→eν decays [1] and, at a somewhat later stage, of semi-leptonic decays of top quarks and possible signals from decays of supersymmetric particles.
The electron reconstruction and identification algorithms used in ATLAS are designed to achieve both a large background rejection and a high and uniform efficiency for isolated electrons over the full acceptance of the detector, for transverse energies above 20 GeV. These electrons need to be separated from hadrons in QCD jets and from secondary electrons originating mostly from photon conversions in the tracker material.
At a centre-of-mass energy of 7 TeV, it is expected that inclusive electron candidates passing tight identification criteria and with transverse energy above 20 GeV will consist predominantly, i.e. at the level of 75% of the candidates, of electrons from heavy flavour and W
/Z decays into electrons, and ofapproximately equal fractions of hadron fakes and of electrons from photon conversions. In contrast, at lower values of p
T, it is expected that inclusive electrons with transverse energy above 8 GeV will consist of similar fractions of electrons from heavy flavour decays from beauty and charm hadrons, of hadron fakes and of electrons from photon conversions [2, 3]. Section 2 of this note gives a brief overview of the standard electron reconstruction and identification algorithms and how they are configured for the specific needs of the analysis presented here.
Based on an integrated luminosity of 13.8
±1.5 nb
−1obtained with stable beams and very loose electron trigger requirements, the properties of a total of 67124 electron candidates with E
T >7 GeV and
|η|<2.0 passing an optimised set of identification cuts are presented in Section 3. Specifically, this section compares the observed and predicted distributions of some of the electromagnetic calorimeter and tracker observables and of the match between them. In the case of the simulation, which is obtained from a filtered sample of 30 million non-diffractive minimum bias events, the predicted background is broken down into its different components. The inclusive electron signal consists of more than 99% of non-isolated electrons from charm and beauty hadron decays, but a small fraction of isolated electrons from Drell-Yan continuum production and from W
/Z-boson production are also present in the data. Forsimplicity, the signal electrons will be called prompt electrons throughout the rest of this note, regardless of their real origin.
Section 4 discusses the matrix method, which is used for the extraction of the prompt electron signal from the data. This method is more sophisticated than cut-based methods which are not sufficient to extract an inclusive electron spectrum with sufficient purity. It uses the particle identification features of the ATLAS detector to their full capacity to predict from the data not only the yields but also the kinematic properties and the shapes of the identification variables for the hadron fakes (using the particle identification in the transition radiation tracker), the electrons from photon conversions in the inner de- tector material (using the presence or not of hits in the innermost layer of the pixel detector, also called the B-layer), and the prompt electrons, which for the identification criteria used in this note compose about 10% of the total sample.
Finally, Section 4 describes the determination of the systematic uncertainties on the extracted prompt
electron signal and compares the observed spectrum for the signal with that predicted from leading-
order simulation of heavy flavour production obtained from the
Pythia6.4 event generator [4]. It is
important to note that there could be large differences between data and Monte Carlo, both in terms of
rates and shapes of the different contributions discussed above, due to physics or to biases in the selection
efficiency and rejection, which are not within the scope of this note.
2 Electron reconstruction and identification
2.1 Electron reconstruction
The ATLAS inner detector provides precise track reconstruction over
|η|<2.5 [5]. It consists of three layers of pixel detectors close to the beam-pipe, several layers (four in the barrel and nine in the end-caps) of silicon microstrip detectors (SCT) providing eight hits per track at intermediate radii, and a transition radiation tracker (TRT) at the outer radii, providing about 35 hits per track in the range
|η|<2.0. The TRT also provides substantial discriminating power between electrons and pions over a wide energy range between 0.5 and 100 GeV. The pixel innermost layer is located just outside the beam-pipe at a radius of 50 mm, and provides precision vertexing and significant rejection of photon conversions through the requirement of a track with a hit in this layer.
The ATLAS electromagnetic (EM) calorimeter has a fine segmentation in both the lateral (η
× φspace) and longitudinal direction of the shower development for
|η|<2.5 [6]. At high energy, most of the EM shower energy is collected in the middle layer which has a lateral granularity of 0.025
×0.025 in
η×φspace. The first layer consists of finer-grained strips in the
η-direction (with a coarser granularityin
φ), which offer excellentγ −π0discrimination. These two layers are complemented by a presampler layer, placed in front and covering only the range
|η|<1.8, with coarse granularity to correct for energy lost in the material before the calorimeter, and by a back layer behind, which enables a correction to be made for the tail of high-energy EM showers.
The transition region between the barrel and end-cap EM calorimeters, 1.37
<|η|<1.52, is expected to have poorer performance than the fiducial regions used in the analysis presented here because of the large amount of material in front of the first active calorimeter layers. Each end-cap EM calorimeter is divided into two wheels; only the outer wheel covering the range 1.375
<|η|<2.5 is considered here.
Electron reconstruction begins with the creation of a preliminary set of clusters in the EM calorimeter.
The size of these seed clusters corresponds to 3
×5 cells in
η×φin the middle layer of the EM calorime- ter. Electron reconstruction is seeded from such clusters with E
T >2.5 GeV, using a sliding window algorithm over the full acceptance of the EM calorimeter.
Electrons are reconstructed from the sliding window clusters if there is a suitable match with a track of p
T>0.5 GeV. The chosen track is the one lying with an extrapolation closest in (
η,φ) to the cluster barycentre in the middle EM calorimeter layer. For the barrel EM calorimeter, the optimal cluster size for electron candidates is 3
×7 cells in
η×φ, whereas it is 5
×5 cells for the end-cap EM calorimeters.
The cluster energy is determined by computing and summing four different contributions: the energy deposited in the material in front of the EM calorimeter (including the energy between the cold calorime- ter wall and the first accordion compartment), that deposited in the calorimeter inside the cluster, that deposited outside the cluster (lateral leakage) and the energy deposited beyond the EM calorimeter (lon- gitudinal leakage). The corrections applied to the measured cluster energy are based on precise Monte Carlo simulations validated by comprehensive test-beam measurements [2].
2.2 Electron identification
The baseline electron identification algorithm in ATLAS relies on variables which deliver good separa-
tion between isolated electrons and fake signatures from QCD jets. These variables include information
from the calorimeter, the tracker, and the matching between tracker and calorimeter. Three reference
sets of cuts have been defined for electrons: preselection, medium and tight, as listed in Table 1. These
cuts are different in several important respects from the reference identification cuts with the same labels
quoted in Ref. [2] because of the need to optimise them for this analysis, where the signal consists of
non-isolated prompt electrons from decays of charm and beauty hadrons rather than isolated electrons
from decays of W
/Z bosons. The cut values are optimised in bins of ETand
η.
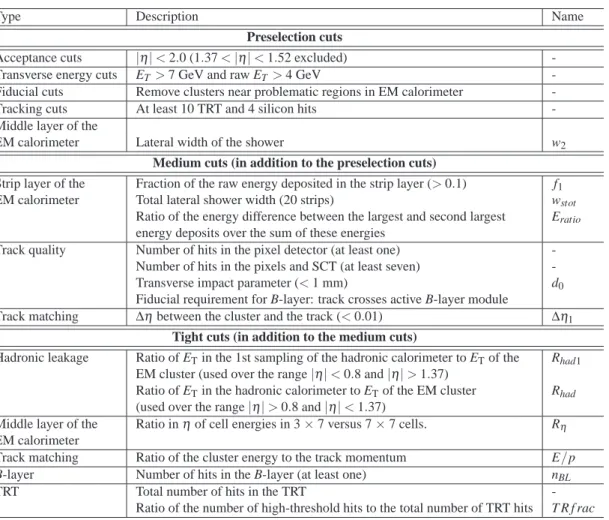
Table 1:
Definition of variables used for all electron identification cuts. The cut values are also given in the cases where a fixed cut is used, independent of ETand|η|.Type Description Name
Preselection cuts
Acceptance cuts |η|<2.0 (1.37<|η|<1.52 excluded) -
Transverse energy cuts ET>7 GeV and raw ET>4 GeV -
Fiducial cuts Remove clusters near problematic regions in EM calorimeter -
Tracking cuts At least 10 TRT and 4 silicon hits -
Middle layer of the
EM calorimeter Lateral width of the shower w2
Medium cuts (in addition to the preselection cuts)
Strip layer of the Fraction of the raw energy deposited in the strip layer (>0.1) f1
EM calorimeter Total lateral shower width (20 strips) wstot
Ratio of the energy difference between the largest and second largest Eratio
energy deposits over the sum of these energies
Track quality Number of hits in the pixel detector (at least one) - Number of hits in the pixels and SCT (at least seven) -
Transverse impact parameter (<1 mm) d0
Fiducial requirement for B-layer: track crosses active B-layer module
Track matching ∆ηbetween the cluster and the track (<0.01) ∆η1
Tight cuts (in addition to the medium cuts)
Hadronic leakage Ratio of ETin the 1st sampling of the hadronic calorimeter to ETof the Rhad1
EM cluster (used over the range|η|<0.8 and|η|>1.37)
Ratio of ETin the hadronic calorimeter to ETof the EM cluster Rhad
(used over the range|η|>0.8 and|η|<1.37)
Middle layer of the Ratio inηof cell energies in 3×7 versus 7×7 cells. Rη EM calorimeter
Track matching Ratio of the cluster energy to the track momentum E/p
B-layer Number of hits in the B-layer (at least one) nBL
TRT Total number of hits in the TRT -
Ratio of the number of high-threshold hits to the total number of TRT hits T R f rac
The preselection requires that the electron candidates lie within the pseudorapidity coverage of the TRT,
|η|<2.0, and outside the transition region between barrel and end-cap calorimeters, 1.37
<|η|<
1.52. Only reconstructed electron candidates with a raw cluster transverse energy above 4 GeV and a calibrated offline cluster transverse energy above 7 GeV are considered: this choice is the result of a balance between the high statistics required for the analysis and the requirement of a high and uniform trigger efficiency (see Section 3.1). The preselected electrons are also required to be associated to tracks containing at least ten TRT hits and four silicon hits. Clusters with their barycentre close to specific problematic regions in the EM calorimeter are rejected, corresponding to a geometrical loss of approxi- mately 5% over the pseudorapidity range considered here. Finally, a requirement on the lateral width of the shower as measured in the middle calorimeter layer (see Table 1) is applied.
Preselected electron candidates can be selected further using the medium identification criteria, which consist of requirements on their energy deposits in the strip layer of the EM calorimeter and on the track quality and track-cluster matching. The medium selection will be used in Section 4 as the starting point for extracting the prompt electron signal from the background.
The tight electron requirements are explicitly optimised to exploit the full potential of the ATLAS
electron identification. The ratio between measured cluster energy and track momentum, E/ p, and
the fraction of high-threshold hits in the TRT specifically reject charged hadrons, while requiring the
presence of a hit on the track in the pixel B-layer rejects background electrons from photon conversions.
For robustness, the cut choices, including thresholds, are based on the current level of understanding of the detector performance, as obtained from simulation for high-energy electrons and from analysis of the low-p
Telectron candidates using the data collected at
√s
=0.9 TeV at the end of 2009 [2]. A more detailed description of the identification cuts can also be found in ref. [2]. As can be seen from Table 1, the tight cuts applied in this note also incorporate hadronic leakage and shower-shape cuts which are normally applied at an earlier stage in the electron identification cuts. The motivation for applying these cuts at a much later stage in the analysis arises from the expectation that they are much less efficient for non-isolated electrons from heavy flavours than for isolated electrons from W
/Z-boson decay, asdiscussed in Section 4.5.
The expected efficiencies, as predicted from simulation, for the preselection, medium and tight cuts are:
• respectively 88%, 81% and 69% for isolated electrons from Z
→ee decays with E
T>20 GeV;
• respectively 64%, 55% and 38% for non-isolated electrons with E
T>7 GeV from semi-leptonic decays of charm and beauty hadrons.
3 Selection and properties of inclusive electron candidates
3.1 Analysis samples and trigger selection The analysis is based on a data sample collected at
√s
=7 TeV during the first months of 2010. Events were selected for which the tracker, EM and hadronic calorimeters recorded data with high quality and the solenoidal field was at its nominal value. The obtained data sample corresponds to an integrated luminosity of 13.8
±1.5 nb
−1. The Monte Carlo event sample used throughout this note originates from a total sample of 5.6
×10
8non-diffractive minimum-bias events generated with
Pythia, using the ATLASMC09 tune [7]. A subset of 30 million of these events, obtained after filtering for total transverse energy from generated particles (except muons and neutrinos) greater than 6 GeV in an area of 0.4
×0.4 in
η×φspace, has been passed through the full ATLAS simulation and reconstruction software, including the trigger. Monte Carlo samples of electrons from semi-leptonic decays of charm and beauty hadrons were also used in the analysis and are described in more detail in Section 4.5.
All events were required to contain at least one reconstructed primary vertex with at least three reconstructed tracks. The efficiency of this requirement for events containing at least one preselected electron candidate was found to be very close to 100% in the data and Monte Carlo samples.
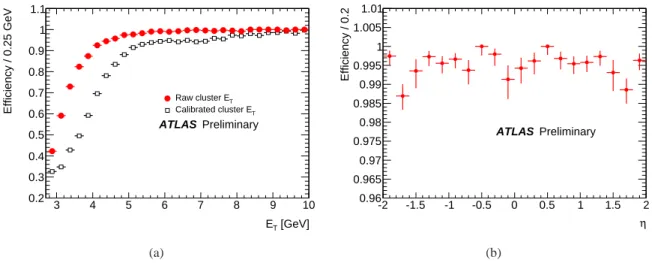
For a fraction of the data presented here, all events satisfying the minimum-bias trigger described in ref. [8] were recorded and the efficiency of this trigger was verified to be 100% for non-diffractive events. For approximately 98% of the data sample, the first level (L1) EM calorimeter trigger was used with its lowest possible transverse energy threshold setting of 3 GeV. This trigger was measured from the minimum-bias triggered events to have an efficiency of 99.5% for events with a least one electron candidate with a raw cluster transverse energy above 4 GeV and a calibrated offline cluster transverse energy above 7 GeV. Figure 1(a) shows the measured L1 turn-on curve for this trigger, as a function of both the raw and calibrated offline transverse energies of reconstructed electron candidates passing the preselection cuts. In contrast, Fig. 1(b) shows the L1 trigger efficiency as a function of pseudorapidity for the electron candidates passing the transverse energy threshold cuts quoted above, which clearly remove almost all the bias in trigger response at low transverse energies.
3.2 Composition of selected samples
The numbers and fractions of candidates passing each level of selection are shown for the data and
compared to the Monte Carlo predictions in Table 2. The selection cuts are not optimised for the low-
[GeV]
ET
3 4 5 6 7 8 9 10
Efficiency / 0.25 GeV
0.2 0.3 0.4 0.5 0.6 0.7 0.8 0.9 1 1.1
Raw cluster ET
Calibrated cluster ET
ATLAS Preliminary
(a)
η
-2 -1.5 -1 -0.5 0 0.5 1 1.5 2
Efficiency / 0.2
0.96 0.965 0.97 0.975 0.98 0.985 0.99 0.995 1 1.005 1.01
ATLAS Preliminary
(b)
Figure 1:
Measured efficiencies for the L1 EM trigger at its nominal threshold of 3 GeV transverse energy as a function of the raw and calibrated cluster transverse energies for electron candidates passing the preselection criteria (a) and as a function of pseudorapidity (b). In the latter plot, the calibrated cluster transverse energy is required in addition to be above 7 GeV and the raw cluster transverse energy to be above 4 GeV.Table 2:
Numbers of electron candidates in the data and Monte Carlo samples selected according to the various levels of identification cuts. The percentages of identified medium and tight candidates with respect to the prese- lected candidates in data are also given and compared to those predicted by Monte Carlo simulation. The errors indicated are purely statistical. The Monte Carlo sample does not correspond to the same integrated luminosity as the data.Sample Preselected Medium Tight
candidates Candidates Fraction (%) Candidates Fraction (%)
Data 410175 67124 16.36
±0.06 8024 1.96
±0.02
Monte Carlo 824988 138007 16.73
±0.04 15754 1.91
±0.02
energy electron candidates considered here. The agreement between the fractions of electron candidates passing the cuts at each level between data and Monte Carlo indicates that the simulation describes the data reasonably well at each level of identification cuts applied.
The Monte Carlo sample can be sub-divided into its three dominant components: hadrons, secondary electrons, and prompt electrons from semi-leptonic decays of charm and beauty hadrons, as shown in Table 3. The hadron component is expected to dominate the spectrum even for medium identification cuts. The secondary electron component corresponds to
∼20% of all the electron candidates and is largely dominated by electrons from photon conversions, but also includes a small component (
∼3%) of secondary electrons from other sources, such as Dalitz decays. The prompt electron fraction increases from
∼2% for the preselection cuts, to
∼10% for medium cuts, and is expected to reach 60% after the tight cuts which have been specifically optimised to reject the other two components, as described in Section 2.
In the rest of this section, distributions will be compared between data and simulation for all prese-
lected candidates passing the medium identification cuts, unless specified otherwise. The Monte Carlo
distributions are always normalised to the same number of electron candidates passing the medium iden-
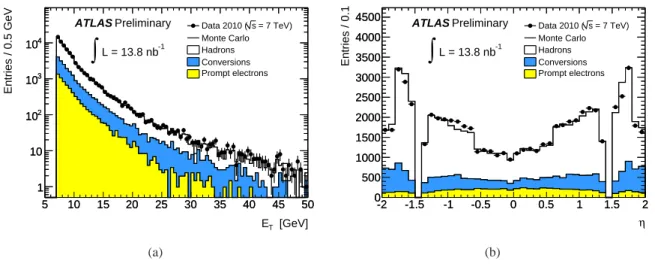
tification criteria as in the data. Figure 2 displays the transverse energy and pseudorapidity spectra for
these electron candidates. Both Table 2 and Fig. 2 show agreement between data and simulation, given
[GeV]
ET
5 10 15 20 25 30 35 40 45 50
Entries / 0.5 GeV
1 10 102
103
104
5 10 15 20 25 30 35 40 45 50
1 10 102
103
104
= 7 TeV) s Data 2010 ( Monte Carlo Hadrons Conversions Prompt electrons
ATLAS Preliminary L = 13.8 nb-1
∫
(a)
η
-2 -1.5 -1 -0.5 0 0.5 1 1.5 2
Entries / 0.1
0 500 1000 1500 2000 2500 3000 3500 4000 4500
-2 -1.5 -1 -0.5 0 0.5 1 1.5 2
0 500 1000 1500 2000 2500 3000 3500 4000 4500
= 7 TeV) s Data 2010 ( Monte Carlo Hadrons Conversions Prompt electrons
ATLAS Preliminary L = 13.8 nb-1
∫
(b)
Figure 2:
Distributions of cluster transverse energy ET(left), and pseudorapidityη(right), for electron candidates passing the medium identification cuts.Table 3:
Breakdown of electron candidates in the Monte Carlo simulation according to their origin and to the identification cuts applied. The prompt electrons comprise mostly non-isolated electrons from charm and beauty hadron decay in this low-energy range and only a very small fraction of them are expected to be isolated electrons from W/Z-boson decay. The errors indicated are purely statistical.Preselected Medium Tight
Hadrons (%) 78.4
±0.1 69.6
±0.1 17.5
±0.3
Secondary electrons (conversions) (%) 19.7
±0.1 20.2
±0.2 23.4
±0.3 Prompt electrons (%) 1.9
±0.1 10.1
±0.1 59.0
±0.4
the large uncertainties expected in the rather low-energy kinematic regime considered here.
3.3 Identification variables: comparison between data and Monte Carlo
In this section, various calorimeter variables are illustrated for the selected electron candidates. Figure 3 illustrates the longitudinal development of the shower in the layers of the EM calorimeter, based on the measured layer energies before cluster corrections are applied. For the electron candidates passing the medium identification cuts, most of which have transverse energies below 15 GeV and correspond predominantly to hadrons, more than half of the total energy is deposited on average in the middle layer, a third in the strip layer, and less than 10% in the presampler. A small amount is also deposited in the back layer. Some of the distributions in Fig. 3 show small correlated discrepancies between data and simulation (large values of f
0and small values of f
2) which are irrelevant for the analysis described here and are discussed in more detail elsewhere [2].
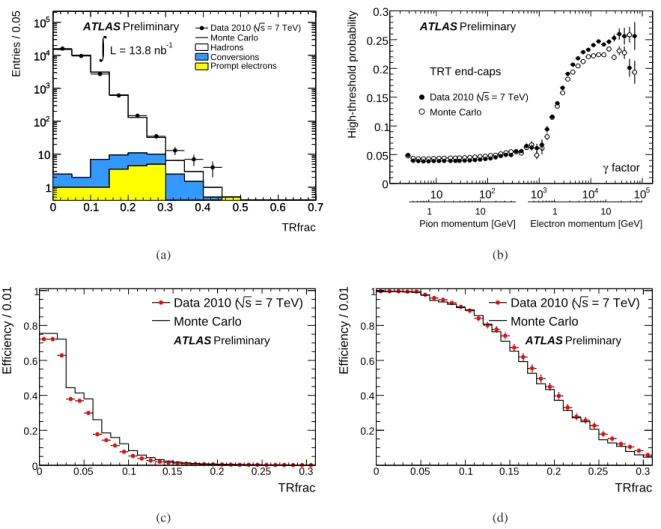
Electron reconstruction and identification also rely heavily on tracking performance. Figure 4 shows
four of the tracking variables compared between data and simulation for the selected electron candi-
dates. The agreement between data and simulation is reasonable for all four distributions, despite the
complexity of the detector response expected at these low energies due to material effects and track re-
construction inefficiencies. Figures 4(a) and 4(b) show the number of hits on the reconstructed tracks
in the pixel B-layer and the ratio between the high-threshold hits and all TRT hits, respectively. As ex-
pected, a large fraction of the electrons from conversions in the simulation correspond to tracks with no
f0
0 0.1 0.2 0.3 0.4 0.5 0.6 0.7 0.8 0.9 1
Entries / 0.025
1 10 102
103
104
105
0 0.1 0.2 0.3 0.4 0.5 0.6 0.7 0.8 0.9 1 1
10 102
103
104
105 Data 2010 (s = 7 TeV)
Monte Carlo Hadrons Conversions Prompt electrons
ATLAS Preliminary L = 13.8 nb-1
∫
(a)
f1
0 0.1 0.2 0.3 0.4 0.5 0.6 0.7 0.8 0.9 1
Entries / 0.025
1 10 102
103
104
105
0 0.1 0.2 0.3 0.4 0.5 0.6 0.7 0.8 0.9 1 1
10 102
103
104
105 Data 2010 (s = 7 TeV)
Monte Carlo Hadrons Conversions Prompt electrons
ATLAS Preliminary L = 13.8 nb-1
∫
(b)
f2
0 0.1 0.2 0.3 0.4 0.5 0.6 0.7 0.8 0.9 1
Entries / 0.025
1 10 102
103
104
105
0 0.1 0.2 0.3 0.4 0.5 0.6 0.7 0.8 0.9 1 1
10 102
103
104
105
= 7 TeV) s Data 2010 ( Monte Carlo Hadrons Conversions Prompt electrons
ATLAS Preliminary L = 13.8 nb-1
∫
(c)
f3
0 0.1 0.2 0.3 0.4 0.5 0.6 0.7 0.8 0.9 1
Entries / 0.025
1 10 102
103
104
105
0 0.1 0.2 0.3 0.4 0.5 0.6 0.7 0.8 0.9 1 1
10 102
103
104
105
= 7 TeV) s Data 2010 ( Monte Carlo Hadrons Conversions Prompt electrons
ATLAS Preliminary L = 13.8 nb-1
∫
(d)
Figure 3:
For selected electron candidates, fraction of cluster energy observed in each layer of the electromagnetic calorimeter for data and simulation. These fractions are labelled as f0for the presampler layer (a), f1for the first (strip) layer (b), f2for the middle layer (c) and f3for the back layer (d). The distribution of f1is shown before applying the cut requiring f1>0.1.hits in the B-layer and with a large ratio of high-threshold hits in the TRT detector.
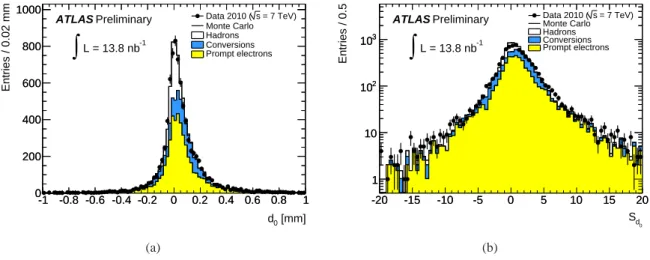
Figure 4(c) shows the distribution of the transverse impact parameter, d
0, of the electron track with respect to the reconstructed primary vertex position in the transverse plane before applying the cut re- quired for the medium selection (
|d
0|<1 mm): whereas the hadrons in the simulation display a distri- bution peaked around zero with a resolution of
∼100 µm, the electrons from conversions have large impact parameters, which is to be expected for the conversions occurring at large radii.
Figure 4(d) shows the distribution of the ratio, E/ p, of cluster energy in the calorimeter to track mo-
mentum for all electron candidates and for data and simulation. The simulation shows that the expected
peak from the electron component lies slightly above unity, with a tail toward high values of E
/p frombremsstrahlung losses in the tracker material. The peak shift and the extent of the high tail are not en-
tirely due to bremsstrahlung losses, however: an additional contribution arises from an overestimate of
the cluster energy, in the cases where it includes energy from nearby particles. The hadron component
peaks at values somewhat below but close to unity: this is due to the fact that hadrons reconstructed as
electron candidates passing the medium identification cuts at these low energies are expected to deposit
most of their energy in the EM calorimeter, with an expected peak position around 0.6 because of the
nBL
0 0.5 1 1.5 2 2.5 3 3.5 4 4.5 5
Entries / 1.0
0 10000 20000 30000 40000 50000 60000
0 0.5 1 1.5 2 2.5 3 3.5 4 4.5 5 0
10000 20000 30000 40000 50000 60000
= 7 TeV) s Data 2010 ( Monte Carlo Hadrons Conversions Prompt electrons
ATLAS Preliminary
L = 13.8 nb-1
∫
(a)
TRfrac
0 0.1 0.2 0.3 0.4 0.5 0.6 0.7
Entries / 0.05
1 10 102
103
104
105
0 0.1 0.2 0.3 0.4 0.5 0.6 0.7
1 10 102
103
104
105
= 7 TeV) s Data 2010 ( Monte Carlo Hadrons Conversions Prompt electrons
ATLAS Preliminary L = 13.8 nb-1
∫
(b)
[mm]
d0
-5 -4 -3 -2 -1 0 1 2 3 4 5
Entries / 0.1
102
103
104
105
-5 -4 -3 -2 -1 0 1 2 3 4 5
102
103
104
105
= 7 TeV) s Data 2010 ( Monte Carlo Hadrons Conversions Prompt electrons
ATLAS Preliminary L = 13.8 nb-1
∫
(c)
E/p 0 0.5 1 1.5 2 2.5 3 3.5 4 4.5 5
Entries / 0.1
1 10 102
103
104
105
0 0.5 1 1.5 2 2.5 3 3.5 4 4.5 5 1
10 102
103
104
105 Data 2010 (s = 7 TeV)
Monte Carlo Hadrons Conversions Prompt electrons
ATLAS Preliminary L = 13.8 nb-1
∫
(d)
Figure 4:
Distributions of tracking variables for selected electron candidates compared between data and simula- tion. Shown are the number of hits, nBL, on the electron track in the pixel B-layer (a), the ratio, T R f rac, between the high-threshold hits and all TRT hits on the electron track (b), the transverse impact parameter, d0, with respect to the reconstructed primary vertex (c), and the ratio, E/p, between cluster energy and track momentum (d). The distribution of d0is shown for a looser cut,|d0|<5 mm, than the nominal one of 1 mm.non-compensating nature of the calorimeter. They are also accompanied by photons which enhance the quality of the reconstructed candidate and increase the measured value of E
/p. The agreement betweendata and Monte Carlo is not very good for this particular distribution. The reasons for this are not yet established, but could arise from a different mix of the various background components or a different distribution of energy deposits from particles accompanying the hadron. The direct extraction of the prompt electron signal will not rely on the Monte Carlo simulation of the E
/p ratio.3.4 Tight cuts: comparison between data and Monte Carlo
Figure 5 shows the kinematic properties compared to the Monte Carlo predictions for electron candidates
passing the tight selection criteria. One can note in particular the enhancement of the predicted hadron
contribution in the
η-range corresponding to the transition region between the barrel and end-cap TRT
and the dominance of the predicted conversion background at high
|η|, where the amount of material
in the inner detector is largest. At the high end of the E
T-spectrum, the signal expected from electrons
[GeV]
ET
5 10 15 20 25 30 35 40 45 50
Entries / 1.0 GeV
1 10 102
103
104
5 10 15 20 25 30 35 40 45 50
1 10 102
103
104 Data 2010 (s = 7 TeV)
Monte Carlo Hadrons Conversions Prompt electrons
ATLAS Preliminary L = 13.8 nb-1
∫
(a)
η
-2 -1.5 -1 -0.5 0 0.5 1 1.5 2
Entries / 0.1
0 50 100 150 200 250 300 350 400 450
-2 -1.5 -1 -0.5 0 0.5 1 1.5 2
0 50 100 150 200 250 300 350 400
450 Data 2010 (s = 7 TeV)
Monte Carlo Hadrons Conversions Prompt electrons
ATLAS Preliminary L= 13.8 nb-1
∫
(b)
Figure 5:
Distributions of cluster transverse energy ET (a) and pseudorapidityη (b), for electron candidates passing the tight identification cuts. The Monte Carlo sample used here does not contain any electrons fromW/Z-boson decay.
[mm]
d0
-1 -0.8 -0.6 -0.4 -0.2 0 0.2 0.4 0.6 0.8 1
Entries / 0.02 mm
0 200 400 600 800 1000
-1 -0.8 -0.6 -0.4 -0.2 0 0.2 0.4 0.6 0.8 1 0
200 400 600 800
1000 Data 2010 (s = 7 TeV)
Monte Carlo Hadrons Conversions Prompt electrons
ATLAS Preliminary L = 13.8 nb-1
∫
(a)
d0
S
-20 -15 -10 -5 0 5 10 15 20
Entries / 0.5
1 10 102
103
-20 -15 -10 -5 0 5 10 15 20
1 10 102
103
= 7 TeV) s Data 2010 ( Monte Carlo Hadrons Conversions Prompt electrons
ATLAS Preliminary L = 13.8 nb-1
∫
(b)
Figure 6:
Distributions of the signed impact parameter d0(a) and of its significance Sd0(b), for electron candidates passing the tight identification cuts.from W
/Z-boson decay is clearly visible above the contributions expected from all three componentsdiscussed in this note. Note that the Monte Carlo sample used for this comparison does not contain any electrons from W
/Z-boson decay.Figure 6 shows the distributions of the signed transverse impact parameter, d
0, and its significance, S
d0,
where the sign is defined with respect to the axis of the reconstructed jet corresponding to the electron,
for the electron candidates passing the tight identification criteria. Since a large fraction of these electron
candidates are electrons from charm and beauty hadron decays, one expects the tails at large positive
values of these distributions to be dominantly populated by them. However, the rather low energies of
the electrons and the presence of a significant residual background from conversions with large signed
impact parameter preclude firm quantitative conclusions based on these distributions at this stage. Ap-
plying further cuts using these impact parameter variables brings the predicted purity of the sample at
best to 80%. The conclusion is therefore that more sophisticated methods than a purely cut-based one are
appropriate to extract reliably the electron signal from charm and beauty hadron decays in the observed inclusive electron spectrum.
4 Extraction of prompt electron signal
4.1 Discriminating variables
As shown in Table 3, the sample of inclusive electron candidates is expected to be dominated, even after medium identification cuts, by hadrons, denoted hereafter h
→e, with a substantial contribution from secondary electrons from photon conversions in the tracker material, denoted hereafter
γ→e. At this stage, the expected contribution from prompt electrons from charm and beauty hadron decays, denoted hereafter Q
→e, has risen to an expected value of
∼10%. The goal of the analysis presented in this section is to determine separately each of the three components of the sample and to compare the results of these measurements to the predicted values from simulation.
After the medium selection, most of the EM calorimeter abilities to separate hadronic showers from non-isolated EM showers have been used. The main remaining rejection against the dominant hadron background can be obtained using the transition radiation produced in the TRT radiators which are in- terspersed with the measurement points. Additional rejection may be obtained by requiring the ratio of measured energy of the EM cluster to the track momentum, E/ p, to be close to unity, but this cut has not been used in this analysis.
In the following, the ratio, T R f rac, between the number of high-threshold hits and all hits measured on the track will be used to separate the hadron background from the two sources of true electrons which are expected to have the same response in the TRT when binned in momentum and pseudorapidity. The separation power obtained from this variable is illustrated qualitatively in Fig. 4(b), but the extraction of a small signal from prompt electrons in the data requires a good understanding of this ratio for hadrons and electrons. More details on the behaviour of T R f rac are therefore shown in Fig. 7, separately for samples of hadrons and electrons with high purity. This compares data and Monte Carlo for hadrons in Fig. 7(a), using a sample of approximately 30 thousand tracks which are predicted to contain only a very small fraction (well below 1%) of electrons. Much larger statistics samples using 250 million tracks also show that there are some significant deviations between data and Monte Carlo, e.g. for the integral distribution shown for a specific momentum and pseudorapidity bin in Fig. 7(c). The measured data distribution of T R f rac for hadrons after the medium identification cuts, as shown in Fig. 7(a), is therefore used in the following to extract the prompt electron signal.
In contrast, the agreement between data and Monte Carlo is reasonably good for a sample of electrons from photon conversions. This conversion electron sample is estimated to be 96% pure, and is obtained using a tag-and-probe technique on well reconstructed conversion vertices with the tag electron required to have a high value of T R f rac, while the probe electron is used to obtain the distributions shown in Figs. 7(b) and 7(d). In the following, the distribution of T R f rac for electrons is taken from Monte Carlo since the statistics available at present are lower in the data.
A second discriminating variable is required to separate the secondary electrons from photon conver- sions from the prompt electron signal once the dominant hadron background has been characterised. This separation relies on the presence or not of a hit in the B-layer on the track since most photon conversions occur beyond this layer, which has a very small fraction of the total tracker material in front of it. The distribution of the number of hits, n
BL, in the pixel B-layer is taken from the same pure data sample of hadrons as described above for T R f rac for hadrons, and from Monte Carlo for conversions and prompt electrons.
Tracks going through non-functional B-layer modules, corresponding to
∼2% of these modules,
are not considered in the analysis, as indicated in Table 1. The distribution of n
BLis almost purely
TRfrac
0 0.1 0.2 0.3 0.4 0.5 0.6 0.7
Entries / 0.05
1 10 102
103
104
105
0 0.1 0.2 0.3 0.4 0.5 0.6 0.7
1 10 102
103
104
105 Data 2010 (s = 7 TeV)
Monte Carlo Hadrons Conversions Prompt electrons
ATLAS Preliminary L = 13.8 nb-1
∫
(a)
factor γ
10 102 103 104 105
High-threshold probability
0 0.05 0.1 0.15 0.2 0.25 0.3
Pion momentum [GeV]
1 10
Electron momentum [GeV]
1 10
TRT end-caps = 7 TeV) s Data 2010 ( Monte Carlo ATLAS Preliminary
(b)
TRfrac
0 0.05 0.1 0.15 0.2 0.25 0.3
Efficiency / 0.01
0 0.2 0.4 0.6 0.8 1
= 7 TeV) s
Data 2010 ( Monte Carlo ATLAS Preliminary
(c)
TRfrac
0 0.05 0.1 0.15 0.2 0.25 0.3
Efficiency / 0.01
0.2 0.4 0.6 0.8 1
= 7 TeV) s
Data 2010 ( Monte Carlo
ATLAS Preliminary
(d)
Figure 7:
Comparison between data and Monte Carlo for the ratio, T R f rac, of high-threshold TRT hits over all TRT hits, as measured for tracks from hadrons and electrons. The distribution of this fraction, as measured in data and predicted by Monte Carlo, is shown (a) for the sample of hadron-enriched electron candidates passing the medium identification criteria except for the requirement on f1, which is reversed from f1>0.1 to f1<0.1.This sample is predicted to contain mostly pions and kaons and only a very small fraction below 1% of electrons from conversions. The probability per straw to measure a high-threshold hit is shown for samples of hadrons and of electrons from reconstructed photon conversion vertices in the end-cap TRT (1.1 < |η| < 1.7) as a function of the Lorentz γ-factor of the particle (b). For samples of charged hadron tracks (c) and pure electrons from reconstructed photon conversions (d), selected in the momentum range 2.5−5 GeV in the barrel TRT (|η| < 0.6), the fractions of tracks with T R f rac above a certain threshold as a function of this threshold is compared between data and Monte Carlo.
geometrical in the case of prompt tracks (h
→e and Q
→e components), since the efficiency of the pixel layers has been demonstrated to be very high using the data collected at the end of 2009 at
√s
=0.9 TeV [9].
In the case of electrons from photon conversions, the distribution of n
BLis driven by the relative
amount of material traversed by photons before reaching this layer compared to the total amount of
material in the active part of the inner detector in which photon conversions can be efficiently recon-
structed with at least four silicon hits on each track (radii below 45 cm). The uncertainty on this relative
amount is known to be small, not more than 5%, from detailed studies of track reconstruction efficiencies
in minimum-bias events [10]. The impact of this uncertainty on the measurement is discussed in Sec-
tion 4.4.
[GeV]
ET
8 10 12 14 16 18 20 22 24
Entries / 1.0 GeV
0 5000 10000 15000 20000
25000 h→ e
= 7 TeV) s Data 2010 ( Monte Carlo
ATLAS Preliminary 13.8 nb-1
≈
∫
L(a)
[GeV]
ET
8 10 12 14 16 18 20 22 24
Entries / 1.0 GeV
0 1000 2000 3000 4000 5000 6000
→ e γ
= 7 TeV) s Data 2010 ( Monte Carlo
ATLAS Preliminary 13.8 nb-1
≈
∫
L(b)
[GeV]
ET
8 10 12 14 16 18 20 22 24
Entries / 1.0 GeV
0 1000 2000 3000 4000
5000 Q→ e
= 7 TeV) s Data 2010 ( Monte Carlo
ATLAS Preliminary 13.8 nb-1
≈
∫
L(c)
[GeV]
ET
8 10 12 14 16 18 20 22 24
Entries / 1.0 GeV
0 5000 10000 15000 20000 25000 30000 35000
= 7 TeV) s Data 2010 ( Monte Carlo
ATLAS Preliminary 13.8 nb-1
≈
∫
L(d)
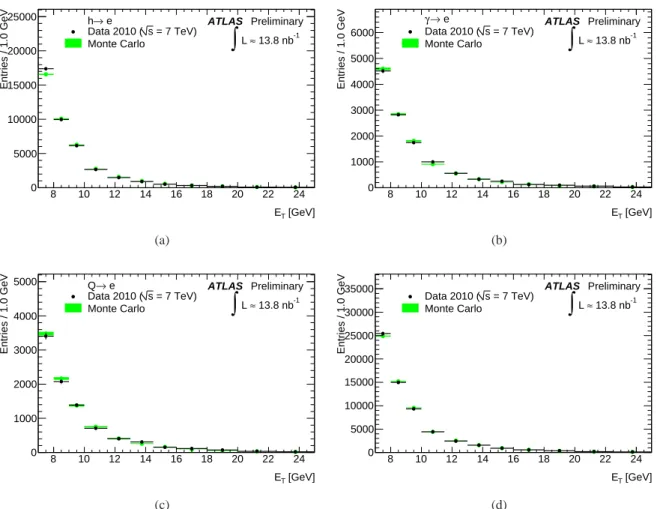
Figure 8:
Distributions of the transverse energy of the various components of the medium electron sample (a to c) and of their summed total (d), as extracted from data using the matrix method and as predicted from Monte Carlo.For each plot, the data and simulation have been normalised to the same number of electron candidates and the error bars are purely statistical.
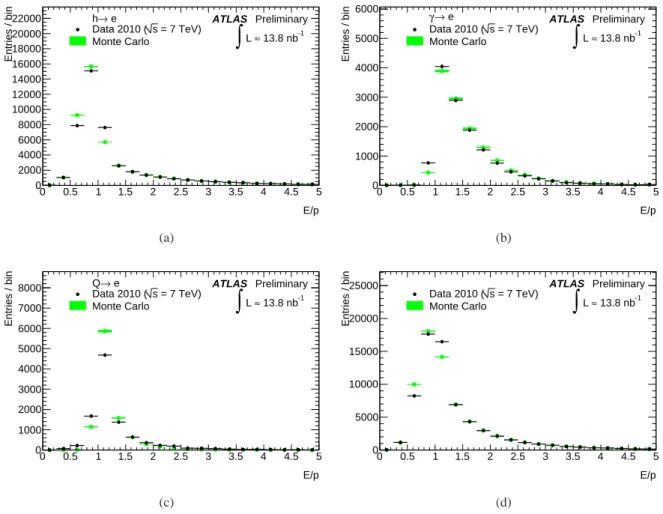
4.2 Matrix method
The baseline matrix method used in this analysis proceeds as follows to extract each of the three com- ponents to the inclusive electron sample, the h
→e and
γ→e background components and the Q
→e signal component:
1. in a first step, the electron candidates passing the medium identification criteria are required to lie in a specific bin in T R f rac (six equally spaced bins between 0 and 0.3 plus an overflow bin) and n
BL(three bins, n
BL= 0, 1 and
>1). Based on the measured and predicted distributions for T R f rac and n
BLand denoting
εT Rand
εBLthe respective probabilities for a candidate electron corresponding to a given component defined above to lie in a specific bin, one can extract the total number of candidates for each of the three components of the sample by solving a simple set of three linear equations (see below);
2. in a second step, these results are used to predict for each component the distribution of any experimental observable of interest which is independent of T R f rac and n
BL.
The numbers of electrons observed in the data before (N) and after the successive T R f rac (N
T R) and
B-layer (N
BL,T R) cuts in a specific kinematic bin, defined here to be in the two-dimensional p-η space
|η|
0 0.2 0.4 0.6 0.8 1 1.2 1.4 1.6 1.8 2
Entries / 1.0
0 5000 10000 15000 20000 25000 30000 35000
40000 h→ e
= 7 TeV) s Data 2010 ( Monte Carlo
ATLAS Preliminary 13.8 nb-1
≈
∫
L(a)
|η|
0 0.2 0.4 0.6 0.8 1 1.2 1.4 1.6 1.8 2
Entries / 1.0
0 2000 4000 6000 8000 10000 12000 14000 16000 18000
→ e γ
= 7 TeV) s Data 2010 ( Monte Carlo
ATLAS Preliminary 13.8 nb-1
≈
∫
L(b)
|η|
0 0.2 0.4 0.6 0.8 1 1.2 1.4 1.6 1.8 2
Entries / 1.0
0 1000 2000 3000 4000 5000 6000 7000 8000
9000 Q→ e
= 7 TeV) s Data 2010 ( Monte Carlo
ATLAS Preliminary 13.8 nb-1
≈
∫
L(c)
|η|
0 0.2 0.4 0.6 0.8 1 1.2 1.4 1.6 1.8 2
Entries / 1.0
0 10000 20000 30000 40000 50000 60000
= 7 TeV) s Data 2010 ( Monte Carlo
ATLAS Preliminary 13.8 nb-1
≈
∫
L(d)
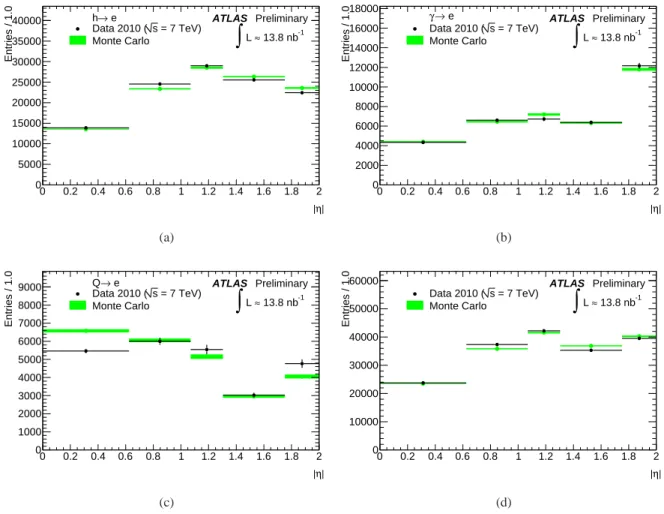
Figure 9:
Distributions of the pseudorapidity of the various components of the medium electron sample (a to c) and of their summed total (d), as extracted from data using the matrix method and as predicted from Monte Carlo.For each plot, the data and simulation have been normalised to the same number of electron candidates and the error bars are purely statistical.
(six bins in p and six bins in
|η|are used for T R f rac while six bins in
|η|are used for n
BL), are given by the following equations:
N
=N
h+N
γ+N
QN
T R=N
hεT Rh +N
γεT Rγ +N
QεT RQN
BL,T R=N
hεBLh εT Rh +N
γεBLγ εT Rγ +N
QεBLQεT RQ ,or, in a matrix form:
N N
T RN
BL,T R
=
1 1 1
εT Rh εT Rγ εT RQ εBLh εT Rh εBLγ εT Rγ εBLQεT RQ
N
hN
γN
Q