ATLAS-CONF-2015-053 28September2015
ATLAS NOTE
ATLAS-CONF-2015-053
25th September 2015
Measurement of the suppression and elliptic anisotropy of heavy flavor muons in Pb+Pb collisions at √
sNN = 2.76 TeV with the ATLAS detector
The ATLAS Collaboration
Abstract
ATLAS has measured the production of heavy flavor muons over|η|<1in√
sNN =2.76TeV Pb+Pb collisions and
√s = 2.76 TeVppcollisions at the LHC. The measurements are per- formed over the transverse momentum range 4< pT< 14GeV and for five Pb+Pb centrality intervals. Backgrounds arising from in-flight pion and kaon decays, hadronic showers, and mis-reconstructed muons are statistically removed using a template fitting procedure. The heavy flavor muon differential cross-sections and per-event yields are measured inpp and Pb+Pb collisions, respectively. The nuclear modification factor,RAA, is observed to be in- dependent of pT within uncertainties and to be less than unity, which indicates suppressed production of heavy flavor muons in Pb+Pb collisions. For the most central interval measured (0–10%), RAA ∼ 0.4. The heavy flavor muon yield is measured as a function of the azi- muthal angle difference,φ−Ψ2, where the experimental event plane angle,Ψ2, is measured in forward calorimeters that cover 3.2 < |η| < 4.9. Fourier coefficients associated with the cos(2(φ−Ψ2))modulation,v2, are measured as a function ofpTand centrality. They vary slowly withpT and show a systematic variation with centrality that is characteristic of other elliptic anisotropy measurements.
© 2015 CERN for the benefit of the ATLAS Collaboration.
Reproduction of this article or parts of it is allowed as specified in the CC-BY-3.0 license.
1 Introduction
Heavy quarks, especially bottom quarks, provide an important probe of the properties of the quark gluon plasma created in high-energy nuclear (A+A) collisions [1–8]. The masses of the charm and bottom quarks are much larger than the temperatures attained in the plasmaT ∼ 200−500 MeV (see [9] and references therein). As a result, the heavy quarks are mostly produced early in the collision at rates that are, in principle, calculable using perturbative QCD, and their subsequent interactions with the plasma yield experimentally observable signatures. At high transverse momenta,pT mb, heavy quarks are thought to lose energy similar to light quarks but with mass-dependent modifications to the pattern of collisional and radiative energy loss [10–12]. At lower transverse momenta, pT . mb, the quarks are thought to diffuse in the plasma losing energy and partially thermalizing [13]. As a result of their interactions with the collectively expanding medium, the heavy quarks may acquire an azimuthal anisotropy due to the collective expansion of the medium. Past measurements of heavy flavor quarks in A+A collisions at RHIC and the LHC using semi-leptonic decays [14–17] and direct reconstruction of heavy flavor mesons [18–20] have shown both substantial suppression in the yield of heavy quarks due to energy loss and significant azimuthal anisotropy. Measurements of the heavy quark yield and azimuthal anisotropy in Pb+Pb collisions at the LHC can provide valuable constraints on plasma transport parameters such as the heavy quark diffusion coefficient and, potentially, distinguish between weak and strong coupling models for heavy quark interactions in the plasma [5,21–25].
The yield of particles produced in hard-scattering processes in A+A collisions is often characterized using the nuclear modification factor:
RAA = 1 hTAAi
N1evt d2N dpTdη
cent
d2σp p dpTdη
, (1)
whereη is the pseudorapidity, the numerator is the differential per-event yield in A+A collisions for a given centrality interval, the denominator is the ppcross-section for producing the given particles, and hTAAi represents the nuclear overlap function averaged over the centrality interval. In the absence of significant modification to the nuclear parton distributions and of final-state interactions of the outgoing partons, the RAA should be unity. Measurements of the production of vector bosons [26–30] in Pb+Pb collisions at the LHC have verified this expectation.
The azimuthal anisotropy of particles produced in an A+A collision is often characterized by coefficients vn in a Fourier expansion of the particle yield as a function of azimuthal angle,φ, [31]
dN dφ =
*dN dφ +
* ,
1+X
n≥1
2vncos nφ−Φn + -
, (2)
whereΦnrepresents the event plane angle for then-th harmonic. In non-central collisions, the azimuthal anisotropy is usually dominated by the n = 2 term due to the spatial anisotropy of initial state in the transverse plane that results from the non-zero impact parameter.
This note presents ATLAS measurements of heavy flavor muon production measured over|η| <11using 0.14 nb−1of Pb+Pb data at√
sNN =2.76 TeV and 4.0 pb−1ofppdata at
√s =2.76 TeV collected during
1ATLAS uses a right-handed coordinate system with its origin at the nominal interaction point (IP) in the center of the detector and thez-axis along the beam pipe. The x-axis points from the IP to the center of the LHC ring, and the y-axis points upward. Cylindrical coordinates(r, φ)are used in the transverse plane,φbeing the azimuthal angle around the beam pipe.
The pseudorapidity is defined in terms of the polar angle pipe. The pseudorapidity is defined in terms of the polar angleθas η=−ln tan(θ/2).
LHC operation in 2011 and 2013, respectively. The measurements are performed for several intervals of collision centrality, characterized using the total transverse energy measured in the forward calorimeters, and for different pT intervals spanning the range 4<pT<14 GeV. Heavy flavor muons are statistically separated from background muons resulting from pion and kaon decays and hadronic interactions using an “energy loss” variable (see Sec.3.3below) that compares the momenta of the muons measured in the inner detector and muon spectrometer. Over the pT range of the measurement, the residual irreducible contamination of non-heavy flavor muons to the measurement, is.1% including contributions fromJ/ψ decays [32]. The heavy flavor muon differential per-event yields in Pb+Pb collisions and differential cross-sections in ppcollisions are used to calculate the heavy flavor muon RAA as a function ofpT in different Pb+Pb centrality intervals. In addition, the heavy flavor muonv2is measured as a function of pT and collision centrality using the event-plane method with the second-order event plane angle, Ψ2, measured in the forward calorimeters.
The remainder of this note is structured as follows: Sec. 2 describes the components of the ATLAS detector and trigger system used in the measurement; Sec.3describes the data analysis; Sec.4presents results with a discussion of systematics; and Sec.5provides a summary and conclusions.
2 ATLAS detector
The measurements presented in this note are obtained using the ATLAS muon spectrometer (MS), inner detector (ID), calorimeter, trigger and data acquisition systems. A detailed description of these detectors and their performance in proton-proton collisions can be found in Ref. [33]. Muons are detected by combining independent measurements of the muon trajectories from the ID and the MS. The ID measures charged particles within the pseudorapidity interval |η| < 2.5 using silicon pixel detectors, silicon microstrip detectors (SCT), and a straw tube tracker, all immersed in a 2 T axial magnetic field.
A charged particle typically traverses three layers of silicon pixel detectors, four layers of double-sided microstrip sensors, and 36 straws. The ID is surrounded by electromagnetic and hadronic calorimeters that absorb efficiently the copious charged and neutral hadrons produced in Pb+Pb collisions. A muon loses typically 3 to 5 GeV of energy, depending on the muon pseudorapidity, while crossing the calorimeters.
The MS surrounds the calorimeters and provides tracking for muons within|η| <2.7 in the magnetic field produced by three air-core toroid systems. Muon momenta are measured in the MS using three stations of precision drift chambers.
Two forward calorimeters (FCal) are placed symmetrically with respect toz=0 and covering 3.2< |η| <
4.9. They are composed of tungsten and copper absorbers with liquid argon as the active medium; each calorimeter has a total thickness of about 10 interaction lengths.
Minimum bias Pb+Pb collisions are identified using the zero degree calorimeters (ZDCs) and the minimum-bias trigger scintillator (MBTS) counters [33]. The ZDCs are located symmetrically at z =±140 m and cover|η| > 8.3. They are used only in Pb+Pb collisions where they primarily measure
“spectator” neutrons, which originate from the incident nuclei and do not scatter hadronically during the collision. The MBTS detects charged particles over 2.1< |η| <3.9 using two hodoscopes of 16 counters each placed atz =±3.6 m. The MBTS provides measurements of both the pulse heights and arrival times of ionization energy deposits in each section.
The ATLAS trigger system [34] consists of a Level-1 (L1) trigger implemented using a combination of dedicated electronics and programmable logic, and a software based high-level trigger (HLT). Data used
for this analysis was selected using a combination of minimum-bias triggers, which provided a uniform sampling of the Pb+Pb inelastic cross-section, and triggers that selected rare physics signatures such as muons. The measurements presented here are primarily obtained from muon triggers. The minimum-bias events are used only for cross-checks.
The muon triggers are formed using a combination of a Level-1 trigger and an HLT muon trigger whose configuration differed between Pb+Pb andppoperation. For the Pb+Pb data, the L1 trigger selected events having a total transverse energy of more than 50 GeV, and the HLT trigger selected events containing a track in the MS whosepT, when corrected for the average muon energy loss in the calorimeter, is greater than 4 GeV. Theppmuon trigger required a muon road in the MS at L1 and a muon track reconstructed using both ID and MS with pT > 4 GeV. The triggers sampled ∼100% and 14% of the full Pb+Pb and ppluminosity, respectively. A separate sample of Pb+Pb events selected using a minimum-bias trigger is used to evaluate the muon trigger efficiency and to provide a cross-check on the measurement made using the muon triggered data.
3 Data analysis
3.1 Event selection
Charged particle tracks and vertices are reconstructed from hits in the ID using a track reconstruction algorithm [35] whose configuration changed between the pp and Pb+Pb measurements to account for the high hit density in heavy ion collisions [36]. To remove non-collision backgrounds, Pb+Pb events are required to have a reconstructed vertex, to have at least one hit in each MBTS counter, and a time difference between the two MBTS detectors of less than 5 ns;ppevents are required to have at least one reconstructed collision vertex.
The centrality of Pb+Pb collisions is characterized byΣEFCal
T , the total transverse energy measured in the FCal [36]. For the results presented in this note, the minimum-biasΣEFCal
T distribution is divided into centrality intervals according to the following percentiles of theΣEFCal
T distribution ordered from the most central to the most peripheral collisions: 0–10%, 10–20%, 20–30%, 30–40%, and 40–60%. The centrality intervals are determined after accounting for an estimated 2±2% inefficiency of the minimum-bias trigger and event selections. A standard Glauber Monte-Carlo analysis [37,38] is used to estimatehTAAifor each of the centrality bins [39]. The results are reproduced in Table1.
Centrality interval [%] hTAAi[mb−1]
0–10 23.45±0.37
10–20 14.43±0.30
20–30 8.73±0.26
30–40 5.04±0.22
40–60 2.02±0.15
Table 1: ThehTAAivalues and their systematic uncertainties [39] in each centrality bin used in this analysis.
3.2 Muon reconstruction
Muons used in this analysis are obtained by combining tracks reconstructed in the muon spectrometer [32]
with the tracks measured in the ID. The associated ID tracks are required to satisfy criteria on the number of hits in the SCT and pixel detectors that are the same for theppand Pb+Pb data and that are optimized for the Pb+Pb analysis. In particular, for both data sets, ID tracks are required to have transverse and longitudinal impact parameters with respect to a reconstructed primary vertex of less than 5 mm and to have a momentump>3 GeV. The momentum measured in the MS is required to be greater than 1.2 GeV for both the ppand Pb+Pb data. When used in the Pb+Pb analysis, this selection removes muons for which the Pb+Pb trigger efficiency is less than 50%.
The results presented here use muons having 4<pT<14 GeV and|η|<1. The lower limit of thepT range is constrained by thepT dependence of the muon trigger and reconstruction efficiencies while the upper limit is determined by the number of events available in the Pb+Pb data. The muonηinterval is chosen for optimal muon performance. A total of 9.2 million (1.8 million) muons are reconstructed within these kinematic ranges from 8.7 million (1.8 million) events recorded using the Pb+Pb (pp) muon triggers.
The performance of the ATLAS detector and offline analysis in measuring muons in pp and Pb+Pb collisions is evaluated using Monte Carlo (MC) samples [40] obtained from Geant 4-simulated [41]
√s = 2.76 TeV pp dijet events produced with the Pythia event generator [42] (version 6.423 with parameters chosen according to the AUET2B tune [43]). The resulting Pb+Pb events were overlayed onto Pb+Pb collision events selected with the minimum-bias trigger. These events were recorded by ATLAS during the same data-taking period as the data used in this analysis. Theppevents were overlaid onto PYTHIA-simulated minimum-bias 2.76 TeV events at a rate consistent with the typical per-crossing collision rate of ∼ 0.5. For both theppand Pb+Pb measurements, the muon reconstruction efficiency increases by about 15% betweenpT =4 GeV andpT =6 GeV, above which it is approximately constant at∼ 0.87 and ∼ 0.84 for the ppand Pb+Pb data, respectively. The Pb+Pb reconstruction efficiency is independent of centrality within uncertainties.
The Pb+Pb muon trigger efficiency is measured for fully reconstructed muons using the minimum-bias Pb+Pb data set. The efficiency is evaluated as the fraction of reconstructed muons for which the HLT finds a matching muon with pT > 4 GeV. It is observed to be centrality-independent within statistical uncertainties. It increases from∼60% atpT =4 GeV to∼75% at 6 GeV, above which it is approximately constant. Theppmuon trigger efficiency for the 4 GeV threshold is evaluated using a tag-and-probe analysis applied to reconstructedJ/ψ→ µ+µ−decays. The efficiency increases from 0.52 for 4< pT <4.5 GeV to 0.82 forpT >5.5 GeV, above which it is constant. Thepptrigger efficiency has non-negligible statistical uncertainties determined by the available number ofJ/ψ dimuon decays in theppdata set.
3.3 Heavy flavor muon measurement
The muons measured in theppand Pb+Pb data sets contain background from in-flight decays of pions and kaons, muons produced from the decays of particles produced in hadronic showers, and mis-associations of ID and MS tracks. Previous studies have shown that the signal and background contributions to the reconstructed muon sample can be discriminated statistically [32]. This analysis relies solely on the fractional momentum imbalance, ∆p/pID, which quantifies the difference between the ID and MS
p/pID
0.4 ∆
− −0.2 0 0.2 0.4 0.6
IDp/p∆/d µ dN µ1/N
0 2 4 6
8 ATLAS Simulation Preliminary = 2.76 TeV sNN
< 6 GeV 5 < pT
| < 1 η
|
Pb+Pb 0-60%
signal background
p-p
signal background
Figure 1: Signal and background template distributions inppcollisions (red points) and Pb+Pb collisions (black points) in the 0–60% centrality interval for muons having 5<pT<6 GeV and|η|<1. The signal and background distributions are separately normalized such that their integral is unity. The background distribution is binned more coarsely because of the limited statistics available in the background sample.
measurements of the muon momentum after accounting for the energy loss of the muon in the calorimeters.
It is defined as
∆p
pID = pID−pMS−∆pcalo(p, η, φ)
pID , (3)
where pID and pMS represent the reconstructed muon momenta from the ID and MS, respectively and
∆pcalo represents a momentum and angle-dependent average energy loss of muons in the calorimeter obtained from MC simulations. Muons resulting from background processes typically havepMS values smaller than would be expected for a muon produced directly inppor Pb+Pb collisions or via the decays of heavy flavor hadrons. As a result, background muons would be expected to have∆p/pID >0.
Distributions for ∆p/pIDare obtained from the MC samples separately for signal muons and for back- ground muons. The signal muons include muons directly produced in strong and electromagnetic decays of hadrons, in decays of tau leptons, and in semi-leptonic decays of heavy flavor mesons; this latter contribution dominates the signal sample. The different contributions to the background: pion decays in flight, kaon decays in flight, muons produced by secondary interactions of prompt particles, and mis- associations, are separately evaluated. The Pb+Pb MC background∆p/pIDdistributions are weighted by a
∆p/pID-dependent factor that accounts for thepMSdependence of the Pb+Pb muon trigger efficiency and improves the agreement between the MC and data∆p/pIDdistributions. Figure1shows MC distributions of∆p/pIDfor signal and background muons having 5< pT <6 GeV for Pb+Pb collisions in the centrality range 0–60% and for ppcollisions. The∆p/pID distribution for signal muons is centered at zero while
the distribution for background muons is shifted to positive values. The background∆p/pIDdistributions are centrality independent in Pb+Pb collisions and also agree well between Pb+Pb and pp collisions.
The signal distributions show a weak dependence on Pb+Pb collision centrality and also show modest differences betweenppand Pb+Pb collisions.
A template fitting procedure is used to statistically estimate the signal fraction for each kinematic and centrality selection used in the analysis. The measured∆p/pID distribution is assumed to result from a combination of signal and background distributions
dN
d∆p/pID = Nµ fsig dPsig
d∆p/pID +(1− fsig) dPbkg d∆p/pID
!
, (4)
where Nµ is the total number of muons in the sample, dPsig/d∆p/pID and dPbkg/d∆p/pID represent the signal and background∆p/pID probability distributions, respectively, and fsig represents the signal fraction.
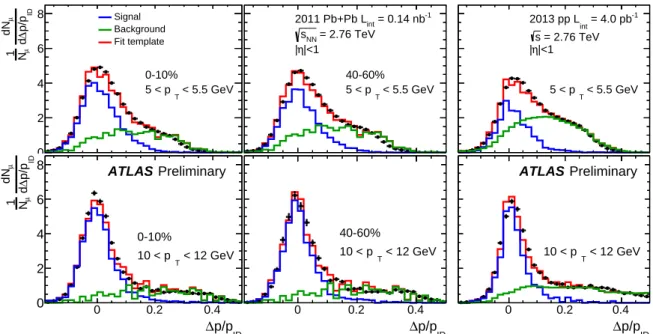
For Pb+Pb data, centrality-dependent templates are used for the signal while centrality integrated templates are used for the background. The latter is motivated by the observed centrality-independence of the background templates and the limited statistics in the background sample. In thev2analysis, these same signal and backgrounds templates are used for each of the differentφ−Ψ2bins in each given momentum and centrality intervals. Template fits are performed using binned χ2 fits that account for the finite statistics of the signal and background templates. The fits are performed using MINUIT [44] with fsig andNµ as the free parameters. Example template fits are shown for two muon pT intervals in Fig.2for Pb+Pb events in the 0–10% and 40–60% centrality intervals and for pp data. As demonstrated in the figure, a combination of signal and background templates successfully describes the measured∆p/pID distributions in all studied kinematic and/or centrality intervals.
A cross-check on the template fitting procedure was performed using a simple cut procedure applied to the∆p/pIDdistributions. For a given centrality and/orpTbin, a cut is applied at a chosen value of∆p/pID,
∆p/pID|cut = 0.1, and the fraction of muons in the data below the cut, f< is calculated. That fraction represents most of the signal muons with a modest contamination of background muons. The MC signal and background∆p/pIDdistributions are used to evaluate the fraction of the signal (f<
S) and background (f<
B) muons below the cut. These represent, respectively, the efficiency for a signal muon to be accepted by the cut and the leakage of the background into the cut region. Then, the signal fraction is evaluated according to
fsig
cut = f<− f<
B
f<
S − f<
B
. (5)
The results of this method are generally in good agreement with the results of the template fitting. However, at lowpT, the fsigvalues obtained with the cut method are systematically higher than those obtained from the template fits. These difference may reflect inconsistencies between the data and MC templates that may, for example, arise from the effect of the trigger. The difference between the fsig values obtained using the two methods is included in the systematic uncertainties on the measured number of heavy flavor muons as described below.
p/pID
∆
0 0.2 0.4
IDp/p∆dµdN µN1
0 2 4 6
8 Signal
Background Fit template
0-10%
< 5.5 GeV 5 < p T
p/pID
∆
0 0.2 0.4
IDp/p∆d
µdN µN1
0 2 4 6
8 ATLAS Preliminary
0-10%
< 12 GeV 10 < p T
loss/p δ p
0 0.2 0.4
IDp/p∆ddN N1
0 2 4 6 8
40-60%
< 5.5 GeV 5 < p T
= 0.14 nb-1
2011 Pb+Pb Lint
= 2.76 TeV sNN
|<1 η
|
p/pID
∆
0 0.2 0.4
IDp/p∆1/N dN/d
0 2 4 6 8
40-60%
< 12 GeV 10 < p T
loss/p δ p
0 0.2 0.4
< 5.5 GeV 5 < p T
= 4.0 pb-1
2013 pp Lint
= 2.76 TeV s
|<1 η
|
p/pID
∆
0 0.2 0.4
Preliminary ATLAS
< 12 GeV 10 < p T
Figure 2: Results of template fits to Pb+Pb andppdata. The top panels show results for 5<pT<5.5 GeV and the bottom panels show results for 10<pT<12 GeV. The left, middle, and right panels show results for Pb+Pb 0–10%, Pb+Pb 40–60%, andpp, respectively. The black points represent the data. The blue and green lines represent the signal and background template distributions weighted by fsigand(1− fsig), respectively (see text) and the red lines represent the combined template distributions.
4 Results
4.1 Heavy flavor muonRAA
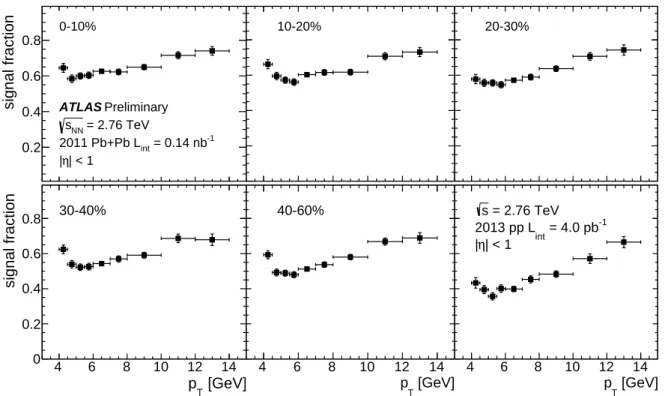
The heavy flavor muon differential cross-sections and differential yields are measured inppand Pb+Pb collisions, respectively, using muon pT intervals of width 0.5 GeV between 4 and 6 GeV, intervals of width 1 GeV between 6 and 8 GeV, and intervals of width 2 GeV forpT > 8 GeV. The signal fractions obtained from the template fit procedure described in Sec.3.3using these intervals are shown in Fig.3for the Pb+Pb andppdata. The increase in fsigat lowpTresults from selection bias in the triggers which are less efficient for background muons that have lowpMS. Such an increase is not observed when repeating this analysis using the minimum-bias Pb+Pb data set.
Theppdifferential cross-section for producing heavy flavor muons is calculated according to d2σHFµ
dpTdη = 1 L
∆Nµfsig
∆pT∆η 1
εtrigεrec, (6)
whereL is the integrated luminosity of theppmeasurement, ∆pT is the width of the givenpT interval,
∆η =2 is the pseudorapidity interval included in this measurement,∆Nµrepresents the number of muons in the givenpT andηintervals, fsig represents the signal fraction, andεtrigandεrecrepresent the trigger and reconstruction efficiencies, respectively. The luminosity is calibrated using a set of beam-separation scans performed in February 2013. It has a relative uncertainty of 3.1% that was derived following a methodology similar to that detailed in Ref. [45].
[GeV]
pT
4 6 8 10 12 14
signal fraction
0 0.2 0.4 0.6
0.8 30-40% pT [GeV]
4 6 8 10 12 14
signal fraction
0.2 0.4 0.6 0.8
0-10%
= 0.14 nb-1
2011 Pb+Pb Lint
= 2.76 TeV sNN
| < 1 η
|
ATLAS Preliminary
[GeV]
pT
4 6 8 10 12 14
pr f
0 0.2 0.4 0.6 0.8
10-20%
[GeV]
pT
4 6 8 10 12 14
pr f
0 0.2 0.4 0.6
0.8 40-60% pT [GeV]
4 6 8 10 12 14
pr f
0 0.2 0.4 0.6 0.8
20-30%
[GeV]
pT
4 6 8 10 12 14
pr f
0 0.2 0.4 0.6
0.8 s = 2.76 TeV = 4.0 pb-1
2013 pp Lint
| < 1 η
|
Figure 3: Signal fraction values obtained from template fits to the Pb+Pb andppdata as a function ofpT. Results are shown for different Pb+Pb centrality intervals and forppcollisions in the bottom right panel.
Figure 4 shows the pp differential cross-section calculated according to Eq. 6. The error bars show statistical uncertainties resulting from combined statistical uncertainties on∆Nµ and fsig. The shaded bands show systematic uncertainties calculated as described below.
The Pb+Pb differential per-event yields for producing heavy flavor muons are calculated according to 1
Nevt
d2NHFµ dpTdη
cent
= 1 Ncent
evt
∆Nµcentfsig
∆pT∆η 1
εtrigεrec, (7)
whereNcent
evt is the number of Pb+Pb collisions in a given centrality interval sampled by the muon trigger,
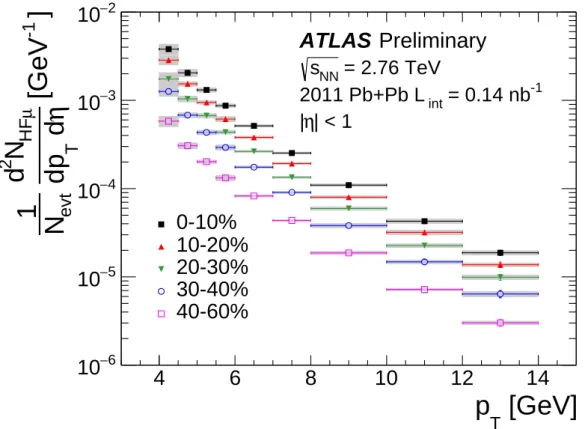
∆Nµcentrepresents the number of total muons with|η|<1 measured in the givenpTand centrality interval, fsigrepresents the corresponding signal fraction obtained from the template fits, andεtrigandεrecrepresent the trigger and reconstruction efficiencies, respectively. Figure5shows the differential per-event heavy flavor muon yields measured in Pb+Pb collisions obtained using Eq.7. The statistical uncertainties on the yields resulting from combined statistical uncertainties on∆Nµ and fsigare everywhere smaller than the size of the symbols. The shaded boxes show systematic uncertainties estimated as described below.
The measurement of the heavy flavor muon differential cross-sections and per-event yields are subject to systematic uncertainties arising from the muon trigger selection, muon reconstruction efficiencies, the template fitting procedure, muonpTresolution, and theppluminosity.
The systematic uncertainty in the Pb+Pb muon trigger efficiency is evaluated by varying the selections applied to the offline-reconstructed muons in the minimum-bias reference sample and then re-evaluating the trigger efficiency. The resulting changes in the trigger efficiency vary between 1% and 4% over 4<pT<14 GeV and are taken as the estimate of the systematic uncertainty on εtrig. The systematic
[GeV]
pT
4 6 8 10 12 14
] -1 GeV× [nb η d TdpµHF σ2 d
1 10 102
103
| < 1 η
|
= 2.76 TeV s
= 4.0 pb-1
2013 pp L int
Preliminary ATLAS
Figure 4: The measuredppheavy flavor muon differential cross-section as a function ofpT. The error bars represent statistical uncertainties on the data, while the systematic uncertainties, including the contribution from luminosity, are indicated by the shaded bands.
uncertainty on thepptrigger efficiency is taken from the statistical uncertainties arising from the tag-and- probe method compared to which, all other contributions to the systematic uncertainties are negligible.
The systematic uncertainties associated with the muon reconstruction efficiency are evaluated by varying the muon selections and repeating the analysis. The Pb+Pb and pp uncertainties are similar and vary between 1.5% atpT =4 GeV, to 2–3% forpT > 7 GeV. Separately, the minimumpMSis varied from its default value to 0.5 GeV and 1.5 GeV and the entire analysis repeated. This variation affects the template fitting but also is sensitive to potential systematics in the muon reconstruction efficiency. The variation in the Pb+Pb muon yields under the change in the minimum pMS taken as a systematic uncertainty on the heavy flavor muon yields, decreases withpTfrom∼3% to∼1% over the measuredpTrange.
Systematic uncertainties resulting from the construction of the templates, particularly the background template are evaluated by changing the relative proportion of different background contributions. The pion and kaon decay-in-flight components of the background are separately increased by a factor of two and then separately decreased by a factor of two. For each variation, the template fitting is performed and a new value for fsigobtained. The average of the unsigned differences between the varied and nominal fsig values is taken as the systematic uncertainty on the template fitting due to the background composition.
It varies from∼ 7% to 1% over thepT range of the measurement. The variations in the minimum pMS described above for the Pb+Pb analysis also tests potential systematic uncertainties in the template fitting due to Pb+Pb muon trigger bias. A separate systematic on the template fitting method is estimated using the cut method described above. It produces results for the signal fraction that are systematically higher
for bothppand Pb+Pb data than the results from the template fits at both low and highpT. The difference is largest in the lowestpTinterval where it is 10% and∼15% higher forppand Pb+Pb data respectively.
For otherpTbins the differences are less than 6%. These differences are taken as a systematic associated with the template fit method.
Theppcross-sections and Pb+Pb per-event yields are not corrected for bin migration resulting from the muon momentum resolution. An evaluation of MC bin-by-bin correction factors yields values that are typically within 1% (2%) of unity forpp(Pb+Pb) data. These corrections are sufficiently small that they are not applied to the data. However, the deviations from unity are included in the systematic uncertainties on the cross-sections and per-event yields. The combined systematic uncertainties are shown with the shaded bands on Figs.4and5. In some cases, the systematic uncertainties on the Pb+Pb yields are too small to be easily seen. They vary little with collision centrality.
The heavy flavor muonRAA is calculated according to Eq.1using the results presented in Figs.4and5.
The results are shown in Fig.6. The systematic uncertainty on the template fitting evaluated using the cut method mostly cancels in the RAA as similar systematic differences are observed for the ppand Pb+Pb data. The contribution of that systematic to theRAA was calculated by comparing the results of theRAA obtained using the template fit and cut methods. Other systematics on theRAAfrom theppcross-section, Pb+Pb per-event yields, andhTAAiare propagated using standard techniques. The combined systematic is shown in Fig.6with the shaded bands.
[GeV]
pT
4 6 8 10 12 14
]-1 [GeV η d TdpµHFN2
d
evtN1
−6
10
−5
10
−4
10
−3
10
−2
10
0-10%
10-20%
20-30%
30-40%
40-60%
| < 1 η
|
= 2.76 TeV sNN
= 0.14 nb-1
2011 Pb+Pb L int
Preliminary ATLAS
Figure 5: The measured Pb+Pb heavy flavor muon differential per-event yields as a function of pT obtained for the different centrality intervals included in this analysis. The statistical uncertainties on the data are everywhere smaller than the sizes of the symbols. The shaded bands represent systematic uncertainties (see text); in many cases the shaded bands are too small to be easily seen.
[GeV]
pT
4 6 8 10 12 14
AAR
0 0.2 0.4 0.6 0.8 1
| < 1 η
|
= 2.76 TeV sNN
= 0.14 nb -1
2011 Pb+Pb L int
= 4.0 pb -1
2013 pp L int
Preliminary ATLAS
0-10%
[GeV]
p
T4 6 8 10 12 14
AAR
0 0.2 0.4 0.6 0.8 1
10-20%
[GeV]
pT
4 6 8 10 12 14
AAR
0 0.2 0.4 0.6 0.8 1
30-40%
[GeV]
pT
4 6 8 10 12 14
AAR
0 0.2 0.4 0.6 0.8 1
20-30%
[GeV]
pT
4 6 8 10 12 14
AAR
0 0.2 0.4 0.6 0.8 1
40-60%
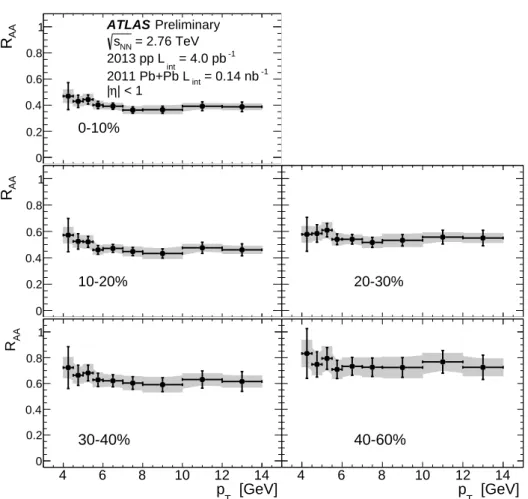
Figure 6: The measured Pb+Pb heavy flavor muonRAA as a function ofpT. The five panels show results in the five different centrality intervals. The error bars represent statistical uncertainties on the data, and the shaded bands represent systematic uncertainties (see text).
TheRAAispT-independent within the uncertainties of the measurement. It decreases between peripheral (40–60%) and more central collisions reaching a value of∼ 0.4 in the 0–10% centrality interval. These results are consistent with previous results from the ALICE experiment [16], but have much smaller uncertainties.
4.2 Heavy flavor muonv2
Thev2measurement requires determination of the second-order event-plane (EP) angle Φ2 (see Eq.2).
However, due to detector acceptance effects and finite multiplicity in an event, the measured EP angle, denoted Ψ2, fluctuates event-by-event around the true EP angle, Φ2 [31]. The “observed” v2, vobs
2 , is obtained by measuring the distribution of the particle directions with respect to theΨ2plane:
dN
dφ = N0f
1+2vobs
2 cos(2(φ−Ψ2))g
. (8)
Thevobs
2 is smaller in magnitude than the truev2because it is calculated around theΨ2plane rather than theΦ2plane. To account for this, thevobs
2 is then corrected by the so-called EP resolution factor, Res{2Ψ2},
which accounts for the smearing ofΨ2with respect toΦ2[31]:
v2= vobs
2
Res{2Ψ2}, Res{2Ψ2}=hcos(2(Ψ2−Φ2))ievts, (9) In the present analysis, the determination of theΨ2 angle is done using the second-order flow vector or
“q2-vector” method [31]. Theq2-vector is calculated from theETdeposited in the FCal according to:
q2,x = ΣET,icos(2φi)− hΣET,icos(2φi)ievts
ΣET,i , (10)
q2,y = ΣET,isin(2φi)− hΣET,isin(2φi)ievts
ΣET,i , (11)
(12) where the sum is taken over all the calorimeter towers in the FCal, φi denotes the azimuthal angle and ET,i is the transverse energy deposited in the ith tower. The event-averaged termshΣET,icos(2φi)ievts andhΣET,isin(2φi)ievtsare subtracted in order to remove detector effects [46]. From theq2-vectors, the second-order EP angle,Ψ2, is determined as [47]:
tan(2Ψ2) = q2,y
q2,x. (13)
The Res{2Ψ2}for the FCal and its associated systematic uncertainties, have been determined in a prior ATLAS analysis [48]. Those values and uncertainties are directly used in this note. The EP resolution for the FCal varies between 0.5 and 0.9 for the centrality classes used in this analysis.
The heavy flavor muonvobs
2 values are measured by evaluating the yields differentially with respect to the Ψ2plane. For this, the template fitting procedure is repeated in bins of 2|φ−Ψ2|for eachpTand centrality interval. Utilizing the two-fold symmetry of the Ψ2-plane and the fact that cos(2(φ−Ψ2)) is an even function, it is sufficient only to bin over the interval(0, π) in 2|φ−Ψ2|. Four bins of 2|φ−Ψ2|: (0, π/4), (π/4, π/2),(π/2,3π/4), and(3π/4, π)are used. The same signal and background templates are used for the four 2|φ−Ψ2|bins in a givenpT and centrality interval. As a result, there is a significant correlation between the statistical uncertainties on the signal fractions measured in the four cos(2(φ−Ψ2))intervals.
Figure7shows the signal fraction obtained in each of the 2|φ−Ψ2|bins as a function of pT for the five centrality intervals used in this analysis. A dependence of the fraction on 2|φ−Ψ2|, observed in the data, indicates that the heavy flavor muons and background muons have differentv2values. The fractions are typically largest for 2|φ−Ψ2| < π/4 and decrease with increasing 2|φ−Ψ2|.
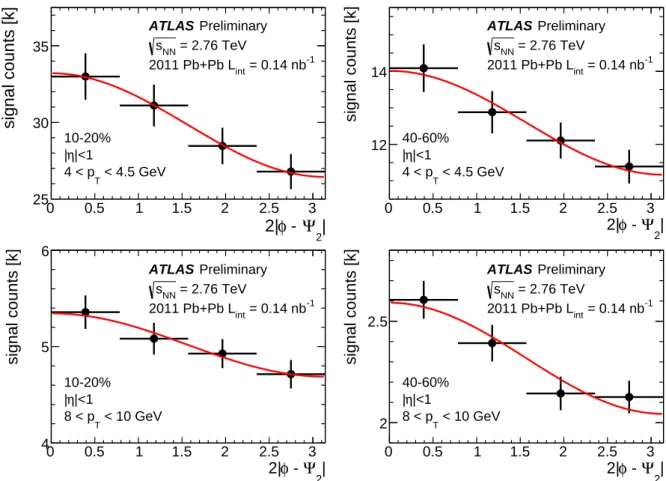
Figure8shows examples of the differential yields of heavy flavor muons obtained from the template fits as a function of 2|φ−Ψ2| for two centrality and two pT intervals. A clear dependence of the yields onΨ2 can be observed, with a larger yield in the “in-plane” direction (2|φ−Ψ2| ∼ 0) compared to the
“out-of-plane” direction (2|φ−Ψ2| ∼π), implying a significantv2signal. The differential yields are fitted with a second order Fourier fit of the form in Eq.8to obtain thevobs
2 . While performing the fits, the χ2 minimization is done taking into account the correlations between the statistical uncertainties on the yields in the different 2|φ−Ψ2|bins. These fits are indicated by the continuous lines in Fig8. Thevobs
2 values, are then corrected to account for the EP-resolution (Eq.9). The resolution-correctedv2values are plotted in Fig.9as a function ofpTfor the five centrality intervals used in this analysis. Over the 10–40% centrality range, thev2is largest at the lowest measuredpT of 4 GeV and decreases for higherpT. However, in the
![Table 1: The hT AA i values and their systematic uncertainties [39] in each centrality bin used in this analysis.](https://thumb-eu.123doks.com/thumbv2/1library_info/4013212.1541240/4.892.320.596.839.974/table-aa-values-systematic-uncertainties-centrality-used-analysis.webp)