ATLAS NOTE
ATL-MUON-PUB-2008-007
17 April 2008
The alignment system of the ATLAS barrel muon spectrometer
J.C. Barriere a , F. Bauer a , M. Fontaine a , A. Formica a ,
V. Gautard a , P.F. Giraud a , C. Guyot a , R. Hart b , S. Horvat c , O. Kortner c , S. Kotov c , H. Kroha c , F.Linde b , P. Ponsot a , I.Potrap c , Ph. Schune a , H. van der Graaf b
a CEA-DAPNIA, Saclay, Gif-sur-Yvette, France
b NIKHEF, Amsterdam, The Netherlands
c MPI fuer Physik, Munich, Germany
Abstract
The alignment system of the barrel part of the muon spectrometer of the LHC experiment ATLAS
is described. The optical system is designed to determine the position of the chambers in such a way
that the alignment contribution to the uncertainty on the sagitta measurement of high momentum muon
tracks pointing to the beam interaction point is below 40 µ m. Emphasis is put on the optical sensors,
their performance, positioning accuracy and calibration, and to the fitting program used to calculate
the position of the muon chambers. This note underlines the difference between the alignment in the
absolute mode, which relies on the accurate positioning of the optical sensors on the chambers and on
their precise calibration, and the relative mode in which the optical system is used to track the movement
of the chambers with respect to a reference geometry determined with a large number of straight tracks
registered in runs with the toroid field turned off. Due to the limited precision of the positioning of the
sensors, the ultimate precision is expected to be obtained in the relative mode. Finally, experimental
results from tests done at the CERN test beam facility are briefly shown.
1 Introduction
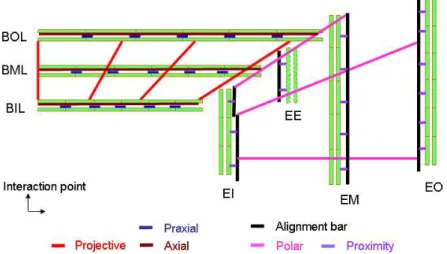
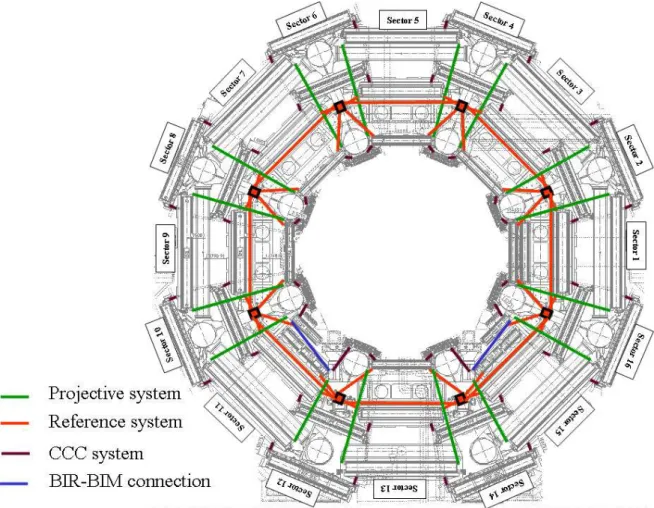
The muon spectrometer of the ATLAS experiment at the Large Hadron Collider is based on a large eight-coil toroid magnet providing an average field of 0.5 Tesla in the barrel volume [1]. Due to presence of the eight coils, the spectrometer is segmented in 16 azimuthal sectors, with so-called large sectors in between two coils alternating with small sectors at the coil azimuth (see figure 5). The azimuthal symmetry is broken by the presence of the calorimeter and toroids feet. The momentum of the muon tracks is derived from the sagitta measured through three layers of Monitored Drift Tubes (MDT) chambers called BIL/BML/BOL in the large sectors of the barrel and BIS/BMS/BOS in the small sectors (for a description of the construction parameters and of the chamber nomenclature, see [2]). In each half sector (z>0 or z<0, the z axis being defined by the average beam direction, with the origin at the interaction point) a chamber layer consists of 6 chambers (8 for the BI layer of the small sectors) leading to an approximate segmentation in 6 towers in pseudorapidity (see figure 1). Each chamber is made of 6 (8 for the BI chambers) layers of 3 cm diameter pressurized drift tubes, arranged in two multilayers separated by an aluminium structure (cross-plates) providing the required chamber stiffness. The ATLAS muon spectrometer is designed to reach a transverse momentum resolution of 10% for a 1 TeV muon, in a regime where the resolution is mainly limited by the chambers accuracy and their alignment. With the available magnetic field bending power, this corresponds to measuring a 500 µ m sagitta with a 50 µ m accuracy. As the single tube resolution of 80 µ m (average over the drift distance) leads to a 40 µ m sagitta resolution, it is a requirement that the alignment contribution to the sagitta measurement be kept below 40 µ m. In the ATLAS spectrometer, the MDT chambers and their auxiliary alignment devices are installed with a precision of about 5 mm and 2 mrad with respect to their nominal position, which is more than two orders of magnitude higher than the expected alignment accuracy. To reach this precision goal, an optical alignment system was built that determines the location of each chamber relative to that of its neighbours, both within an MDT layer and along r-z trajectories within MDT towers, where r is the radial coordinate (see figure 1).
Fig. 1: Principle of the alignment of the ATLAS muon spectrometer.
The deformation and position of the MDT chambers are monitored by means of optical sensors and the geom- etry used by the muon reconstruction packages is then corrected offline. The optical alignment system is expected to work in the so-called absolute mode: the position of the optical sensors mounted on the MDT chambers or on intermediate structures is known with a high precision (typically better than 20 µ m) with respect to each other and to the MDT wires position, and the optical sensors are calibrated with a precision corresponding to a control of the individual optical elements with a few microns accuracy. With the very good intinsic resolution of the sensors, the optical system will provide the relative position of the MDT chambers along an almost projective muon track coming from the intersection point (IP) with high enough precision along the directions relevant for the sagitta measurement. In addition to the high accuracy on the sagitta correction, the optical system should also provide the absolute chambers position with a precision better than 1 mm in all directions in the ATLAS coordinate frame.
This precision is required for the magnetic field reconstruction. The positioning accuracy of the sensors has been
monitored on a subset of chambers ( ∼ 10%) by X-ray tomography with a few µ m accuracy. The measurements
show that the required positioning accuracy has been reached for a majority of the glued sensor support platforms.
However for a sizable number of them (a few %), a large departure from the nominal position (up to several hun- dred µ m) has been observed. Additional constraints from measurement of the apparent track sagitta performed with the toroid field turned off will be required to reach the alignment precision (see section 5.2).
An alternative approach using muon tracks themselves has been investigated to crosscheck the optical system results albeit with a probably reduced precision. In principle, as the accurate sagitta measurement relies on only three points, the problem cannot be solved by using tracks with unknown curvature. Still, by using the additional constraints provided by the angular measurement capability of the MDT chambers, it will be possible to control the barrel chamber alignment at a level better than 100 µ m on the sagitta measurement. The track segment matching will also be used for the alignment of the chambers which are not connected with high precision to the alignment system (e.g. chambers of the small sectors) with respect to optically aligned neighboring large chambers (see section 5.1).
Due to the different environmental contraints, the alignment systems in the barrel and the endcap follow slightly different strategies. This note describes the barrel part whereas the endcap part is presented in a separate document [3]. A schematic representation of the alignment system in a large sector is shown in figure 1. In the barrel, the chambers of each BI/BM/BO layer are optically connected by so-called "axial" and "praxial" alignment systems in such a way that they form a "plane". Then the three planes are directly connected by the projective alignment system which consists of a set of three-point alignment monitors as shown on figure 6.
2 The alignment tools
Two different optical systems are used in the barrel alignment: RASNIK (Red Alignment System of NIKHEF) and SaCam (Saclay Camera). Both systems are based on the principle of a three-point straightness monitor: an optoelectronic image sensor (CCD or CMOS) looks through a lens toward a lighted target. In order to limit computer storage capacity, the sensor image is analyzed online and converted into four parameters characterizing the deviation from the nominal geometry: two translations transverse to the optical axis, the relative rotation around this axis of the target with respect to the image sensor, the longitudinal position along this axis through the value of the optical system magnification.
2.1 The RASNIK system
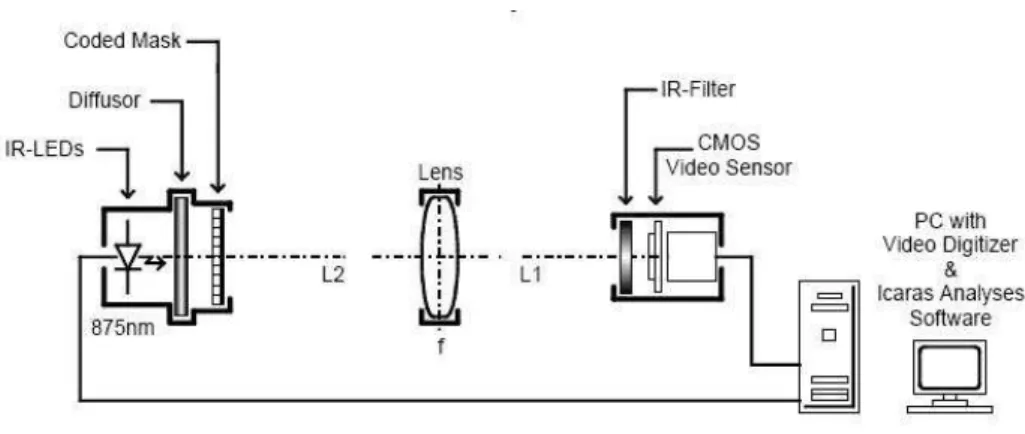
The principle of the RASNIK system [4] is shown in figure 2.
Fig. 2: Principle of the RASNIK system.
RASNIK image monitors, called RasCam, are based on monochrome CMOS sensors (VLSI Vision VV5430),
with an array of 384 × 287 pixels and a 12 µ m pixel size. The sensitivity peak lies at 820 nm. The CMOS is
embeded in a custom made electronics board, which converts the CMOS signal into a semi-differential CCIR
composite video signal sent to the outside via a RJ45 cable. All the electronics are placed in an aluminum die-cast
housing and the optical window is covered with an infrared filter (Schott RG830), to avoid stray light which could
lower the contrast of the target image.
Fig. 3: Schematics of the RasCam and RasLeD elements.
The target, called RasLeD, consits of a mask formed by a thin film chromium/glass slide (< 0.5 µ m), with a chess board-like pattern back-illuminated by an array of infrared LED (875 nm). A diffuser is placed between the LED and the film, thus smoothing imperfections due to the light source shape. The chess board square dimension D is chosen such that the image of each square is covered by at least 5-10 pixels. This allows an interpolation of the black and white transition, thus improving the translation resolution to 12 µ m/ p
N
pixel.
Every nine chess board squares in each direction a pattern of black and white squares is printed which contains information about the location on the mask at the mm scale. D varies between 85 and 340 µ m depending on the magnification of the system and the mask size is chosen to be either 20 mm (inplane and praxial systems) or 50 mm (projective systems) depending on the required dynamical range which itself is directly related to the positioning accuracy of the chambers carrying the sensors. Schematics of the RasCam and RasLeD sensors are shown on figure 3. For a symmetric RASNIK, where the lens is positioned halfway between CMOS and mask, translation resolution of 1 µ m and magnification resolution of 2 × 10
−5have been obtained.
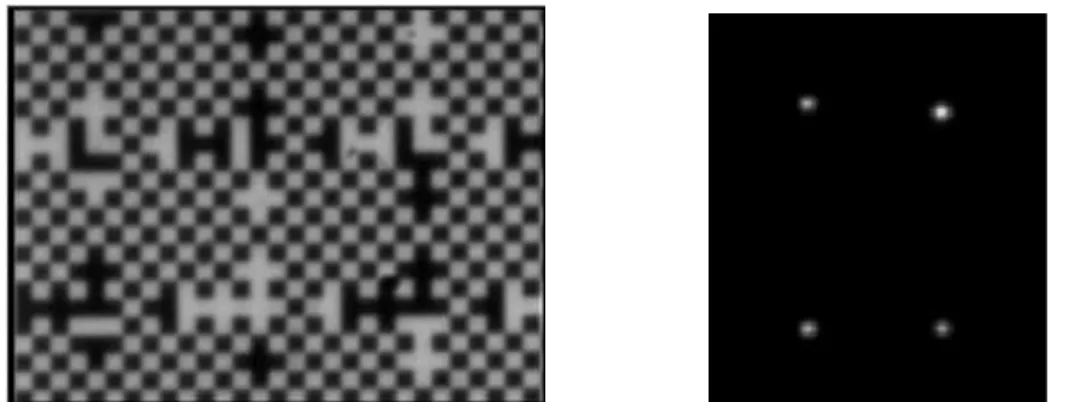
Fig. 4: Left: RASNIK chess board pattern seen by the CMOS. Right: Image of LED spots seen by a SaCam.
2.2 The SaCam sensor (Saclay Camera)
The SaCam is a camera consisting of a CMOS sensor (identical to the one used for the RasCam) and a lens, which looks towards four laser diodes (see figure 14). The SaCam housing may contain also a set of four laser diodes which can be used as targets for another SaCam. The dynamic range of a SaCam is ± 16 × ± 21 mrad. The lens is mounted at distances varying from 25 mm to 80 mm depending on the distance between the CMOS and the target.
The target is made of four back-illuminated holes, covered by a light diffuser. The distances between holes are of two types: 15 × 15 mm for standalone targets mounted on the chambers, and 35 × 50 mm for targets mounted on a camera housing. The image seen on the CMOS sensor is a set of four spots of light (see figure 4). Due to the fact that the distance lens-target is much larger than the distance lens-CCD, SaCam can be considered as telescopes.
The measured quantities are therefore two bearing angles with respect to the optical axis, the magnification and the rotation angle around the optical axis. As for the RASNIK system, captured SaCam images are analyzed online.
The SaCam image analysis software computes (i) the center of gravity of the image spots, (ii) the magnification and (iii) the rotation after subtraction of a threshold value.
Relative resolutions of 5 µ m, 5 × 10
−4and 0.5 mrad have been achieved for these three quantities. The dynamic range on the transverse angles is ± 22 × ± 29 mrad.
3 The barrel alignment implementation
A transverse view of the layout of the barrel alignment lines is shown in figure 5. A more detailed sketch of the barrel system for three adjacent barrel sectors is shown in figure 6.
Fig. 5: Transverse view of the barrel spectrometer showing the azimuthal segmentation in large (odd numbers) and small (even
numbers) sectors and the layout of the alignment lines.
Fig. 6: Layout of the alignment lines for three adjacent barrel sectors (sectors 4, 5 and 6).
3.1 The barrel alignment sub-sytems
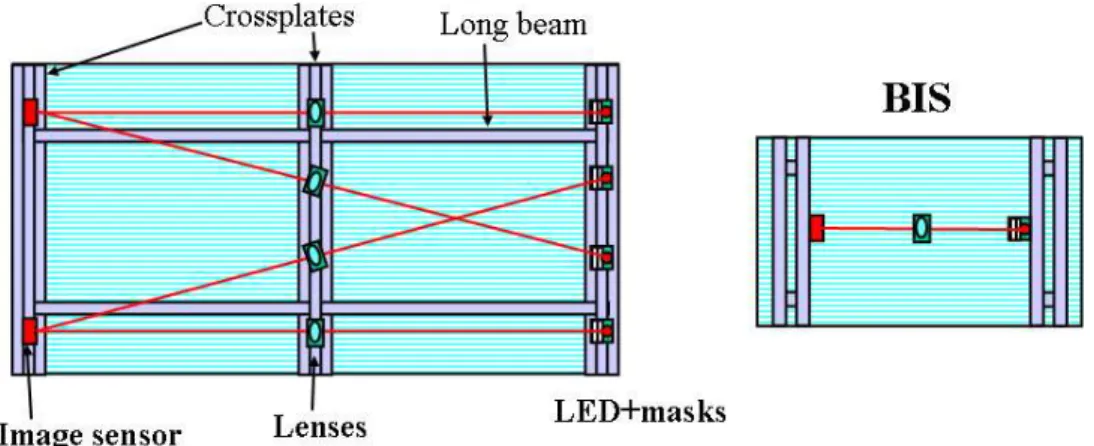
The inplane systems (4 RASNIK connecting the MDT cross-plates, see figure 7.) control the chamber deforma- tions. The praxial systems (2 short crossed RASNIK connecting 2 adjacent chamber corners, see figure 8) and the axial systems (interleaved, long RASNIK systems running along the chamber edges and spanning adjacent chambers) control the geometry of a each layer of 6 chambers which form half of a large sector.
Fig. 7: Implementation of the RASNIK sensors in the inplane systems for the standard barrel chambers (left) and the small BIS
chambers (right).
Fig. 8: Implementation of the RASNIK sensors in the praxial (lower level) and axial (upper level) systems.
Fig. 9: Left: Sketch of the projective system implementation showing the RASNIK sensor (mask, lens or image sensor), the extension plate and the platform glued on the outer tube layer of the MDT chambers. Right: Implementation of the RASNIK sensors in the Chamber to Chamber Connection (CCC) system, between BOS (top, carrying the camera) and BOL (bottom, carrying the four LEDs support) chambers.
A schematic layout of the various types of alignment sensors on the MDT multilayers is shown for a middle
layer of a standard sector (figures 10 and 11) and for the inner layer of a sector containing the calorimeter support
rail and feet (figure 12 and 13).
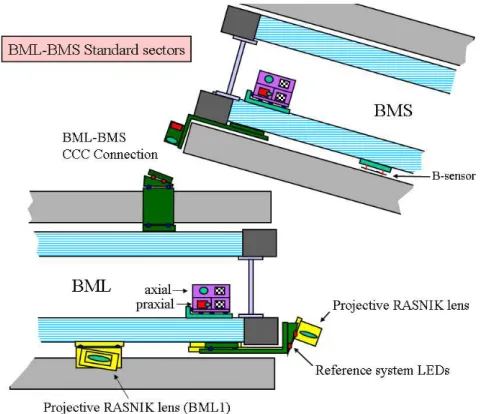
Fig. 10: Schematic layout of the barrel alignment sensors for a standard middle layer showing the implementation of the various types of sensors on the BML and BMS MDT chambers.
Fig. 11: Transverse view of the barrel alignment sensors on the BML and BMS MDT chambers.
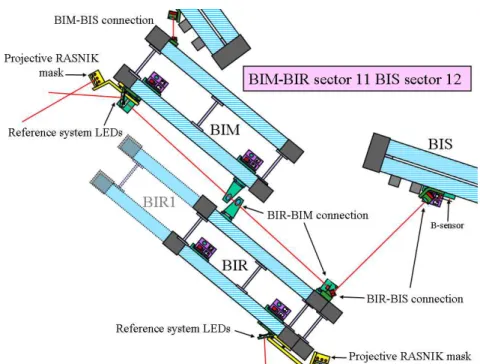
Fig. 12: Schematic layout of the barrel alignment sensors for an inner layer of a feet sector showing the implementation of the various types of sensors on the BIM, BIR and BIS MDT chambers.
Fig. 13: Transverse view of the barrel alignment sensors implementation for an inner layer.
The relative position of the chamber layers in the directions perpendicular to the projective direction (from the
IP), which is directly related to the measured sagitta of a high energy muon, is controlled by the projective system.
The projective system works with RASNIK systems, where BIL holds the mask, BML the lens and BOL the CMOS sensor. The number and location of the projective lines is constrained by the need to pass through the BMS layer. There are four lines on either side of a layer in each half sector as shown on figure 6. The RASNIK sensors are mounted on platforms glued with high precision on the MDT chamber tubes via extension plates (see figure 9).
The connections between the sensor and the extension plate and between the extension plate and the platform are made by means of triplet-ball systems. The geometry of the two triplets is measured with high precision with a Coordinate Measurement Machine (CMM).
The chambers of the small sectors are not equiped with projective lines and will be aligned with respect to the large chambers by using tracks going through the overlap region of adjacent small and large chambers. A first measurement of the relative position of the small with respect to the large chambers (at the level of 0.5 mm in absolute and 50 µ m in relative mode) is provided by the so-called chamber to chamber connections (CCC system). It consists of a SaCam camera on the small chamber looking at four target spots on the large chambers (see figure 9). There are 6 CCC connections (three on each side) between a layer of 6 large BIL or BML chambers and the neighboring layers of small BIS or BMS chambers, and 4 CCC connections between the BOL and the BOS layers.
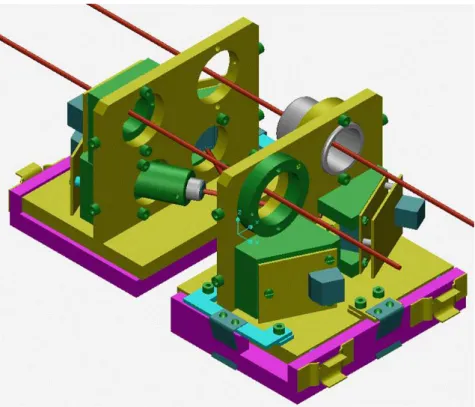
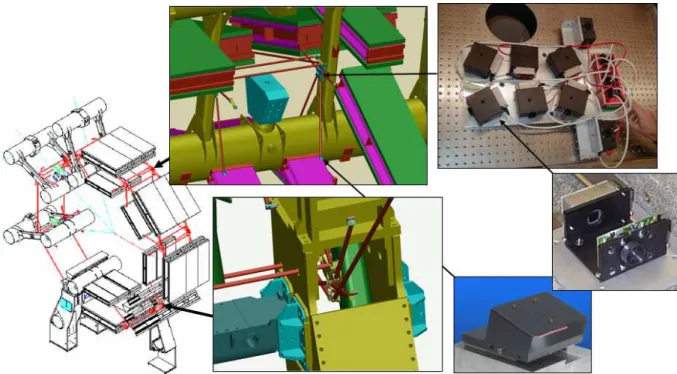
Simulations of the optical system behaviour with just the praxial and projective sub-systems have shown that higher order effects lead to significant errors on the track sagitta correction. For instance, the RASNIK projec- tive elements are not placed in the middle plane of the MDT chamber and hence do not provide a measurement corresponding to the average track measurement by the drift tubes. In order to control these effects, the relative orientation of the MDT chambers of different layers must be known with some precision (of the order of a few hundred µ rad). In addition, for applications like the magnetic field reconstruction out of the Hall probes mounted on the MDT chambers, the relative position of chambers surrounding a magnet coil has to be measured rather precisely ( ∼ 1 mm). These requirements are fullfilled by adding the so-called "reference system", which consists of plates mounted on the toroid ribs (4 plates per coil) carrying SaCam devices looking at targets placed on the neighboring BIL and BML chambers. Additionnal SaCam looking at targets placed on the neighboring plates (on the same coil and on two adjacent coils) make possible a 3D reconstruction of the reference plates position and hence of the coil position. The layout of the reference system is shown in figure 14.
Fig. 14: Layout of the reference system for one half of the barrel spectrometer (left). The implementation of the reference plate
carrying the SaCam sensors is shown for a standard coil (top) and for a coil embedded inside an ATLAS foot (bottom). Pictures
of the reference plate carrying SaCam cameras and the led target (on the chambers) are shown on the right.
In the two sectors modified by the presence of the calorimeter support rails, the inner layer is split into two sub-layers BIM and BIR at slightly different radii. In order to treat these two layers as one, a RASNIK based system, called BIR-BIM system, has been implemented to optically connect the BIR and the BIM chambers (see figure 12 and 13).
The number of optical systems of each type is given in table1 for the full barrel system.
Table 1: The 7 optical systems used for the barrel alignment.
Name Sensor Type Nb Alignment type Inplane RASNIK 2110 MDT deformations Praxial RASNIK 2006 Plane alignment
Axial RASNIK 1036 Plane alignment
Projective RASNIK 117 Tower alignment Reference SaCam 256 Link to the Toroid
CCC SaCam 260 Small/Large tower link
BIR-BIM RASNIK 32 BIR/BIM link
Total 5817
3.2 The calibration of barrel alignment sensors
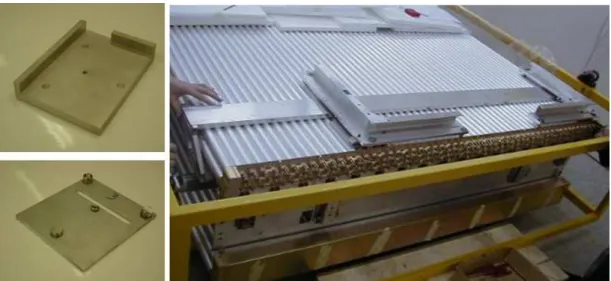
There is a large variety of sensors supports: platform glued on MDT tubes for praxials and BIR-BIM sensors, extension plates for projective sensors, CCC sensors and reference system LED sensors, reference plates mounted on toroid ribs for the reference cameras. The precision mounting on these supports is based on six (praxial) or three (for all the other sensors) precision steel ball systems (figure 15). The extension plates are themselves positioned via three ball systems on platforms glued on the MDT tubes. The platforms are glued with high precision on the MDT tube layers by means of template structures using the tube endplugs as a reference (see figure 15).
Fig. 15: Support platform for the praxial sensors (top left) and for the projective and BIR-BIM sensors (bottom left). The photo on the right side shows the positioning of two plateforms (projective and BIR-BIM) by using L shape template frames.
The position along the tube direction refers to the praxial platform mounted on the inner face of the multilayer by means of a calibrated ruler.
The position of the steel balls on the template structure and on the extension plates are measured with high pre-
cision (better then 10 µ m) by means of a well calibrated coordinate measurement machine (CMM). It is expected
that the position of the platform with respect to the MDT wires position is known with a precision of about 20-
30 µ m. Quality checks of the platform positioning have been performed using an X-ray tomograph for some of the
chambers. As shown on figure 16, although most platforms meet the requirement, a significant fraction ( ∼ 20%)
is wrongly positioned, with deviations up to more than 200 µ m. Due to the presence of these mis-positioned platforms, the barrel system can only reach the 30 µ m precision in relative mode, with respect to a well controlled reference geometry deduced from "straight track runs" (see section 5.2).
Fig. 16: Differences between the actual position of the platforms as measured by the X-ray tomograph and their nominal position, for a sample of praxial platforms mounted on BML chambers. During the measurement, the platform carries an accurate template structure with tungsten wires (controlled by CMM measurements) to create the x-ray shadows providing the measurement of the position. The nominal position of the platform is deduced from the position of the neighboring MDT wires also measured by the tomograph. The left figure shows the distribution of differences between the measured and the nominal positions along the z axis perpendicular to the MDT wire direction in the tube layer plane. The right figure shows the distribution of angular rotations around the y axis perpendicular to the MDT plane.
The platforms for the CCC and the reference system (LED target) are positioned directly on MDT tubes via a V shape profile, without a precision template tool. For these systems, a precision of about 200 to 400 µ m has to be assumed. It means that the relative position of the small and the large chambers (via the CCC system) cannot be known with enough accuracy for the sagitta measurement in the small sectors. Instead, the high precision on the relative position will have to be deduced from tracks traversing the overlap between neighboring small and large chambers (see section 5.1).
Depending on the goal of the calibration procedure, there are two types of calibration benches:
1. For praxial, axial and projective sensors, calibration aims at providing the position of RASNIK sensor ele- ments (mask/CMOS camera origin and orientation, lens optical center) with respect to the system of position- ing balls.
2. For the other systems, the response of the camera/LED system is registered while the elements are placed in their nominal relative position. The deviation with respect to this reference zero value is used later to determine the relative position of the camera and the LED target.
For the praxial system, the calibration is performed in two steps. First a reference zero value is registered by placing the two praxial elements of a pair (see figure 8) at their nominal relative position in a template structure.
There are 7 different templates corresponding to the 7 types of praxial sensors which are necessary to match
the various distances between adjacent chambers (from 19 to 400 mm). In a second phase, one of the Praxial
elements is placed on a fixed platform and the other one on a platform movable in all directions (3 translations and
3 rotations) through six precision step motors (see figure 17). The position in space of the movable platform is
measured by a set of 9 optical gauges (for redundancy) with a precision of a few microns. The zero position of the
mobile platform and of the gauges is obtained by matching the RASNIK readings with the zero values obtained
in the previous step. Then the RASNIK and the gauge readings are registered for a set of 72 movements of the
mobile platform combining translations and rotations. The positions of the 6 RASNIK elements (36 parameters)
are derived from a global fit to the data. Another set of random movements is performed for an independent check
of the predicted RASNIK reading using the fitted parameters.
Fig. 17: The top picture shows a view of the praxial calibration bench with one of the element mounted on a fixed platform and the other one on a platform movable in all directions by mean of six precision step-motors. The bottom picture displays a view of the projective calibration bench.
For projective RASNIK sensors and the axial sensors, the calibration makes use of a set of well calibrated template elements for which the position of the optical element within its support frame is known with a precision of a few µ m with respect to the positioning balls. Each template system is made of a mechanically precise square frame holding the RASNIK element. The position of this RASNIK element inside its frame is determined by comparing the RASNIK response for various rotations and translations of the template frame on a precision granite table. Once a set of templates has been calibrated for each type of RASNIK element, the actual sensors are calibrated by comparing their response with the one obtained with the corresponding template (see figure 17).
For the calibration benches of the second type, the sensors (camera or LED target) are mounted with high precision (<30 µ m) on a granite table according to the nominal geometrical configuration in the spectrometer.
The image is reconstructed and the corresponding parameters used as a reference for later use in the experiment to determine the deviation from the nominal configuration.
4 Data Acquisition System and reconstruction
4.1 The data acquisition system
Three custom made multiplexer stages are used as shown on the schematic Data Acquisition layout (figure 18).
The first level of multiplexing, the RasMuX placed on the MDT chamber, is a video and pixelclock multiplexer and controller for RasCaM and RasLeD. It combines the limited number of RasNiK components (ex: for BML3:
6 RasCaM and 8 RasLeD) of just one chamber. The second level of multiplexing will be the MasterMuX, which
combines the signals of a maximum of 16 RasMuXs. Figure 19 shows an example of the RasMuX-MasterMuX
implementation for the BO layers. The MasterMuX connect to the auxillary ATLAS cavern (called USA15 )
through ∼ 100 m long cables where more multiplexers (TopMuX) will finally deliver the signals to the PC-Based
Video Digitizers. This tree structure also distributes power and control from USA15 upwards into the system to the
RasCaM and RasLeD. The RasCaM video signals from the chambers are send downstream to USA15 over single
cable connections to/fro the various RASNIK subcomponents. The final image analysis is performed by a farm of
9 PCs in online mode. With an average analysis time of 0.5 second per image, one complete acquisition cycle lasts
about 10 minutes.
Fig. 18: Overview of the control and Data acquisition system for the RASNIK sensors (RasCam for the CMOS image sensors, Rasled for the LEDs, showing the three stages multiplexing system.
Fig. 19: Schematic drawing of the the RasMux and MasterMux layout for the standard BO layers.
4.2 The Barrel Alignment Reconstruction
After each cycle, the reconstructed image parameters are written into the ATLAS online Conditions Database. The
conversion of the parameters of the image into the position and deformation of the MDT chamber is done by the
alignment reconstruction programs ASAP. The main feature of this software package is its precise description of the
optical elements within the detector, taking into account all the individual sensor calibration constants which have previously been measured in the laboratories. Using this description, it converts the current sensor measurements into the position of the MDT chamber using standard fitting methods. The resulting data are stored into a table in the Conditions Database for later use by the muon tracking software packages.
ASAP (Atlas Spectrometer Alignment Program) is a C++ code, using the ROOT framework. The inputs are:
1. The description of the spectrometer geometry using the ATLAS standard muon spectrometer description.
2. The CMM measurements and calibration data of all the platforms, extensions and optical components used to mount the alignment system.
3. The current measurements of the optical sensors, which are read out from the Condition Database.
4. The survey results. A small fraction of the chambers, essentially all the chambers located at the extremity of a layer, is equipped with two reflective targets, the position of which can be determined in the ATLAS coordinate system with a precision of the order 1 mm.
5. The temperature measurements, read from the Condition Database filled by the Detector Control System (DCS).
The output of ASAP consists of 6 correction factors (3 translations and 3 orientations) which have to be applied to the nominal position/orientation of the MDT chambers. Furthermore, ASAP handles the MDT internal defor- mation, which consists of a set of 8 parameters (sagitta, torsion, trapezoidal effects as well as temperature-induced elongations). Thus, for each MDT, 14 parameters are written into the ATLAS Conditions Database for later use in the track reconstruction programs.
A Java server has been developped, which can be used to launch ASAP remotely and to visualize the status of the alignment fit via an internet web page.
4.2.1 The ASAP Program
The ASAP code can be devided into three main classes, which in principle, could be used for any optical alignment and calibration problem.
Class Element: The detector description is based on a class called the Element. An Element can be a CCD, an aluminum plate, an MDT etc. Each Element is defined by a name, an identifier (ID), its dimensions, its nominal (as in the engeneering drawings), true (for simulation) and corrected (after applying a shift parameter with respect to the nominal value) positions in space, its nominal, true and corrected rotation matrices and by its distortion parameters including thermal expansion. Furthermore, an Element can have "Daughter Elements". Daughters are Elements which are fixed to the mother. When the mother moves in space, the daughter follows that same movement. Daughters can themself have other daughters. This concept allows us to define a tree structure of the spectrometer description. Daughters are always defined in the coordinate system of the mother. An interesting feature is that trees of Elements can be created by using a custom made XML description.
Class Sensor: Each sensor contains an ID, a name, the current measurements, their offsets, the simulated measurements as well as the simulated offset. Furthermore, each Sensor has a list of all Elements it depends on and a matrix called "transfer matrix" which relates the simulated measurements to the positions of the Elements it depends on. This transfer matrix is a submatrix of the general transfer matrix used in the fit, which connects the response of all sensors to the detector geometry.
Class Alignment: The alignment fit is performed by using a custom made χ
2minimization routine, which has been optimized to gain speed. This is done using a fit based on the inversion of the general Transfer Matrix, which relates the optical sensor responses to the physical elements displacements. The fit also allows the use of constraint terms, like the results of the geometrical survey with their errors, which are mainly used to fix the coordinate system of the entire alignment setup. In addition, this procedure gives back relevant information, like the contribution of each individual sensor to the total χ
2, the number of iterations, the CPU time used, the list of the status of all sensors.
Visualization: For debugging the description of the alignment system, an appropriate visualization tool turned
out to be vital. A custom made interactive 3D viewer allows the display of the geometry and optical devices
implemented in ASAP (for an example, see figure 6. Alignment-specific features may be easily implemented, such
as elements coordinates and calibrations, or alignment corrections.
ASAP has been extensively tested during the ATLAS test beam period on the Barrel set-up (see Section 6). The different installation steps of the barrel spectrometer are followed up using ASAP fits (toroid deformation during the removal of the temporary assembly support and during the first test with current in the coils). The results of the simulation of the reconstruction of one muon spectrometer sector is presented in the next section.
4.2.2 First simulation results with ASAP
The reconstruction of the geometry of the upper sector of large chambers (sector 5) using the optical systems (prax- ials, axials, projectives and the neighboring reference plates) has been simulated in ASAP. It allows an assessment of the alignment system performance as a function of the assumed resolution of the sensors. In this first study, the resolutions of the sensors are given in table 2. The error on the positioning of the sensors on the chambers is supposed to be included in these resolutions.
Table 2: Assumed resolutions on the reconstruction of the image position on the CMOS sensors for the four types of optical systems used in the simulation of reconstruction of sector 5.
Sensor type Image position in x/y ( µ m) Magnification (x10
−3) Rotation around sensor axis z (mrad)
Praxial 20 2 0.5
Axial 20 2 1
Projective 20 2 1
Reference 2 0.01 1
From the sensor responses and errors, ASAP calculates the errors on the reconstructed position of the chambers.
The error on the reconstructed sagitta of straight tracks generated at the IP is then determined by propagating the error matrix on the position of the chambers. The results on the expected error on sagitta reconstruction is shown on figure 20. The error is smaller when the track traverses chambers connected to a projective line, which explains the two populations in the integrated distribution. In practice, in this absolute alignment mode, the larger than expected uncertainties on the position of the sensors will lead to larger sagitta errors. In the relative mode, as the intrinsic resolution of the sensors is much better than the one assumed in table 2, the errors on the difference between reconstructed sagitta for two different sets of misalignment configurations are expected to be smaller than the ones given in figure 20.
-1 -0.5 0 0.5 1 η
(rad)φ
1.3 1.4 1.5 1.6 1.7 1.8
sagitta error (mm)
0 0.005 0.01 0.015 0.02 0.025 0.03 0.035 0.04 Contribution to the error on sagitta coming from the alignment
sag_error Entries 100000 Mean 0.02074 RMS 0.005763
sagitta error (mm)
0.010 0.015 0.02 0.025 0.03 0.035 0.04
500 1000 1500 2000 2500 3000 3500 4000 4500
sag_error Entries 100000 Mean 0.02074 RMS 0.005763 Contribution to the error on sagitta coming from the alignment
Fig. 20: Expected contribution from the optical alignment to the resolution on the sagitta measurement calculated from a simulation of the sector 5 geometry reconstruction using the optical sensors with resolutions given in table 2. The left figure shows the sagitta resolution as a function of ( η , φ ) across sector 5. In this sector, due to the presence of the End Cap Toroid turret, the first projective lines at low negative η are missing, which explains the loss of resolution in the first chamber tower.
The right figure shows the integrated error distribution.
5 Alignment with Muon Tracks
5.1 Alignment with curved tracks
In the ATLAS muon spectrometer some elements are not optically linked, or the optical connection does not have the required precision for the sagitta measurement. During physics ATLAS runs, the elements which are not optically linked with high precision can be aligned, using muon tracks passing through overlap regions between the optically precisely aligned chambers and those which are not.
Examples of elements which are not optically linked: (1) BIS8 chambers, (2) BEE chambers (located on the outer ECT vessel), (3) the barrel with respect to the endcap, (4) the muon spectrometer with respect to the Inner Detector, (5) the small MDT towers in the barrel which are optically linked via the CCC sensors but not with the required precision (the expected precision from the optical measurement can be as large as 500 µ m mainly due to the poor positioning accuracy of the CCC platforms).
Tracks passing through the overlap between the precisely aligned large towers and the "not so well" aligned small towers can be used. First results from a full simulation study shows that 2000 muons with p
T= 20GeV per chamber overlap are required to reach a precision of 30 µ m on the position of the small chamber with respect to the neighboring large chamber. In this regime of multiple scattering dominated momentum measurement, this is equivalent to 1000 tracks with p
Tabove 10 GeV. The small chamber alignment precision and update frequency will depend on the luminosity L. For L = 10
33cm
−2s
−1, the expected muon rate is about 100Hz for p
T> 20GeV and 1kHz for p
T> 10GeV over the full barrel spectrometer acceptance. As about 10% of the 20 GeV muons tracks coming from the IP crosses at least one chamber overlap, an alignment at 30 µ m accuracy will require about 4 hours of data taking.
For all the cases (1) to (5) mentionned above, the alignment procedure is performed in two steps: (i) a first regular alignment fit is performed using the optical data only; (ii) the output of this first fit is used by the tracking algorithm which determines in the overlap region a set of "pseudo-track-sensors" defined as the difference between a track segment measured in the badly aligned chamber and the segment built from the propagation to this chamber of the segment measured in the well aligned chamber. In a second alignment fit, both the optical and the "pseudo- track-sensors" are used to calculate the final alignment parameters for the badly aligned chambers.
In the alignment of the Muon Spectrometer with respect to the Inner Detector (ID), the "pseudo-track-sensors"
are built out of the difference between the segments measured in the inner muon station and the ones extrapolated from the ID track through the calorimeters.
In addition to the above procedures, a method to align the chambers (almost) independently of the optical system has been developed. It is based on the additional constraint provided by the angular measurement of each MDT chamber (resolution ∼ 200 mrad) [5]. The angular difference between segments in BIL and BOL provides a momentum measurement independent of the sagitta measurement. Another independent estimate of the momentum is provided by measuring the track curvature in chamber BML alone. Adding this additional measurement, although it is not precise, provides a contraint on the relative angular position of BIL and BOL chambers. By combining these measurements and provided that the BML internal geometry can be controlled at the required level ( ∼ 30 µ rad and 10 µ m between the two multilayers), one expects an alignment accuracy at the level of 100 µ m with 100 000 tracks per chamber tower ( ∼ 8 hours of data taking at L = 10
33cm
−2s
−1).
5.2 Alignment with straight tracks
In the barrel, only a small fraction of the positions of the sensor support platforms has been measured and con- trolled by the tomograph or by dedicated optical devices. As discussed in section 3.2, it is likely that a significant fraction of them lies outside the required positioning accuracy, thus jeopardizing the validity of the absolute barrel alignment. For the relative alignment to work, it is necessary to start from a reference spectrometer geometry where the position of the chambers is such that the requirement accuracy of 40 µ m on the sagitta is met. In addition, an independent test of the achieved alignment accuracy is needed. For these purposes, it is foreseen to run for some periods without magnetic field in the toroids, while the solenoid is at full field. This will yield straight tracks in the muon system, which can be tagged to be above a certain p
T(e.g. 10 GeV) to limit multiple scattering. If the cham- ber alignment were perfect, the measured sagittas would be centered around zero, the variance being determined by the multiple scattering and the resolution on the position of the chambers. Significant deviations from zero in certain η – φ regions would point to errors on the position of the chambers as obtained from the optical alignment.
In these regions, a combined fit of the optical and "pseudo-track-sensors" will yield a reference geometry with
respect to which the optical system will provide the relative displacements.
station index
1 2 3 4 5 6
m]µ [σ
0 10 20 30 40 50 60 70 80
Sagitta correction
Large Sector Small Sector