Study on the Performance of Thin-Gap Resistive Plate and Muon Drift Tube Chambers for the ATLAS Experiment at the HL-LHC
C ATRIONA B RUCE
Technical University of MunichMaster Thesis
Technical University of Munich Arcisstraße 21, Munich
Physics Department
Max Planck Institute for Physics (Werner Heisenberg Institute) Föhringer Ring 6, Munich
Master Thesis
Study on the Performance of Thin-Gap Resis- tive Plate and Muon Drift Tube Chambers for the ATLAS Experiment at the HL-LHC
Catriona Bruce
Abgabetermin:
test16. April 2019 Prüfer:
testDr. Oliver Kortner
Ehrenwörtliche Erklärung
Ich erkläre hiermit ehrenwörtlich, dass ich die vorliegende Arbeit selbstständig und ohne Benutzung anderer als der angegebenen Hilfsmittel angefertigt habe; die aus fremden Quellen (einschließlich elektronischer Quellen) direkt oder indirekt übernommenen Gedanken sind ausnahmslos als solche kenntlich gemacht.
Munich, 16. April 2019
Catriona Bruce
Study on the Performance of Thin-Gap Resistive Plate and Muon Drift Tube Chambers for the ATLAS Experiment at the HL-LHC
Catriona Bruce
Technical University of Munich
Abstract
Muon chamber technologies are studied in the context of the upcoming ATLAS detector upgrade for the high-luminosity LHC. The efficiency and resolution of a prototype thin-gap triplet resistive plate chamber (RPC) is derived from 2017 muon test beam data.
The response of the RPC, which has a nominal gas gap voltage of 5600 kV, is evaluated across a voltage range 4400 to 6000 kV. The time resolution is around half a nanosecond.
The spatial resolution is around 1 cm.
Then, the muon tracking resolution and muon efficiency is derived for a Monitored Drift Tube (MDT) chamber operated with a new amplifier-shaper-discriminator (ASD) chip that is intended for installation on all existing ATLAS MDTs. The data was gathered in 2018 in a muon beam and gamma irradiation facility. Applying the maximum expected HL-LHC gamma background was associated with a 1% efficiency loss and 40 µm resolution loss compared to muons alone. A much higher gamma background of 240 kHz/channel (2 kHz cm
−2) was associated with a further 5% efficiency and 130 µm resolution loss.
The conclusion of the tests is that both the new RPC design and the new ASD chip meet
the requirements for the ATLAS upgrade.
Contents
1 Introduction 1
I Coming upgrade of the ATLAS Muon Spectrometer (MS) 3
2 Physics at ATLAS 5
2.1 Past and current searches 5
2.1.1 Prospects for physics at HL-LHC 6
2.2 Introduction to the ATLAS detector 6
2.3 Muon system performance requirements 8
2.3.1 Efficiency 8
2.3.2 Resolution 9
2.3.3 Mitigating performance loss in the HL-LHC 9
3 Tracking and triggering in the MS barrel region 11
3.1 Event and background rates at |η | < 2 . 7 12
3.2 Tracking: Monitored drift-tube chambers (MDTs) 12
3.2.1 Chamber design 13
3.2.2 Signal generation in MDTs 15
3.2.3 Measurement of MDT pulses 18
3.3 Triggering: Resistive plate chambers (RPCs) 19
3.3.1 Chamber design 20
3.3.2 Signal generation and measurement in RPCs 21
4 Muon and gamma facilities for detector development 25
4.1 Super Proton Synchrotron beam facilities 25
4.2 Gamma Irradiation Facility++ 26
II ATLAS RPC: Thin-gap triplet muon test in H4 at SPS 27
5 Overview 29
5.1 Test set-up 29
5.2 Analysis recipe 31
5.2.1 Finding the beam 31
5.2.2 Timing calibration 31
Contents
5.2.3 Cluster-finding 31
6 Results 35
6.1 Efficiency 35
6.2 Spatial resolution 35
6.3 Time resolution 36
6.4 Cluster structure and signal properties 36
III ATLAS MDT: test chamber irradiation in GIF++ at SPS 41
7 Overview 43
7.1 Test set-up 43
7.1.1 Applied voltage and chamber grounding 45
7.1.2 Front-end electronics: chamber signal processing 45
7.1.3 Muon beam and trigger 47
7.1.4 Back-end electronics: on-line data acquisition 47
7.1.5 Data quality monitoring 48
7.2 Off-line processing of the raw data 48
7.2.1 Pre-processing into ROOT event frames 48
7.2.2 Auto-calibration of the distance–drift-time relation 49
8 Results 51
8.1 Determining photon conversion rate 51
8.2 Efficiency 52
8.3 Spatial resolution 54
9 Thesis Summary 59
9.1 RPC key results 60
9.2 MDT key results 60
Bibliography 64
List of Figures 66
CHAPTER ONE
INTRODUCTION
In 2026, the Large Hadron Collider (LHC) at CERN will begin its fourth run as the upgraded high- luminosity HL-LHC, with substantially increased peak instantaneous luminosity of L = 7 . 5 × 10
34fb
−1. Over the following twelve years, the ATLAS experiment is expected to collect more than 3000 fb
−1of collisions, far beyond the detector’s design value[1]. As a result, much of the detector hardware will be replaced in numerous upgrade projects. Installation work will be split into two phases, with Phase I underway since January 2019, and Phase II beginning in 2023. Performance requirements quantifying the detectors’s sensitivity to key processes are dictated by the foreseen physics program.
ATLAS has a dedicated system of gaseous detectors for muon triggering and tracking that spans the outer reaches of the detector. Major upgrades are planned in targeted areas to improve geometrical coverage, increase radiation hardness, and overhaul the trigger system. These include installing a layer of thin-gap resistive plate trigger chambers (thin-gap RPCs) and replacing the front-end electronics of the precision muon drift-tube chambers (MDTs). Upgrade plans for the muon system are laid out in the comprehensive Technical Design Report[2].
This thesis presents the results of tests of a full-size prototype thin-gap RPC and a performance
study of the new amplifier-shaper-discriminator (ASD) chip for the MDTs chambers. Both tests
were performed using muons from CERN’s Super Proton Synchrotron. The MDT equipped with the
ASD chips was exposed to various levels of γ radiation to mimic foreseen background conditions in
the ATLAS muon system at the HL-LHC. I begin with a look at the requirements on muon system
hardware for physics at ATLAS.
Part I
Coming upgrade of the ATLAS Muon Spectrometer (MS)
CHAPTER TWO
PHYSICS AT ATLAS
2.1 Past and current searches
As of the end of the most recent data-taking run in late 2018, the general-purpose ATLAS detector has collected ≥ 150 fb
−1of data from proton-proton LHC collisions at energies of 7 TeV, 8 TeV and 13 TeV. ATLAS is suited to observe physics involving the most massive particles accessible at LHC energies.
One of the primary original goals of ATLAS was the search for the Higgs boson[3]. In 2012, alongside a complimentary paper from the CMS collaboration, ATLAS announced the observation with 5.9- σ significance of a massive scalar resonance at (126.0 ± 0.6) GeV using the two-photon and four-lepton final states. Following investigations into more channels and confirmation of no spin, the resonance is now widely considered to be the Higgs boson of the Englert-Brout-Higgs mechanism, which gives mass to the gauge bosons W and Z and to the elementary fermions, preserving the SU( 2 ) N
U ( 1 ) symmetry of the electroweak Lagrangian density[4]. Subsequent Higgs observations included V H production and H ττ decay modes. In 2018, it was confirmed that the Higgs couples to the third generation fermions, but currently, too little data has been collected to say whether, as predicted, the second generation quarks also couple to the Higgs.
The Higgs program at ATLAS now focuses on investigating various known Higgs channels, for example vector boson fusion to Higgs, which is sensitive to anomalous Higgs couplings. Self-coupling will only be accessible with the full HL-LHC data-set[5].
ATLAS also produces a large amount of top quarks, the heaviest-known elementary particle, and the
only quark to decay before it hadronizes. Top physics is a large part of the physics program with
several measurements delivered[6], and in 2018, ATLAS completed its first high-precision W mass
measurement, using only Run 1 data[7].
2 Physics at ATLAS
The physics program further includes new particles predicted by beyond-Standard Model theories, with several supersymmetry (SUSY) and dark matter scenarios being searched, among more generic theories. So far, no significant excesses have been found for any exotic particle.
2.1.1 Prospects for physics at HL-LHC
In 2015, ATLAS and its sister experiment, CMS, formally agreed with the CERN council to support and participate in a significant luminosity upgrade to the LHC. The upgrade will allow greatly reduced statistical errors on Higgs measurements, having greatest impact on rare channels. The LHC high-luminosity upgrade is a focal point for high-energy physics in the coming decades, a sentiment reflected in the 2013 European Strategy for Particle Physics Update, which stated that the LHC is in “a unique position” to pursue Higgs physics and that “Europe’s top priority should be the exploitation of the full potential of the LHC, including the high-luminosity upgrade of the machine and detectors”
[8].
The ATLAS Muon Spectrometer (MS) will continue to be of vital importance for rare physics programs in ATLAS. The tests of new muon-chamber electronics detailed in this thesis have been done as part of the extensive preparatory work for the second phase of the upgrade, which will begin in 2023.
The remainder of this chapter introduces the ATLAS detector and key features. The terminology introduced here will be helpful to describe the physics motivation underlying the upgrade. Detailed description of the spectrometer components follows in Chapter 3.
2.2 Introduction to the ATLAS detector
The ATLAS detector (Figure 2.1) is a multi-purpose particle detector. It is roughly cylindrical and forward-backward symmetric, therefore it uses both a right-handed coordinate system with the origin at the nominal interaction point ( z along the beam pipe, y pointing vertically up, and x along the LHC radial line) and a cylindrical coordinate system (radius around z , r , the azimuth to z , φ , and the polar angle, θ ). Pseudorapidity η = − ln tan (θ/ 2 ) is often used instead of the polar angle θ .
ATLAS can be conceptually divided into sub-detectors layered roughly concentrically around the
beam pipe, closed off by disc-shaped sub-detectors at the ends. The major sub-detectors are, in order
of increasing size, the Inner Detector (ID), the calorimeters, and the Muon Spectrometer (MS). Each
consists of a great number of discrete modules. The modules used at any (η, φ) have been chosen
according to the local mechanical situation, local radiation conditions, and physics performance
requirements for that region with respect to the interaction point. The end-caps, which are responsible
2.2 Introduction to the ATLAS detector
Figure 2.1: The ATLAS detector.
for the challenging but interesting forward regions η ' 1 . 0, use different detector technologies and designs to achieve comparable performance to the barrel sectors.
Each particle and physics object has a “typical” signature in ATLAS, depending on its interactions with the various detector media. The ID tracks electrically charged particles in a solenoidal magnetic field. The ID solenoid provides a 2 T axial field, with typical bending power 2.1 T m. The ID itself is a compact, high-granularity sub-detector covering |η | ≤ 2.5. It currently consists of four sub-modules:
the new, innermost beauty tracker called the Insertable B-Layer, the n
+-in-n silicon Pixel Detector, the p-in-n silicon Semiconductor Tracker, and the straw-tube Transition Radiation Tracker. During the Phase II upgrade, the original part of the ID will be replaced by the new all-silicon Inner Tracker, which will extend coverage to |η | ≈ 4 [9].
The calorimeters have high stopping power and consist of dense lead or iron absorber layers interleaved with an active medium. The Electromagnetic Calorimeter and forward region calorimeters use liquid argon as their active medium and are suited for measuring electrons and photons by creating electromagnetic showers, and then detecting the ionization yield. The Hadronic Calorimeter (Tile Calorimeter) uses plastic scintillators as its active medium in the barrel region and liquid argon in the end-cap region, and is suited for measuring hadrons by creating hadron showers through strong and electromagnetic interactions.
More complete technical descriptions of the ID and calorimeters can be found in [3], [10], and [11].
2 Physics at ATLAS
Muons pass with small energy loss through the solenoidal field of the ID and the absorbers of the calorimeters. The MS, shaded in blue in Figure 2.1, complements the ID, tracking the muon over a greater distance in a toroidal field. The 0.5 T air-core toroid magnets (orange) provide a typical bending power of 3 T m in the barrel and 5.6 T m in the end-caps. Precision η bending measurements are made by three concentric layers of drift tubes chambers: gaseous detectors for precision spatial measurements of ionizing particles. Drift tubes have moderate channel density, low production costs, and are sufficiently robust that they are a usual choice for covering large areas. As well as the ≈ 1200 tracking chambers, the MS contains specialized, fast trigger chambers for timing and triggering.
Relevant technical details about the MS timing and trigger chambers and their operation and readout will follow in Chapter 3; for more detail the ATLAS detector paper can be consulted[3]. Chapter 3 also introduces the upgrade development work done in this thesis. The remainder of this chapter summarizes the standards used to benchmark the muon system performance, which will help put the work into perspective.
2.3 Muon system performance requirements
Key system performance parameters for the muon system are the efficiency with which muon tracks are reconstructed and the momentum resolution of the tracks. Muon momenta measurements are key to much of the physics at ATLAS, and performance calculations are directly used in searches to reduce systematic errors. The track reconstruction itself has a data-driven efficiency correction and uses both ID and MS muon tracks. Therefore, there is only an indirect link between system-level and chamber-level efficiency and resolution.
Momenta are determined by bending the muons in a known magnetic field, first the solenoidal field of the ID, and then the toroidal field of the MS.
2.3.1 Efficiency
The reconstruction efficiency of an identification algorithm is the probability that it successfully
reconstructs a muon. [12] gives the reconstruction efficiency as a function of η for different muon
selections: over 98% for loose and medium cuts and 90-98% for tight cuts. Effects due to the detector’s
geometric coverage, magnetic field mapping, and an instance of poor chamber alignment can be seen
in the data. Efficiencies are found by a tag-and-probe method with ID muon tracks, and are used for
data-driven calibration of the simulated detector response.
2.3 Muon system performance requirements [12] concludes that the efficiency is found to be independent of pile-up, at least so far. Hardware aging, which is not well predicted, is expected to have the greater impact on detector performance. A seven-fold increase in system occupancy may also have an impact. The overall system occupancy can be regulated via detector granularity and single-channel dead time.
2.3.2 Resolution
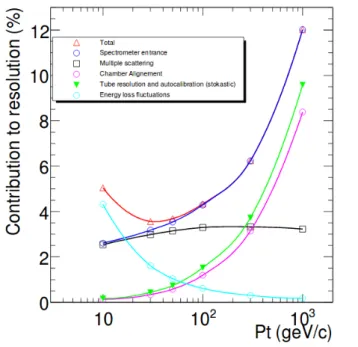
The resolution on a momentum measurement encompasses multiple scattering uncertainty, the intrinsic resolution of the tracking chambers, uncertainty in the relative positions of the muon chambers, magnet coils, and interaction vertex, and uncertainty in the magnetic field map [13][12]. Energy loss to the calorimeters also fluctuates; for muons found by combining ID tracks and MS tracks, Monte Carlo simulations can be used to correct for this fluctuation.
The overall system resolution ( p
T-dependent) is derived from the invariant mass resolution in dimuon channels, after applying a momentum calibration, and is in good agreement with simulations [13].
Resolution requirements vary for different applications, however a good benchmark for the muon system is around 3% p
Tfor low- p
Tmuons, rising to 10% p
Tfor 1 TeV muons. For a 10 GeV muon, the benchmark resolution is 1 keV, and the track must be known with a precision of 60 µm.
Figure 2.2 breaks down the stand-alone resolution of the MS. The MS has optical chamber alignment, and systematic alignment uncertainties are on the order of 30 µm. The magnetic field map is generally well known from magnetic modeling. Particularly in the transition region between the barrel and end-cap toroids, the field is highly non-uniform, giving much larger bending-power uncertainties than elsewhere. The intrinsic resolution of a single drift tube is a function of production quality of each tube and the sum of fluctuations in the signal generation and processing chain.
At high- p
T, the tube resolution and chamber alignment are the largest contributors.
2.3.3 Mitigating performance loss in the HL-LHC
Physicists will enjoy greatly increased statistics for precision measurements and searches for rare processes. However, the upgrade to the HL-LHC will cause the total number particles produced over the lifetime of ATLAS to rise far beyond the design value. This is likely to affect both single-channel resolution and efficiency and system resolution and efficiency (if the trigger or data acquisition cannot cope).
In mitigation, new tracking and trigger chambers will be installed. This will allow the existing trigger
chambers to be operated at reduced voltage to protect them from aging. Additionally, the entire
currently installed front-end electronics will be replaced during the Phase-II upgrade to allow for a
2 Physics at ATLAS
Figure 2.2: Contributors to the stand-alone MS reconstructed resolution.
new trigger scheme, which allow for a ten times higher first level trigger rate and an about four times longer latency than the current scheme. Both new types of chamber are more granular than their predecessors, the new trigger chambers having smaller read-out strip pitch, and the new drift tubes having smaller radius.
Performance results of the new trigger chambers at nominal and off-nominal voltages are presented in Part II of this thesis, specifically single-channel efficiency and time and spatial resolution. Part III contains single-channel efficiency and spatial resolution data for all operating modes of the new drift tube electronics at various irradiation rates.
Technical details of the upgrade chambers are provided in Chapter 3.
CHAPTER THREE
TRACKING AND TRIGGERING IN THE MS BARREL REGION
The particle flux at detector modules is of key concern in almost all aspects of the design and operation of ATLAS. There are two categories of specialized muon chambers in ATLAS: trigger chambers for fast timing and tracking chambers for position measurements. The development of a signal in the trigger chambers is very fast, and the simple signal processing requires a rather short conversion time.
The tracking chambers, meanwhile, operate in drift mode and have much longer signal development time and sampling window. The signal also has a relatively long conversion time, largely due to an (optional) long charge integration window.
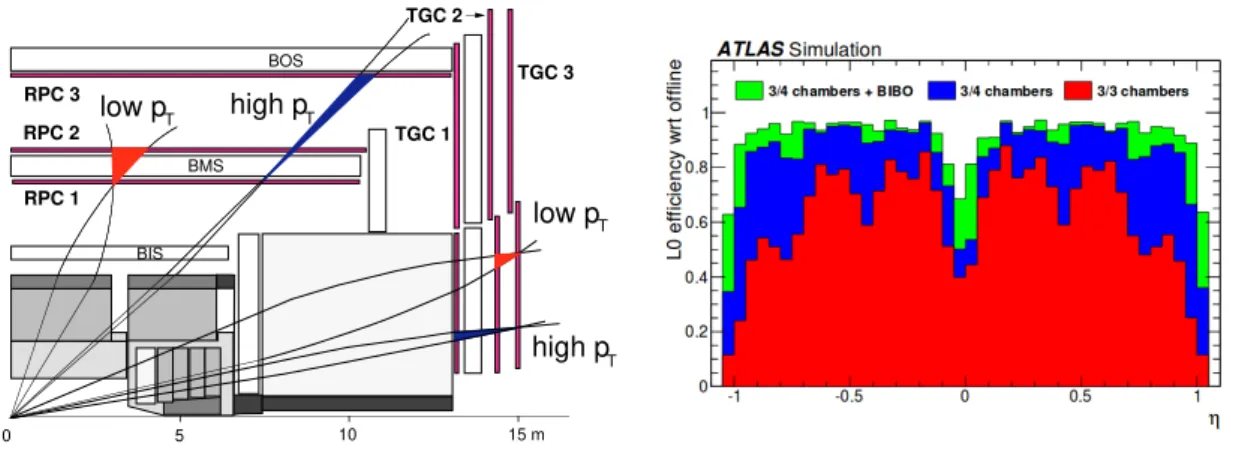
The hardware-based Level 1 Muon Trigger looks for coincident hits in trigger chambers in different layers of the MS. The current trigger logic requires coincidence in two out of the three layers of the MS (on and between the eight coils of the toroid magnets). Currently, geometrical acceptance in the barrel region is only 82%, due to acceptance holes Figure 3.1(a)). This will be further reduced with the removal of the special trigger towers (introduced in Run 2) which have poor selection and a high fake rate. Additionally, existing chambers will be operated at a lower voltage to avoid dangerously high chamber currents in the HL-LHC environment. Figure 3.1(b) shows the simulated worst case scenario for acceptance × reconstruction efficiency of the existing trigger system in the HL-LHC environment for several trigger coincidences. This scenario would see the single-hit efficiency reduced by 15% to 35% at large η .
To meet the demands of the HL-LHC environment, a large upgrade to the trigger system is planned[14].
Areas with poor acceptance will be strengthened by the Phase I pilot project BIS7/8 (Barrel Inner Small model for sectors 7/8)[2]. The Phase II muon trigger project will install an additional layer of trigger chambers to mitigate efficiency loss from reducing the legacy chamber operating voltages.
The overhauled muon system will rely on continuous read-out of the tracking chambers to a central
buffer. All tracking chamber front-end electronics will therefore be replaced to support continuous
read-out.
3 Tracking and triggering in the MS barrel region
low pT
high pT
5 10 15 m
0 RPC 3 RPC 2
RPC 1
TGC 1 TGC 2
TGC 3
low pT high pT
BOS
BMS
BIS
(a) Level-1 muon trigger scheme. (b) Worst-case trigger efficiency scenario for HL-LHC con- ditions without installation of new BIS7/8 and BI chambers.
Figure 3.1: The existing muon trigger suffers from geometrical acceptance holes.
This section briefly introduces the technologies used for tracking and triggering in the MS barrel.
Familiarity with the concepts and terminology introduced here will be helpful to appreciate the test results presented later. I begin by considering the particle environment in the MS barrel region.
3.1 Event and background rates at | η | < 2.7
The muon flux is more-or-less constant across the pseudorapidity range. Muons have a long lifetime compared to the size of ATLAS (2 µs) as they decay exclusively via the weak interaction. The flux can be divided into prompt and background muons, where the muon background originates mostly from decays prior to or within the calorimeter and partly after the calorimeter from hadronic
“punch-through” cascades. Production of prompt muons is dominated by low p
Tpion and kaon decays and, for p
T> 8 GeV muons, by heavy flavor hadron decay.
Additional background consists of Compton electrons, photons, and spallation neutrons and protons from showering in the shielding and calorimeter absorber (2.7 to 4 kHz cm
−2). These background sources are uncorrelated (in time) with the proton-proton collisions and are referred to as “cavern background”.
3.2 Tracking: Monitored drift-tube chambers (MDTs)
There are three layers of tracking drift-tube chambers in the barrel of the MS, currently (Run 2) totaling
1150 chambers and 354k channels, located on and between the eight coils of the toroid magnets.
3.2 Tracking: Monitored drift-tube chambers (MDTs)
Figure 3.2: Drawing of an ATLAS MDT tracking chamber.
The tracking chambers measure only the bending direction coordinate η . Their resolution is directly related to the eventual achieved muon resolution. To a lesser extent, the efficiency of signal collection from individual chambers feeds into the overall reconstruction efficiency (the reconstruction expects less than 100% efficiency)[13].
During the Phase II upgrade, the front-end electronics of all existing MDT chambers will be replaced with new electronics essentially replicating the design of the current electronics but in newer technology.
Part III of this thesis presents performance studies of the new amplifier-shaper-discriminator (ASD) chip for the MDT read-out. In particular, performance at various γ -background rates and discriminator thresholds is studied.
3.2.1 Chamber design
A standard MDT chamber is depicted in Figure 3.2. The aluminum frame typically supports several
hundred glued aluminum tubes in three or four layers. Each tube is strung with a central wire carrying
a high voltage of around 3 kV relative to the grounded tube wall. Precision in the positioning of the
wire and tube gluing is crucial to the eventual chamber resolution; 20 µm accuracy is obtained using a
precise reference surface.
3 Tracking and triggering in the MS barrel region
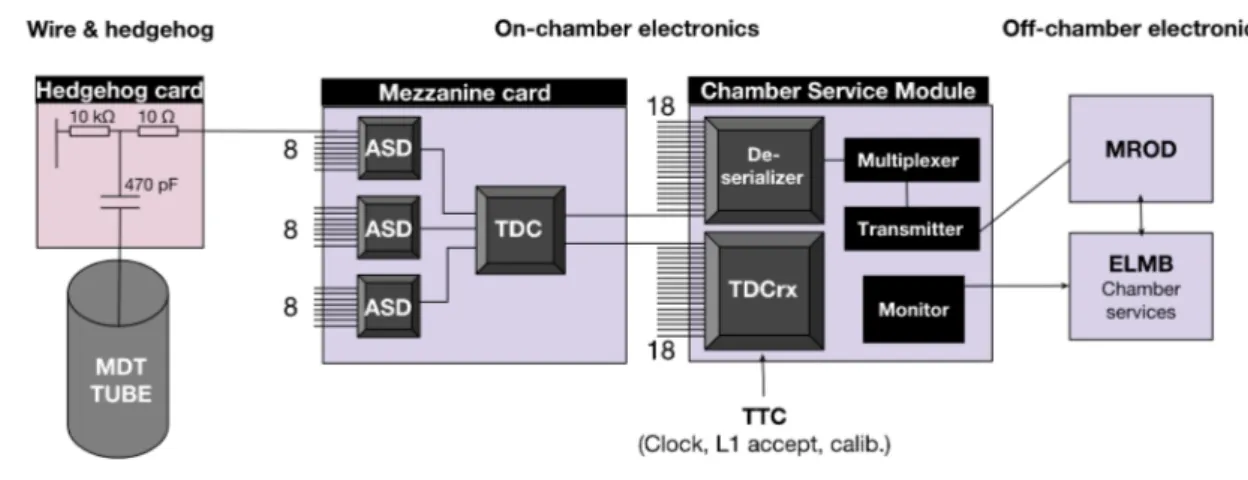
Figure 3.3: Data read-out chain for MDT chambers in ATLAS.
The original chambers have tubes with 30 mm diameter up to 2 m in length. New small-MDT (sMDT) chambers have 15 mm diameter. The spatial resolution of both chamber technologies is σ
chamber≈ 40 µm. The rate capability is ≈ 1 kHz cm
−2for MDTs and eight times greater for sMDTs, due to their smaller cross-sectional area.
Hedgehog boards at each chamber end separate the high-voltage wires from the front-end electronics, where current signals are amplified and converted by ASD and time-digital-converter (TDC) chips.
The front-end electronics are mounted on a mezzanine card and shielded with chromated aluminum Faraday cages; grounding is via the Hedgehog board and bottom plates of the Faraday cage. The chambers also carry monitoring devices (optical position sensing and temperature measurement).
Read-out scheme
The read-out scheme is shown in Figure 3.3. The Hedgehog board on the read-out end has a wire
terminating resistor, high-pass filter and a 470 pF leaded decoupling capacitor, with a 24-pin connection
to mezzanine board. The chamber electronics are centrally controlled by MDT read-out drivers
(MRODs), on the far-right of the figure, in the USA15 cavern, assembling event data for up to six
chambers each. The MRODs also perform sampling for on-line data quality control, via Embedded
Local Monitoring Boards (ELMBs) and Chamber Service Modules (CSM). The ELMBs monitor local
temperature, B-field and voltage status via distributed sensors and can configure the CSMs. The CSMs
are the on-chamber processor/multiplexers responsible for multiplexing serial data and distributing
control and timing signals to the mezzanine cards.
3.2 Tracking: Monitored drift-tube chambers (MDTs)
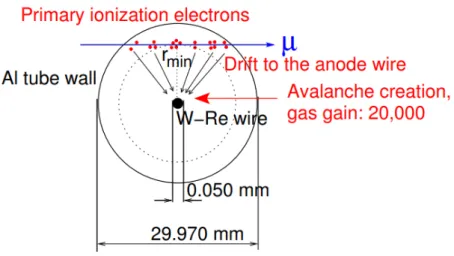
Figure 3.4: Generation and drift of primary ionization clusters in an MDT tube. At low radius, a threshold-level signal consists of primary ionizations originating from a wider “band” than at the tube wall, due to the greater curvature.
3.2.2 Signal generation in MDTs
The drift tube detection mechanism operates on the ionization of gas by the transfer of kinetic energy from the muon to a bound electron. ATLAS MDTs are filled with Ar/CO
2( 93 : 7 ) . A key quantity is the average number of primary ionizations per unit length, which is related to the electronic stopping power of the gas (average energy loss per unit length).
An applied electric field causes electrons to drift to the anode wire and ions to the tube wall. The drift velocity of charge carriers and the gas gain determine the eventual signal. The mean drift velocity E(r) ∝
1ris given by v (r ) = k E(r ) ≈ 30 µm s
−1where k is mobility and E is electric field strength[15].
The mobility k accounts for the diffusive effect of random thermal collision. Because of diffusion, the drift-time relation is not quite linear but depends on the gas mixture. The drift-time relation of a particular tube can be determined to good precision by inspecting the spectrum of obtained drift times.
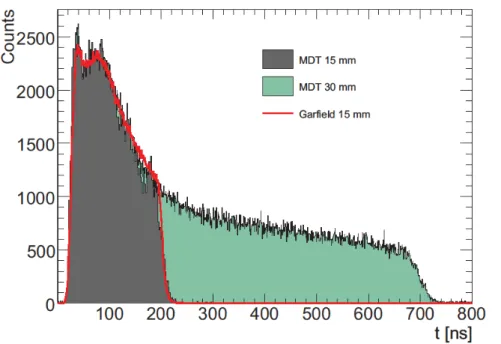
Drift times in a standard 30 mm MDT typically range from 0 to around 750 ns.
Figure 3.4 depicts the ionization and drift processes. The typical MDT drift-time spectrum is shown
in Figure 3.5. The key to MDT measurements is to obtain the muon’s radius from a measured drift
time using a known (hit-radius) distance–drift-time relation. The precision with which this can be
done for a real drift tube is affected by many factors; the most important are introduced here. Different
contributors to the single-tube resolution are later identified in the test data (Chapter 8). Ideally, the
distance–drift time relation should be as close to linear as possible.
3 Tracking and triggering in the MS barrel region
;
Figure 3.5: Real drift-time spectra of MDTs (green) and sMDTs (gray), plus a GARFIELD simulation for an sMDT (red line).
Intrinsic resolution
The discriminator threshold is equivalent to the signal typically produced by fifteen primary ionizations.
Given constant primary ionization density, primary ionization clusters are created along a straight line through the tube. The trail left by muons passing closer to the tube wall better approximates the underlying circle of constant radius. Equivalently, muons closer to the wire generate primary clusters at a greater range of radii. This causes the tube resolution to increasingly deteriorate for lower hit radii.
Induction and transmission
A detailed treatment of signal induction on the anode wire surface is given in [15]. The movement of ions away from the wire induces electronic movement in the wire that can be read out as a current signal. The amplitude of the current signal depends on the acceleration and mass of the ion cluster.
The gas gain (gas choice, operating voltage) was an important design choice for MDTs.
The initial current signal should be carefully handled to preserve the time information on it’s journey
to the time digitizer. The signal propagates along the wire, encountering impedance at the wire
3.2 Tracking: Monitored drift-tube chambers (MDTs) termination and at the point where it is loaded onto the front-end electronics circuit board. To minimize reflections, the termination resistor matches the cable impedance.
Space-charge effects: gain drop
The electrodynamics of the applied voltage and charge carriers in the tube can vary the gas gain and thus the drift time. Very close to the wire surface, the field is strong enough to induce avalanches from the primary ionization clusters. All hits in drift tubes create space charge around the produced ions, but particularly near the wire surface. Drops in gas gain due to space charge lower the signal amplitude and delay the threshold crossing. In [16], this situation is modeled by setting up a cylindrical electrostatics situation: a tube with some ion-induced space charge, a linear charge density in the anode wire, and a known potential difference between the anode wire and the tube wall. The space charge density in the solution is related to the particle flux through the primary charge deposition, gas gain, and ion drift velocity.
Photons produced in interactions of collision products with shielding, structural and detector material constitute a majority of hits in ATLAS MDT chambers. Photons are mainly converted in the tube wall to δ -electrons, which produce their own ionization trails across the tube. Gain drop increases with irradiation rate[16].
Space charge fluctuations
Resolution degradation above 5 mm is linked to electron drift velocity in the non-linear gas mixture.
For hits below 5 mm radius, the distance–drift-time relationship is approximately linear (i.e. is independent of electric field strength). The average drift velocity of ionization clusters originating beyond 5 mm drops off continuously with radius (i.e. is dependent on electric field strength), and the distance–drift-time relation is more strongly affected by fluctuations of electric field due to space charge fluctuations[16]. At 500 Hz, the rate of background hits is comparable to the several ms drift time of ions from the avalanche region ( < 100 µm, essentially at the wire surface) to the tube wall.
The rate of background hits per cm of tube length is constant and independent of prior hits (i.e.
Poisson-distributed) with very large fluctuations, so the electric field drop also has large statistical
fluctuations, which are not contained in the distance–drift-time relation. For hits at high radius,
fluctuation of space charge becomes the dominant contribution to the spatial resolution.
3 Tracking and triggering in the MS barrel region 3.2.3 Measurement of MDT pulses
Amplification of the induced current signal and conversion to a digitizable, logic-level pulse is done by the amplifier-shaper-discriminator (ASD). All the information is encoded in the width of the logic-level output pulses. A time-to-digital converter (TDC) then digitizes the pulse widths. Each front-end mezzanine card houses three eight-channel ASD chips and a 24-channel TDC.
The ATLAS MDT ASD
The new ASD is modeled after the reliable legacy ASDs, but as the 500 nm Agilent technology of the legacy ASDs has become obsolete, the layout has been redesigned in 130 nm Global Foundaries CMOS technology. The RMS noise has been reduced from 8 mV to 4 mV.
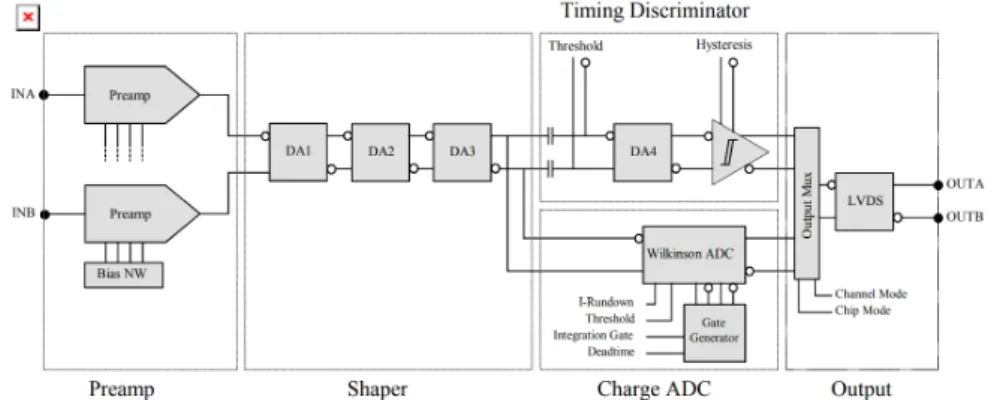
The ASD stages, shown in Figure 3.6, are the pre-amp, shaper, discriminator/charge-integrator, and output. The purpose of the amplifier and shaper stages is to prepare measurable pulses with minimal threshold crossings. The discriminator measures when the threshold is crossed. Parallel to the discriminator is a charge-integrating Wilkinson ADC, which may be used to integrate the rising edge for time-slewing corrections.
The pre-amplifier is a differential charge-to-voltage converter that boosts the signal to an operational voltage range. The less time this takes, the better the eventual time resolution. In the new ASD, the signal peaking time has been reduced from 14.4 ns to 12 ns by increasing the gain from 10 mV fC
−1to 21 mV fC
−1.
The pre-amplifier is followed by three shaping stages and two discriminator stages. The shaping stages remain largely unchanged: bipolar shaping with ion tail cancellation, and a discriminator with programmable threshold from −35 mV to −53 mV.
It is optional to operate with the Wilkinson ADC (ADC mode), at the expense of having a longer dead time. As an alternative, an estimate of signal amplitudes may be obtained by measuring their time over threshold.
Time conversion
The standard AMT TDC was used for the MDT tests in this thesis. The TDC stores leading and
trailing edge times in its channel buffer. Its basic gate delay timing mechanism gives a time bin size of
0.78 ns, so it records a time stamp in one of 32 divisions per 25 ns cycle. Each channel buffer can
hold four measurements. Its basic gate delay timing mechanism gives a time bin size of 0.78 ns and
RMS timing error of 0.3 ns on the rising and falling edges. Timing is stabilized by delay-locked-loop.
3.3 Triggering: Resistive plate chambers (RPCs)
Figure 3.6: Stages of the ASD.
The programmable TDC is also able to configure the ASD, send test output and deactivate noisy channels.
Performance of front-end electronics
The characteristics of the front-end electronics most significant for the muon efficiency and resolution, in particular at high photon hit rates, are summarized.
• Signal pile-up: The long ion tail can cause prolonged baseline undershoot at high rates. If successive signals arrive at short enough intervals, the threshold-crossing time is delayed, which causes an incorrigible error in the calculation of the hit radius.
• Dead time: The intrinsic muon efficiency of the chamber is further reduced by the dead time of the electronics. Reducing the dead time increases the efficiency. The dead time can result in a muon signal being masked by a preceding photon hit. The dead time is intended to prevent registering of second threshold crossings. Multiple threshold crossings are effectively prevented by setting the dead time slightly longer than the maximum drift time, as is done in the ATLAS nominal operating mode. The time over threshold of the signals is much shorter than the dead time, so that the dead time is not extended by further hits during the dead time. It is reasonable to assume only one threshold crossing per muon.
3.3 Triggering: Resistive plate chambers (RPCs)
As of 2018, the MS had 1366 resistive plate chambers (RPCs) feeding fast trigger data into the global
trigger system. Trigger and read-out data for each sector of the MS were managed by a dedicated
3 Tracking and triggering in the MS barrel region
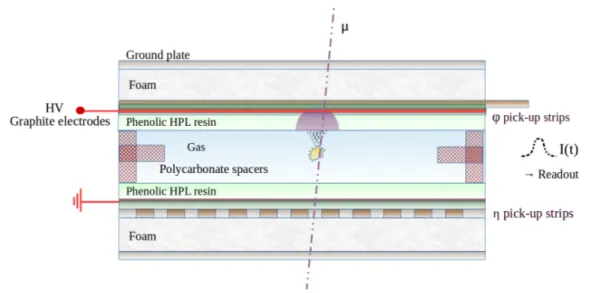
Figure 3.7: Components of an RPC gas gap.
read-out driver. The segment trigger algorithm was implemented on an on-chamber trigger logic board.
A new layer of triplet chambers will be added in Phase II to the innermost MS barrel layer (BI) to give more flexibility with the trigger settings. The Phase I pilot project BIS7/8 will install some of these new-generation chambers in the barrel-end-cap transition region to close acceptance holes.
Part II of this thesis presents performance studies of a prototype for these new chambers.
3.3.1 Chamber design
The structure of the gas-containing volume of an RPC singlet is drawn in Figure 3.7. Two phenolic HPL plates are separated by cylindrical polycarbonate spacers and sealed along the outer edge (Figure 3.8(a)). Mechanical strength is provided by an aluminum frame. The 1.8 mm-thick phenolic plates have a a volume resistivity of about 9 × 10
9Ω cm. The spacers have 12 mm diameter and are pitched 10 cm from one another.
The inner faces of the phenolic plates are coated with linseed oil for smoothness: due to the high
applied voltage, extra uniformity of the surface is needed. The outer faces are covered with graphite
electrodes with 100 kW surface resistivity, distributing several kilo-volts across the gas gap (metallic
electrodes would prevent signal induction outside the plates). Each high-voltage layer is insulated
with a glued film.
3.3 Triggering: Resistive plate chambers (RPCs) Above this lie 50 W copper pick-up strips (Figure 3.8(b)) running lengthwise along the outer faces of the gas gap and connected to the read-out system. The strips on the two faces are orthogonal, providing spatial measurements in ATLAS’ (η, φ) coordinate system. The η strips, pitched at 8 mm, offer greater spatial precision than the 25 mm φ strips. The front-end read-out electronics are shown in Figures 3.8(c) and 3.8(d).
The standard ATLAS RPC doublets have two 2 mm × 1 m × 1 m gas gaps per chamber, with a nominal high voltage working point of 9600 V. Since 2011, the high voltage working point is dynamically adjusted as a function of local temperature and atmospheric pressure[17]. The new thin-gap triplets have three 1 mm × 1 m × 1 m gas gaps with a nominal voltage of 5600 V. They also have the thinner resistive plates, which are more susceptible to space charge. As in MDTs, there are rich space charge dynamics in RPCs during and following an avalanche, so performance studies on real chambers are important.
3.3.2 Signal generation and measurement in RPCs
The key element in the fast timing capability of RPCs is the resistive phenolic plate (500 W cm
2), which helps to achieve a constant and uniform electric field by cutting short avalanche growth and localizing electrode discharge. The resistive material charges up sufficiently to negate the external field and locally halt the avalanche. In other parallel plate chambers, the entire electrode is discharged after each hit: multiplication is exponential, and the space charge can easily become as large as the applied field (Raether limit)[18]. The rate capability of RPCs is closely connected to the phenol resistivity. It should be sufficiently conductive to allow fast dissipation of the charge build-up.
The avalanche induces a signal on the copper pick-up strips. The signal is the sum of contributions from multiple primary clusters originating at different distances from the anode. To improve resolution, pulses are kept short with the help of a short-circuited coaxial cable in which reflections force the voltage to zero. As propagation can take as long as 10 to 15 ns, the pick-up strips are considered voltage signal transmitters and require 50 W termination. Typical RPC signals have 5 ns FWHM with 1 ns jitter. It is also necessary to amplify the signal above the resistor noise level. The three-stage pre-amplification circuit has a similar rise time to the input signal, and fast baseline restoration. The amplifier outputs a bipolar signal to a comparator, and the signal is digitized.
ATLAS’s trigger RPCs are filled with a mixture of ionization gas freon C
2H
2F
4(95%), the quencher gas
iso-C
4H
10(4.5%), and electronegative SF
6(0.3%). The mixture is designed to provide linear primary
ionization and suppressed secondary ionization. This comes from the high electronegative attachment
coefficients of freon and SF
6. The hydrocarbon iso-C
4H
10absorbs recombination photons.
3 Tracking and triggering in the MS barrel region
(a) Phenolic plates of a gas gap with polycarbonate spacers.
(b) Close-up view of pick-up strips. (c) Affixing the front-end electronics.
3.3 Triggering: Resistive plate chambers (RPCs)
Aging is progressive deterioration of surface condition (leading to efficiency loss) during operation
and may occur when avalanches produce fluorine radicals from freon, which are deposited on the
surface as a resistive fluoride. Another candidate process is deposition of a polymerized insulating
hydrocarbon layer. RPC aging scales with integrated avalanche charge: for the legacy ATLAS RPCs,
at the current operational voltage, 30 pC is “deposited” per avalanche at several hundred Hz cm
−1.
They are certified for an integrated charge of up to 0.3 C cm
−2for up to 10 years; at nominal voltage, an
integrated luminosity of 3000 fb
−1over 30 years will bring the integrated charge to 0.48 C cm
−2, hence
the need to operate at reduced voltage. In a thin-gap RPC, there is only 7 to 8 pC per avalanche.
CHAPTER FOUR
MUON AND GAMMA FACILITIES FOR DETECTOR DEVELOPMENT
4.1 Super Proton Synchrotron beam facilities
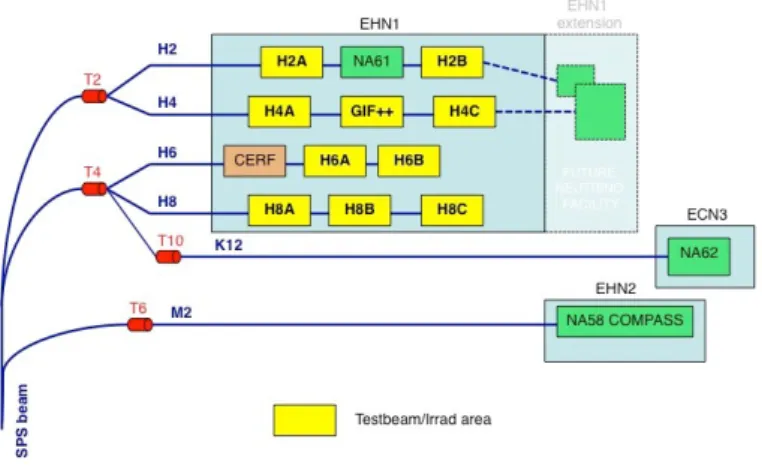
The Super Proton Synchrotron (SPS) in CERN’s accelerator complex is the final pre-accelerator stage of the LHC. One of its functions is to provide users of the North Area Test Beam facilities with a primary proton beam of up to 450 GeV. The primary beam is slowly extracted from the SPS to the North Area experimental halls (Figure 4.1). The primary beam is split using a wobbling technique and directed onto a series of beryllium and lead targets. The resulting secondary beam of electrons, hadrons and muons at 10 to 400 GeV are then split further and routed to users, who may control the beam properties. Muons are preferentially selected from the secondary beam by asymmetrically
Figure 4.1: North Area secondary beam facilities at the SPS.
4 Muon and gamma facilities for detector development
closing collimator “jaws” and choosing a specific bend setting. Then, the intensity and momentum spread of the secondary beam is controlled by collimators. The beam is steered with dipole magnets and focused with quadrupole magnets.
Wobbling causes particles to be delivered along the beam lines in “spills” of up to 2 × 10
8particles per spill, typically of several seconds duration and with a repetition frequency of one spill per 14 to 48 s. Many up- and downstream factors (including the LHC) can affect the duration, intensity and repetition frequency of spills delivered to beam facility users.
4.2 Gamma Irradiation Facility++
Sitting on the H4 beam line, CERN’s Gamma Irradiation Facility++ (GIF++) contains a 13.7 TBq Cs − 137 source of adjustable, directional γ intensity with upstream and downstream irradiation areas (Figure 4.2). At the bunker, the H4 line beam has nominal maximum momentum 150 GeV and approximately 150 mm radius. At the bunker’s beam entry point, (removable) iron dumps reduce the pion content.
Cs − 137 is a β -emitter whose daughter nucleus gives off a γ after-glow at 662 keV. The source in enclosed in a several mm of aluminum and plastic and surrounded by a large filter mechanism with three layers of movable lead filters for variation of the resultant γ intensity. It is controlled by a centralized system accessible outside the bunker. Gas and HV supplies and control computers are located outside, with underfloor routing in and out of the bunker. Other associated processing electronics may be placed within the bunker with additional shielding.
Figure 4.2: Top view of the GIF++ facility since 2015 (cut at 2m height).
Part II
ATLAS RPC: Thin-gap triplet muon test in H4 at SPS
CHAPTER FIVE
OVERVIEW
Part II presents 2017 performance tests of a full-size thin-gap RPC triplet chamber at a range of operating voltages. The “triplet” has three “singlets” (gas gaps). The tests pertain to the foreseen installation of a new layer of triplet RPCs in the inner barrel, which has been described in Part I.
Muons for the tests were provided by the SPS secondary beam facility H4 beam line.
The in-situ performance with cosmic muons of around 8000 RPC doublets in ATLAS has been presented in [19]; the average unbiased RPC trigger efficiency was found to be on average 90% at the 9600 V nominal gas gap voltage and did not significantly increase at higher voltages, with a worst case time resolution of 2 ns and average spatial resolution of 0.3 σ /pitch.
5.1 Test set-up
The chamber was positioned in the H4 beam line, as shown in Figures 5.1(a) and 5.1(b). The beam facility is described in Chapter 4. Each of the three gas gaps has a panel of η -oriented 50 W pick-up strips on one side and a panel of perpendicular φ -oriented strips on the other (where η and φ refer to the ATLAS coordinate system, i.e. η strips provide a pseudorapidity coordinate).
The beam line delivered spills of approximately 2 × 10
8muons each, and was approximately 100 mm
in diameter, meaning that muons were mostly contained within a four-by-four strip region, out
of the sixteen 8 mm- or 25 mm-pitch pick-up strips on each panel. A detailed description of the
chamber design is given in Chapter 3. A high-voltage sweep was done from 4400 to 6000 V. Each
dataset contained 10,000 muon triggers from coincidence scintillators. Signal amplification and
discrimination was done by a new front-end amplifier-discriminator (AD) designed for the thin-gap
RPC at nominal settings, and digitization by the new TDC (Chapter 3). The TDC digitized the leading-
and trailing-edge times of analog signals to the nearest nanosecond and saved the raw data format as a
list of rising and trailing signal edges tagged with channel and time.
5 Overview
(a) Schematic of the set-up in the H4 beam line at SPS beam facility.
(b) Photograph of the set-up. The front-end read-out electronics can be seen on top of the chamber.
Figure 5.1: Full-sized thin-gap RPC triplet prototype positioned in the H4 beam line.
5.2 Analysis recipe
5.2 Analysis recipe
Hits were clustered by time and position. By comparing the times and positions of clusters in different gas gaps, the time resolution and spatial resolution of the chamber are found. An unbiased estimate of the efficiency is found with the trigger as reference.
5.2.1 Finding the beam
From the “heat maps” of hits in Figures 5.2(b) and 5.2(a), the beam was incident in the region of the eighth–twelfth strips on η and φ panels. To reduce noise, part of the analysis was restricted to this region: that is, five strips per panel. Chamber noise is estimated from the number of hits per trigger for strips far from the beam area. Noise in the electronics can be estimated from the hit rates at 4400 V, where the chamber muon efficiency is zero (we shall see later that it is). A lower noise bound is the electronic noise, estimated from the hits-per-strip-per-trigger for the 4400 V η data,
noise,el= 0 . 001.
An upper noise bound is estimated from the hits per-strip-per-trigger at 6000 V for a η strip far from the beam:
noise,ch= 0 . 007. One panel had extremely high noise rates and was excluded from the efficiency analysis (but not from the resolution analysis).
5.2.2 Timing calibration
Due to different channel path lengths, the TDC time stamps between channels are asynchronous by several nanoseconds. Assuming time jitter is Gaussian distributed, synchronizing the time data of all TDC channels is simply a matter of shifting each recorded time by the mean time recorded by that channel. It is done separately at each working point. Once calibrated, the leading and trailing edge times for all panels are distributed around the same t
0(Figure 5.4(a)). The effect of time calibration on the dataset can be seen in Figure 5.3.
5.2.3 Cluster-finding
For each trigger event has a set of strip hit data points with strip numbers and time stamps, i.e. a 2D space spanned by space and time. A clustering algorithm based on the following rules has been implemented:
• A time cluster is defined as a set of hits at the same time or within 5 ns.
• A (space) cluster is defined as a set of hits on adjacent strips (maximum two strips) within a
time cluster.
5 Overview
(a) “Heat map” of clusters detected onφchannels at 5600 V. (b) “Heat map” of clusters detected onηchannels at 5600V.
Figure 5.2: Heat map of strip hits. Showing some dead channels, oneφpanel was disturbed by noise.
(a) Signal leading edge times (uncalibrated). (b) Signal leading edge times (calibrated).
(c) Signal time over threshold forφpanels. (d) Signal time over threshold forηpanels.
Figure 5.3: Signal properties.
• The cluster size is the number of strips in a space cluster.
• The cluster time is the mean of the hit times.
• The cluster position is the mean of the strip numbers.
• After-pulses sometimes occur; for two hits on the same strip, the later hit is discarded.
First, time clusters were generated. Each time cluster was then broken down into space clusters,
consisting of a single or two adjacent strips.
5.2 Analysis recipe
Voltage [V]
Time [ns]
-2 0 2 4 6 8 10
4400 4600 4800 5000 5200 5400 5600 5800 6000 6200
φ η
(a) Mean signal leading edge time with respect to channelt0after time calibration.
Figure 5.4: Leading edge time variability after calibration.
Voltage [V]
Number of hits
0.5 1 1.5 2 2.5
4400 4600 4800 5000 5200 5400 5600 5800 6000 6200
φ η
(a) Mean size of clustersηandφpanels at a range of gas gap voltages.
Voltage [V]
Number per trigger per 5 strips 0 0.1 0.2 0.3 0.4 0.5 0.6
4400 4600 4800 5000 5200 5400 5600 5800 6000 6200
φ clusters η clusters φ hits η hits
CHAPTER SIX
RESULTS
The test beam performance of the thin-gap RPC is characterized by its efficiency, time resolution, and spatial resolution. The resolution plots were found using only signals from the five-by-five-strip region that received the most muons, extending from the eighth to the twelfth strips on each panel (Figure 5.2(b)).
6.1 Efficiency
Average muon detection efficiencies of the η and φ panels as a function of chamber voltage are shown in Figure 6.1. One noisy ( φ ) panel has been excluded. For a fixed electronics threshold, the chamber muon efficiency has the characteristic plateau shape of gas gain with plateau efficiency > 90%. The nominal voltage, 5600 kV, is just over of the plateau, for performance stability.
The unbiased efficiency was found using the scintillators as a reference. It is defined as the number of triggers with a hit on the panel divided by all triggers.
6.2 Spatial resolution
Spatial resolutions of η and φ panels as a function of chamber voltage are shown in Figure 6.2(a). The spatial resolution at nominal voltage was on the order of 1 cm. For both the 8 mm-pitch η strips, and the larger 25 mm-pitch φ strips, spatial resolution at nominal voltage is around 5 mm. It increased with voltage for the φ but not η strips.
The spatial resolution of an RPC panel is the variability of cluster position measurements on that
panel. It is found with reference to the other panels, from the mean error on the positions of coincident
clusters, and its value is here given per read-out strip, as σ/ strip pitch.
6 Results
The resolution is a result of (i) dispersion in space of the avalanche charge in the gas gap and in the resistive layer, (ii) read-out strip geometry, with a combined intrinsic resolution of around 10 mm, and (iii) electronics.
6.3 Time resolution
Time resolutions of η and φ panels as a function of chamber voltage are shown in Figure 6.2(b). It did not depend on voltage.
The intrinsic singlet time resolution is due to non-uniform primary cluster deposition and/or signal amplitude. It is found by comparing cluster measurements between panels: the mean error on the times of coincident clusters from different panels. Coincidence means the time difference is ± 15 ns and the position difference is ± half a strip. This allows, for example, a one-strip cluster on one panel to “coincide” with a two-strip cluster on another panel. Given the spatial resolution is ≈ 5 mm, this is a relatively generous allowance.
The time resolution of the chamber is more likely limited by the AD, with an intrinsic jitter of < 1 ns (for comparison, the intrinsic TDC jitter is on the order of ps).
6.4 Cluster structure and signal properties
Note that the efficiency is independent of cluster size: it checks only whether there was any hit in that panel. Like the efficiency, though, the cluster size (Figure 5.5(a)) plateaus at 5600 V. Here, where muon hits dominate over noise, mostly two-hit clusters are found.
Signal amplitude: leading edges and times over threshold
I investigated measurement variability by looking into the structure of multi-hit (2+) clusters. The
standard deviation of a set of cluster data is used as a measure of consistency between readings (for
shorthand, I will call it spread). Different signal amplitudes, and thus, different leading edge times and
times over threshold, are necessarily expected for hits in a cluster: signal amplitude strongly depends
on the proximity of the avalanche to the strip (Chapter 3). The spread of leading edge times in a cluster
was around 5 ns, approximately 50% less than the overall spread (that of all measurements) of 9 ns
(Figure 6.3(a)). The time spread within clusters stayed constant even when the clustering algorithm
was relaxed to allowed the clusters to be separated by up to 15 ns.
6.4 Cluster structure and signal properties
Voltage [V]
Efficiency
0 0.25 0.5 0.75 1
4400 4600 4800 5000 5200 5400 5600 5800 6000 6200
φ η
Figure 6.1: Efficiency curve of the thin-gap RPC (excluding noisy layer).
The tightness of the cluster conditions did not have to be considered for the time over threshold (it was not used in the clustering process). The spread of times over threshold in clusters was on the order of 10% of the overall spread of times over threshold (0.7 ns against 8 to 10 ns) (Figure 6.3(b)).
This suggests that measurements of simultaneous primary ionizations are highly consistent in RPCs,
regardless of variability in the signal amplitude (gas gain, strip geometry, etc) and indicates that the
pre-amplifier is fast enough. Similarly, the average time over threshold of all signals did not change
at higher voltages or between η and φ strips, instead remaining a fairly constant 25 ns on average
(Figure 6.4).
6 Results
Voltage [V]
Resolution [σ/pitch]
0 0.2 0.4 0.6 0.8
4600 4800 5000 5200 5400 5600 5800 6000 6200
φ η
(a) Spatial resolution ofηandφpanels vs chamber voltage.
Voltage [V]
Resolution [ns]
0 0.25 0.5 0.75 1
4600 4800 5000 5200 5400 5600 5800 6000 6200
φ η
(b) Time resolution of theηandφpanels at a range of gas gap voltages.
Figure 6.2: Resolution of the thin-gap RPC prototype.
6.4 Cluster structure and signal properties
Voltage [V]
Std. dev [ns]
0 5 10 15 20
4400 4600 4800 5000 5200 5400 5600 5800 6000
φ η Spread in leading edges within cluster
(a) Spread of signal leading edge times.
Voltage [V]
Std. dev. [ns]
0 2 4 6 8 10 12
4400 4600 4800 5000 5200 5400 5600 5800 6000
φ η Spread in time-over-thresholds within cluster
(b) Spread of signal time over threshold.
Figure 6.3: RPC signal variability overall and within clusters.
6 Results
Voltage [V]
Time [ns]
0 5 10 15 20 25
4400 4600 4800 5000 5200 5400 5600 5800 6000
φ η
Figure 6.4: RPC mean time over threshold overall.
Part III
ATLAS MDT: test chamber irradiation in GIF++ at SPS
CHAPTER SEVEN
OVERVIEW
Part III of this thesis presents results of 2018 tests of a muon drift tube chamber with a muon beam and intense γ irradiation. The first goal was to verify the performance of the new ASD ASIC against the currently installed (“legacy”) ASD, prior to the complete replacement of tens of thousands of units during Long Shutdown 3. The second goal was to quantify the overall deterioration in chamber performance at very high γ conversion rates.
Data was gathered over several weeks at the SPS tertiary beam test facility (Chapter 4). The set-up was designed to gather large quantities of data from the two ASD versions simultaneously for comparison.
Muon track radii were then reconstructed from recorded muon trigger times and drift times using a known distance–drift-time relation, which was auto-calibrated to account for variation in the test conditions.
The γ irradiation test is important because photons, which represent a large fraction of the cavern background in the MS, are mostly converted to Compton electrons in the tube wall, and typically deposit more charge than muons, eliciting a different ASD response and having a different effect on the electric field in the tube. The electronics should be optimized for muon pulse shapes but also have a high rate capability for photon-type signals.
The experimental set-up and data acquisition procedure are detailed in this chapter; results appear in Chapter 8.
7.1 Test set-up
Figure 7.1 schematizes the set-up. The 48-tube test chamber has six layers of eight tubes, split into
two separated three-layer sections, each having its own read-out card (Figure 7.2). The chamber
was mounted with tubes vertically on an aluminum frame of T-slotted profiles, directly in the beam
path and 4 m from the γ source (Figure 7.3(a)). The two chamber halves are visible in Figure 7.3(b).
7 Overview
Figure 7.1: Schematic of the experimental set-up showingµ-beam,γ-field, and chamber.
7.1 Test set-up
(a) Chamber front mezzanine with three epoxy- encapsulated new ASDs and legacy ATLAS TDC.
(b) Chamber back mezzanine with three legacy AT- LAS ASDs and legacy ATLAS TDC.
Figure 7.2: Front-end mezzanine cards for each chamber half (24 tubes).
The test chamber tubes have radius 30 mm and length 500 mm; they can track muons across their whole cross-sections except muons passing only through the tube walls: the blind areas of each layer.
Since the chamber is six layers deep and since alternating layers are offset by 15 mm, by design there is always a set of at least three potential tube hits from which to reconstruct each track. The two outermost tubes of the chamber front (i.e. the layer facing the beam upstream) were, however, defective and are excluded from the analysis.
7.1.1 Applied voltage and chamber grounding
A wire potential of 3080 V is distributed from a voltage source to two 24-channel ATLAS-style Hedgehog boards (Chapter 3) on the bottom of the chamber. The other ends of the tube wires are terminated by similar 24-channel Hedgehog boards; the two Hedgehog boards at this end each connect to a 150 × 200 mm mezzanine card containing front-end electronics (Figure 7.3(c)). The mezzanine cards are affixed with a grounding screw and covered with chromated Faraday cages with a close-cut 10 mm × 40 mm hole for the forty-pin read-out cable (Figure 7.3(d)). The chamber and frame were grounded to the facility’s common ground.
7.1.2 Front-end electronics: chamber signal processing
Three amplifier-shaper-discriminator (ASD) ASICs and one time-to-digital-converter (TDC) ASIC
were soldered onto each mezzanine card. The first mezzanine card had new ASDs and served the
three upstream layers (chamber front); the second had legacy ASDs and served the downstream
layers (chamber back). The Hedgehog boards wiring was such that the eight tubes in a layer share an
7 Overview
(a) In-situ: the test chamber (far left of image) sur- rounded by other experiments using the same facility.
The muon beam comes from the right.
(b) Before installation: test chamber with six layers of tubes.
(c) Before installation: checking connections on the read-out end Hedgehog board. The 16-pin sockets connect to a mezzanine card.
(d) During installation: top view of the test chamber, showing mezzanine cards with (top) legacy ASDs and (bottom) new ASDs. The mezzanine cards are about to be covered by the Faraday cages on the right side.
(e) Back-end processing power: GLIB (left) and cus-(f) The trigger distribution box with ATLAS AMT