ATLAS-CONF-2015-052 28September2015
ATLAS NOTE
ATLAS-CONF-2015-052
26th September 2015
Measurement of dijet p T correlations in Pb + Pb and p p collisions at √
s NN = 2.76 TeV with the ATLAS detector
The ATLAS Collaboration
Abstract
Measurements of dijets in both Pb
+Pb and
ppcollisions at a nucleon–nucleon centre-of- mass energy of
√sNN =
2.76 TeV are presented. The measurements were performed with the ATLAS detector at the LHC using data samples with integrated luminosities of 0.14 nb
−1and 4.0 pb
−1for the Pb
+Pb and
ppdata samples, respectively. Jets were reconstructed using the anti-k
talgorithm with
R =0.4. A background subtraction procedure was applied to correct the jet for the large underlying event present in Pb+Pb collisions. Measurements are reported of the normalized yields
N1 dNdxJ
, where
xJ=pT2/pT1and
pT1and
pT2are the leading and subleading jet transverse momenta, respectively. The results are presented as a function of
pT1and collision centrality. The results were obtained by measuring the two-dimensional
pT1-p
T2distributions and applying an unfolding procedure to account for experimental resol- ution in the measurement of both jets’ transverse momenta simultaneously. The distributions are found to be similar in peripheral Pb
+Pb collisions and
ppcollisions, but highly modi- fied in central Pb+Pb collisions. The results are consistent with expectations from partonic energy loss.
©2015 CERN for the benefit of the ATLAS Collaboration.
Reproduction of this article or parts of it is allowed as specified in the CC-BY-3.0 license.
1 Introduction
Jets have long been considered an important tool to study the matter produced in ultra-relativistic heavy- ion collisions. In these collisions, a hot medium of deconfined color charges is produced known as the quark-gluon plasma (QGP). Jets produced in the initial stages of the collision lose energy as they travel through the medium. This phenomenon, known as
jet quenching, was first observed at RHIC [1,2].
The first measurements using fully reconstructed jets in Pb
+Pb collisions at the LHC provided a direct observation of this phenomenon [3]. In Pb
+Pb collisions the transverse momentum (p
T) balance between dijet pairs was found to be distorted, resulting from events in which the two jets suffer different amounts of energy loss. This measurement was the experimental realisation of some of the initial pictures of jet quenching and signatures of a deconfined medium [4].
Subsequent measurements of jets in Pb+Pb collisions have improved the understanding of properties of quenched jets and the empirical features of the quenching mechanism [5–13]. Significant theoretical advances have also occurred in this period, and while a complete description of jet quenching is not available, some models are capable of reproducing its key features and providing testable predictions.
Measurements of the dijet asymmetry
AJ≡(p
T1−pT2)/(p
T1+pT2) where
pT1and
pT2are the transverse momenta of the jets with the highest and second highest
pTin the event, respectively, have been crucial in facilitating these developments. The experimental results demonstrate that the measured asymmetries in central collisions, where the geometric overlap of the colliding nuclei is almost complete, show a central- ity dependence beyond that expected from detector-specific experimental effects [3, 8, 9]. However, such effects, in particular the resolution of the measured jet
pT, must be corrected for in order for the meas- urement to be directly compared to theoretical calculations. Unfolding procedures have been applied to correct for such e
ffects for single jet results [6]; however the dijet result requires a two-dimensional unfolding to account for migration in the
pTof each jet separately. The measurement reported in this note is the first unfolded Pb
+Pb dijet measurement and thus is the first that can be directly compared to theoretical models.
This note presents a measurement of dijet
pTcorrelations in Pb
+Pb and
ppcollisions at a nucleon-nucleon centre-of-mass energy of 2.76 TeV performed with the ATLAS detector. Jets are reconstructed with the anti-k
talgorithm with
R =0.4 [14]. A background subtraction procedure to account for the effects of the large underlying event (UE) present in Pb+Pb collisions on the measured jet kinematics is applied.
The momentum balance of the dijet system was expressed by the variable
xJ≡ pT2/pT1. Measurements of
N1d
Ndx
Jare presented as a function of
pT1and collision centrality. The results were obtained by first measuring the
pT1-p
T2distribution and unfolding in the two-dimensional space. The binning in the
pT1-
pT2distribution was chosen such that the bin boundaries correspond to fixed ranges of
xJ, and the
N1d
Ndx
Jresults were obtained by projecting into these
xJbins.
This note is organised as follows. Sections 2 and 3 describe the ATLAS detector and the data samples
used in this analysis, respectively. The procedure used to reconstruct jets is discussed in Section 4. Sec-
tion 5 describes the data analysis including the dijet pair selection, while the unfolding and projection to
xJprocedures are described in Section 6. The systematic uncertainties on the measurement are presen-
ted in Section 7 followed by a presentation of the results in Section 8. Finally, Section 9 presents the
conclusions drawn from the measurement.
2 Experimental setup
The measurements presented in this paper were performed using the ATLAS inner detector, calorimeter and trigger systems [15]. The inner detector system provides measurements of charged particles over the range
|η| <2.5
1. It is composed of silicon pixel detectors in the innermost layers, followed by siliconmicrostrip detectors and a straw-tube tracker, all immersed in a 2 T axial magnetic field provided by a solenoid. The minimum-bias trigger scintillators (MBTS) measure charged particles over 2.1
< |η| <3.9 using two planes of counters placed at
z =±3.6 m and were used to provide timing measurements usedin the event selection [16].
The ATLAS calorimeter system consists of a liquid argon (LAr) electromagnetic (EM) calorimeter (|η
| <3.2), a steel-scintillator sampling hadronic calorimeter (
|η| <1.7), a LAr hadronic calorimeter (1.5
<|η| <
3.2), and a forward calorimeter (FCal) (3.2
< |η| <4.9). The hadronic calorimeter has three longitudinal sampling layers and has a
∆η×∆φgranularity of 0.1×0.1 for
|η| <2.5 and 0.2×0.2 for 2.5
<|η| <
4.92. The EM calorimeters are longitudinally segmented into three compartments with an additional pre-sampler layer. The EM calorimeter has a granularity that varies with layer and pseudorapidity, but which is generally much finer than that of the hadronic calorimeter. The first layer has high
ηgranularity (between 0.003 and 0.006) that can be used to identify photons and electrons. The middle sampling layer, which typically has the largest energy deposit in EM showers, has a granularity of 0.025
×0.025 over
|η| <2.5. A total transverse energy (TE) trigger is implemented by requiring a hardware-based determination of the total transverse energy in the calorimeter system,
ETtot, to be above a threshold.
The zero-degree calorimeters (ZDCs) are located symmetrically at
z = ±140 m and cover|η| >8.3. In Pb
+Pb collisions the ZDCs primarily measure “spectator” neutrons: neutrons from the incident nuclei that do not interact hadronically. A ZDC coincidence trigger is implemented by requiring the summed pulse height from each ZDC to be above a threshold set below the single neutron peak.
3 Data and Monte Carlo samples
The Pb
+Pb data used in this measurement were obtained using a combination of jet and minimum-bias triggers. The minimum-bias trigger was defined by a logical OR of the TE trigger with a threshold of
ETtot>50 GeV and the ZDC coincidence trigger, and was fully efficient in the range of centralities presen- ted here. The jet trigger first selected events satisfying the TE trigger with a threshold of
ETtot >20 GeV.
A jet reconstruction procedure was then applied using the anti-k
talgorithm with
R =0.2 and utilising a UE subtraction procedure similar to that used in the offline reconstruction described in Section 4. Events with at least one jet with
ET >20 GeV at the electromagnetic scale [17] were selected by the jet trigger.
The use of
R =0.2 in the trigger, as opposed to the value of
R =0.4 used in the measurement, was necessitated by operational requirements during data taking, and the effects of the different
Rvalues on the trigger e
fficiency are discussed in Section 5. The minimum-bias trigger operated with a prescale of approximately 18 while no prescale was applied to the jet trigger. After accounting for these prescales,
1ATLAS uses a right-handed coordinate system with its origin at the nominal interaction point (IP) in the center of the detector and thez-axis along the beam pipe. The x-axis points from the IP to the center of the LHC ring, and the y-axis points upward. Cylindrical coordinates (r, φ) are used in the transverse plane,φbeing the azimuthal angle around the beam pipe.
The pseudorapidity is defined in terms of the polar angleθasη=−ln tan(θ/2).
2An exception is the third sampling layer that has a segmentation of 0.2×0.1 up to|η|=1.7.
the recorded events correspond to integrated luminosities of 0.008 and 0.14 nb
−1, for the minimum-bias and jet-triggered samples, respectively.
Events were further subjected to criteria designed to remove non-collision background and inelastic elec- tromagnetic interactions between the nuclei. Events were required to have a reconstructed primary vertex and have a timing difference of less than 5 ns between the times measured by the two MBTS planes.
After the trigger and event selection criteria, the resulting data samples contain 53 and 14 million events in the minimum-bias and jet triggered samples, respectively. The average number of collisions per bunch- crossing (pile-up) in the Pb+Pb data sample was less than 0.001, and the effects of multiple collisions were neglected in the data analysis.
The centrality of the Pb+Pb collisions was characterised by the total transverse energy measured in the FCal modules,
PETFCal
. The
PETFCal
distribution obtained in minimum-bias collisions was partitioned into separate ranges of
PETFCal
referred to as centrality classes [16, 18, 19]. Each class was defined by the fraction of the distribution contained by the interval, e.g. the 0–10% centrality class contains the 10%
of minimum-bias events with the largest
PETFCal
. The centrality boundaries used in this analysis are 0%, 10%, 20%, 30%, 40%, 60% and 80%.
The
ppdata sample is composed of events selected using the ATLAS jet trigger [20]. It applied the anti-k
talgorithm with
R =0.4 and used a series of di
fferent
pTthresholds each selected with a di
fferent prescale. The events were further required to contain at least one primary reconstructed vertex. The average number of
ppcollisions per bunch-crossing varied between 0.3 and 0.6 during data taking. The sample corresponds to a luminosity of 4.0 pb
−1.
The impact of experimental effects on the measurement was evaluated using the Geant4-simulated de- tector response [21,
√22] in a Monte Carlo (MC) sample of
pphard-scattering events. Dijet events at
s =2.76 TeV were generated using P
ythiaversion 6.423 [23] with parameters chosen according to the AUET2B tune [24]. Separate samples were generated for the Pb+Pb and
ppanalyses, with the simulated detector conditions chosen to match those present during the recording of the respective data samples.
The pile-up contribution present in the
ppdata sample was accounted for by overlaying minimum-bias
ppcollisions produced at the same rate present in the data, generated by Pythia 8 [25] using the A2 [26]
tune with MSTW2008LO PDF sets. In the Pb+Pb sample, the UE contribution to the detector signal was accounted for by overlaying the simulated events with minimum-bias Pb
+Pb data. The vertex positions of each simulated event were selected to match the data event used in the overlay. Through this procedure the MC sample contains contributions from underlying event fluctuations and harmonic flow that match those present in the data. The combined signal was then reconstructed using the same procedure as was applied to the data. So-called
truth jetswere defined by applying the anti-k
talgorithm with
R =0.4 to stable particles in the generator output, defined as those with a proper lifetime greater than 10 ps, but excluding muons and neutrinos, which do not leave significant energy deposits in the calorimeter. To fully populate the kinematic range considered in the measurement, hard scattering events were generated for separate intervals of ˆ
pT, the transverse momentum of outgoing partons in the 2
→2 hard-scattering, and combined using weights proportional to their respective cross sections.
An additional sample was produced using the Pyquen generator [27] to study the detector response to
quenched jets. This generator applies medium-induced energy loss to parton showers produced by P
y-
thia. It was used to generate a sample of jets with fragmentation functions that di
ffer from those in the
nominal Pythia sample in a fashion consistent with measurements of fragmentation functions in quenched
jets [11–13].
4 Jet reconstruction
The procedure used to reconstruct jets in heavy-ion collisions is described in detail in Ref. [5] and is briefly summarised here. First, energy deposits in the calorimeter cells are assembled into
∆η×∆φ =0.1
× 32πlogical towers. Jets arse formed from the towers by applying the anti-k
talgorithm [14] as implemented in the
FastJetsoftware package [28].
The background subtraction procedure first determined the UE average transverse energy density,
ρ, aswell as the magnitudes and phases of the harmonic modulation due to flow. In Ref. [5], only the second- order harmonic modulation (n
=2) was considered, but in this measurement the procedure has been extended to account for
n =3 and 4 harmonic modulations as well. Once these quantities have been determined, the subtraction is applied to each tower within the jet. The
ρand flow quantities can be biased if the energy in a jet is included in their calculation. This may result in an over-subtraction of the average UE contribution to the jet energy or incomplete removal of the harmonic modulation. To mitigate such effects, an iterative procedure is used remove the contribution of actual jets from the estimate of the background. The typical background subtracted from the jets varies between a few GeV in peripheral collisions to 150 GeV in the most central collisions.
A calibration factor, derived from MC studies, is then applied after the subtraction to account for non- compensation of the hadronic response. A final
in situcalibration is applied to account for known dif- ferences between the detector response in data and in the MC sample used to derive the initial calibra- tion [29]. This calibration is derived in 8 TeV
ppdata and adapted to the different beam energy and pile-up conditions relevant for the samples considered here. It uses the balance between dijet pairs in di
fferent
ηregions of the detector to provide an evaluation of the relative response to jets as a function of
η. Itsubsequently uses jets recoiling against well calibrated objects such as
Zbosons and photons to provide constraints on the absolute energy measurement.
5 Data analysis
In this analysis, jet pairs were formed from the two highest
pTjets in the event with
pT >25 GeV and
|η| <
2.1. The pair was required to have
∆φ >7π/8. For events selected by a jet trigger, the leading jet was required to match a jet identified by the trigger algorithm responsible for selecting the jet. The two-dimensional
pT1-p
T2distributions obtained from di
fferent triggered samples were combined such that intervals of
pT1are populated by a single trigger. In the
ppdata analysis, the trigger with the most events that was more than 99% efficient for selecting a jet with
pT > pT1was used, with the reciprocal of the luminosity for the respective trigger samples used as a weight.
The Pb+Pb jet trigger efficiency has a broad turn-on as a function of
pTsince the trigger jets were iden- tified using
R =0.2 and had no energy scale calibration applied. This e
ffect is the strongest in central collisions where the UE fluctuations are the largest and further weaken the correlation between jets re- constructed with
R =0.2 and 0.4. In the most central collisions, the single jet efficiency does not reach a plateau until
pT ∼90 GeV. The jet-triggered sample was used where the e
fficiency was found to be greater than 97% which occurs at a
pTof approximately 85 GeV in the most central collisions. A trigger efficiency correction was applied in the region where there is an inefficiency.
In addition to the dijet signal, the measured
pT1-p
T2distribution receives contributions from so-called
combinatoricpairs. Such pairs arise when another jet in the event, uncorrelated with the hard-scattering
process that produced the dijet, fullfils the pair requirements through random association. Such jets may originate from independent hard scatterings or with upward UE fluctuations identified as jets, referred to as UE jets. The rate for such occurrences is highest in the most central collisions, and the reduction in the true sub-leading jet
pTdue to quenching e
ffects further enhances the likelihood of forming a combinatoric pair.
The shape of the
∆φdistribution for the combinatoric pairs is influenced by the harmonic flow. As the jet spectrum is steeply falling, the most likely jets to be observed at a given
pTvalue are those where the UE underneath the jet is above average background. If the effects of the modulation of the UE are not fully accounted for in the background subtraction, more jets will be observed at angles corresponding to the flow maxima. Thus combinatoric dijet pairs, without any underlying angular correlation, are expected to acquire a modulation to their
∆φdistribution determined by the dominant flow harmonics [30]. Although the second, third and fourth order harmonic modulation are considered in the jet reconstruction procedure described in Section 4, only the e
ffects of the second order modulation on the
∆φdistribution were observed to be completely removed. The residual effects are an indication that the method of estimating the modulation of the UE underneath the jet is less accurate for the higher order harmonics than for
n=2.
To account for the residual modulation, the combinatoric contribution was assumed to be of the form
C(∆φ)
= Y(1
+2c
3cos 3∆φ
+2c
4cos 4∆φ). The
c3and
c4values were determined by fitting the
∆φdistributions over the range 0
< ∆φ < π/2 where the real dijet contribution is expected to be small. Theregion near
∆φ ∼0 is also expected to receive real dijet contributions arising from split jets. To remove this contribution, this fit to obtain
c3and
c4was performed only using dijet pairs with a separation of
|∆η| >
1.5. Once
c3and
c4were obtained, the
∆φdistribution without this
|∆η|requirement was fit over the range 1
< ∆φ <1.4 to obtain
Y. All fits were performed separately in each
pT1-p
T2interval.
The expected contribution in the signal region was obtained by integrating
C(∆φ) from 7π/8 toπand subtracting the yield from each
pT1-p
T2bin. The background subtraction is most significant in central collisions where the fraction subtracted from the total yield in the signal region is as large as 10% for small
xJand is less than 1% for
xJvalues greater than 0.5. The background contribution in more peripheral collisions is less than 1% for all values of
xJ.
In a given event, the
pTresolution may result in the jet with the highest true
pTin the event being measured with the second highest
pTand vice-versa. To properly account for such migration e
ffects,
pT1-p
T2distributions were symmetrised prior to the unfolding by apportioning half of the yield in a given
pT1-p
T2bin, after combinatoric subtraction, to another bin related to the original by
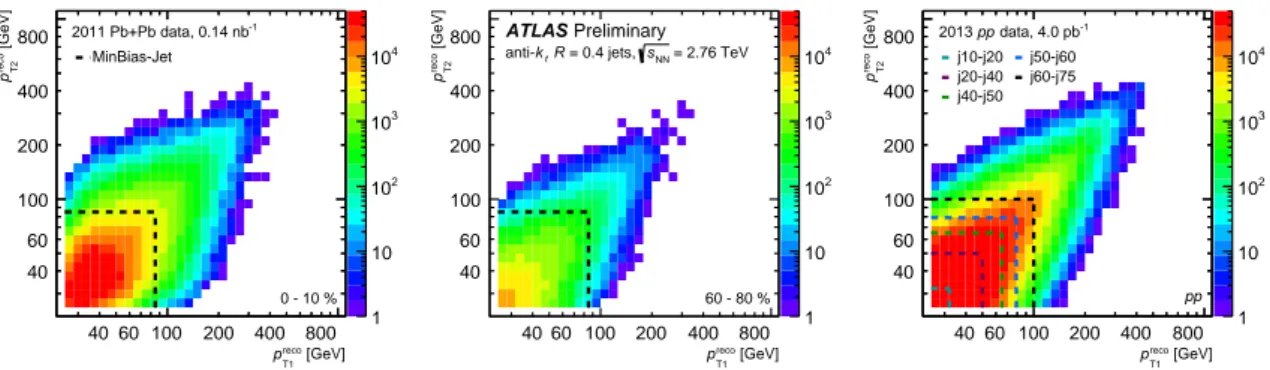
pT1 ↔ pT2. The two-dimensional distributions after symmetrisation are shown in Fig. 1 for central and peripheral Pb
+Pb collisions and for
ppcollisions.
6 Unfolding
The calorimetric response to jets was evaluated in the MC sample by matching truth and reconstructed jets; the nearest reconstructed and truth jets within
∆R = p∆η2+∆φ2 <
0.4 were considered to be
a match. The response is typically characterised in terms of the jet energy scale (JES) and jet energy
resolution (JER). These quantities describe the mean and width of the
precoTdistributions at fixed
ptruthT,
expressed as a fraction of
ptruthT. Generally, the mean of
precoTand
pTtruthdi
ffer by less than a percent,
independent of
ptruthTand centrality. This indicates that the subtraction of the average UE contribution to
the jet energy is under good experimental control. The JER receives contributions both from the response
1 10 102
103
104
[GeV]
reco
pT1
[GeV]reco T2p
2011 Pb+Pb data, 0.14 nb-1
0 - 10 % 40
40 60 60
100 100
200 200
400 400
800 800
MinBias-Jet
1 10 102
103
104
[GeV]
reco
pT1
[GeV]reco T2p
Preliminary ATLAS
= 2.76 TeV sNN
= 0.4 jets,
tR
k anti-
60 - 80 % 40
40 60 60
100 100
200 200
400 400
800 800
1 10 102
103
104
[GeV]
reco
pT1
[GeV]reco T2p
data, 4.0 pb-1
pp 2013
pp j10-j20
j20-j40 j40-j50
j50-j60 j60-j75
40 40
60 60
100 100
200 200
400 400
800 800
Figure 1: The symmetrised two-dimensionalpT1-pT2 distributions for Pb+Pb data in the 0–10% (left) and 60–80%
(center) centrality bins and for pp data (right). The dashed lines indicate the boundaries used in selecting the different triggers. The Pb+Pb data distributions have their combinatoric contribution subtracted.
of the calorimeter and from local UE fluctuations about the mean in the region of the jet. The latter contribution dominates at low
pTwith the resolution as large as 40% at
pT '30 GeV in the most central collisions. By contrast the JER is only 20% in peripheral collisions, or similarly in
ppcollisions, at the same
pT. At larger
pTvalues the relative contribution of the UE fluctuations to the jet
pTdiminishes, and the JER is dominated by detector e
ffects, reaching a constant, centrality-independent value of 8% for
pT >300 GeV.
The migration in the two-dimensional
pT1-p
T2distribution was accounted for by applying a two-dimensional Bayesian unfolding to the data [31]. This procedure utilised a response matrix obtained by applying the same pair selections to the MC sample as in the data analysis (except the trigger requirement) and re- cording the values of
pT1recoand
pT2recoand the transverse momenta of the corresponding matched truth jets
pT1truthand
pT2truth. The full four-dimensional response behaves similarly to the factorised product of separate single jet response distributions, and the migration effects can be understood in terms of the above discussion. While this provides intuition for the nature of the unfolding problem, such a factorisa- tion is not explicitly assumed, and any correlations between the response of the two jets are accounted for in the procedure.
The Bayesian unfolding method is an iterative procedure that requires both a choice in number of itera- tions,
niter, and assumption of a prior for the underlying true distribution. The value of
niterwas selected by evaluating the tradeoff between the amplification of statistical fluctuations (large
niter) and residual bias in the unfolded distribution due to the original choice of prior (small
niter). The latter was studied by applying the response matrix to the unfolded result (refolding) and comparing the resulting distribution to the input data as a consistency check. Based on these considerations
niterwas chosen to be 26 in the Pb
+Pb analysis. In the
ppanalysis 15 iterations was found to be suitable. The prior in both the Pb
+Pb and the
ppresponse matrices was generated from the truth
pT1-p
T2distribution in Pythia.
After unfolding, the leading
/sub-leading distinction was restored by reflecting the distribution over the line
pT1 = pT2: for each bin with
pT2 > pT1the yield was moved to the corresponding bin with
pT2 <pT1
. Bins with
pT2 = pT1were not affected by this procedure. The two-dimensional distribution was constructed using binning along each axis such that the upper edge of the
ithbin obeys,
pTi = pT 0αi, α = pTn pT 0
!1/n
,
(1)
where
nis the total number of bins and
pT 0and
pTnare the minimum and maximum ranges covered by the binning, respectively. With these choices of binning, the range of
xJvalues in any given
pT1-p
T2bin is fully contained within two adjacent
xJbins. In this analysis, half of the yield in each
pT1-p
T2bin was apportioned to each of the
xJbins. The exception are the bins along the diagonal. These bins contribute solely to the
xJbin with bin edges (α
−1,1). The effects of such a mapping on the
xJdistribution were studied and found to not significantly distort the shape of the distribution for a variety of input
xJdistributions.
7 Systematic uncertainties
Systematic uncertainties attributed to the response matrix used in the unfolding arise due to uncertain- ties in the JES and JER. To account for these e
ffects, new response matrices were constructed with a systematically-varied relationship between the truth and reconstructed jet kinematics. The data were then unfolded using the new response and the result compared with the nominal.
In the
ppdata analysis, the JES uncertainty was described by a set of 11 independent nuisance parameters;
these include e
ffects from uncertainties derived through the
in situcalibration [29]. The calorimetric response to jets initiated by the fragmentation of quarks and gluons was observed to differ in the MC sample used in the calibration. Potential inaccuracies in the MC sample to describe both this flavor- dependent response and the relative abundances of quark and gluon jets were accounted for using separate nuisance parameters. A source of uncertainty related to the adaptation of the
in situcalibration derived at
√s=
8 TeV to 2.76 TeV [32] was also included.
In the Pb+Pb data analysis, two additional uncertainties on the JES were considered. The first accounted for differences in the detector operating conditions in the Pb+Pb data and the
ppdata. This was derived by using charged particles reconstructed in the inner detector to provide an independent check on the JES, which only uses information from the calorimeter. For each jet, all reconstructed tracks within
∆R<0.4 and having
pTtrk >2 GeV, were associated with the jet and the scalar sum of the track transverse momenta was evaluated. The ratio of this sum to the jet’s
pTwas evaluated both in data and in the MC sample, and a double ratio was formed between the two quantities. This double ratio was compared between that obtained in peripheral Pb+Pb data and
ppdata. The precision of the comparison is limited by the poor statistics in the peripheral Pb
+Pb data and high jet
pT, and a conservative
pT- and
η-independentuncertainty of 1.46% was assigned to account for potential di
fferences.
A centrality-dependent JES uncertainty to account for potential differences in the detector response to quenched jets was estimated to be up to 1% in the most central collisions and decreasing linearly with centrality percentile to 0% in the 60–80% centrality class. This was estimated by comparing the detector response evaluated in the P
ythiaand P
yquenMC samples. This estimate was checked in data using a study with tracks similar to the one described above, but comparing central and peripheral Pb
+Pb collisions and accounting for the measured variation of the fragmentation function with centrality.
The uncertainty attributed to the JER was obtained by adding Gaussian fluctuations to each reconstructed
jet
pTvalue when populating the response matrix. The magnitude of this uncertainty was fixed by a
comparison of the data and MC descriptions of the JER in 8 TeV data [33, 34]. Since the MC sample
was constructed using the data overlay procedure, it is expected that the centrality dependence of the JER
should be well described in the MC. This was checked by studying the distribution of UE fluctuations
using random, jet-sized groups of calorimeter towers in Pb+Pb data. The standard deviations of these
distributions describe the typical UE contribution beneath a jet. The centrality dependence of the UE fluctuations was compared to that of the JER in the MC sample. A systematic uncertainty was included to account for the observed di
fferences, although as expected, these di
fferences were much smaller than the centrality-independent contribution.
Sensitivity to the number of iterations used in the unfolding was tested by varying the value by
±4, andusing the variation in the unfolded results to assign an uncertainty. A separate uncertainty was applied to account for inconsistencies in the refolding procedure. The fractional differences between the refolded and input
N1d
Ndx
Jdistributions were considered as fractional uncertainties on the unfolded result. To test the sensitivity to the choice of the Bayesian prior, the response matrix was re-populated while by applying a reweighting to the
pT1truth-
pT2truth. Reweightings of 1/x
Jand 1/x
J2were used and the difference between the resulting distributions and the nominal ones was included as a source of systematic uncertainty.
The method of populating the response matrix, using samples with different ˆ
pTranges and applying a weighting, suffers from the fact that large fluctuations may occur in bins where two samples contribute with one containing many fewer counts but a much larger cross section. As the response matrix is sparsely populated (containing 40
4bins), such fluctuations could introduce instabilities in the unfolding. To eval- uate the sensitivity to such effects, along with any other defects in the response, a new response matrix was constructed as a factorised product of single jet response distributions, i.e. assuming the response in
pT1and
pT2were independent. The data were unfolded using this new response and the differences in the unfolded distributions were taken as a systematic.
Finally, uncertainties on the combinatoric contribution were evaluated by varying the region of
∆φused to estimate that contribution from 1.0–1.4 to 1.1–1.5. Generally the combinatoric subtraction contribution is smaller than the others in all
pTand centrality bins, and is only greater than 5% at values of
xJ<0.4.
Each contribution to the uncertainty and thus the total uncertainty tends to decrease with increasing
xJ. The total uncertainty at
xJ ∼1 reaches approximately 15% in most
pT1and centrality bins in the Pb+Pb data. For
xJ <0.4, the relative uncertainty becomes large, but this region represents only a small con- tribution to the total
N1d
Ndx
Jdistribution. The JES uncertainty is the largest contribution. In the Pb+Pb data it reaches values of approximately 10% and 15% at
xJ ∼1 and
xJ =0.5, respectively. The unfold- ing (number of iterations, refolding, reweighting and response population) and JER contributions to the uncertainties are typically between 5 and 10%, but in the most central bins the unfolding uncertainty can become as large as a the JES contribution. The contributions to the uncertainty in the
ppdata follow similar trends as described for the Pb
+Pb data, but are typically smaller by a factor of two.
8 Results
The unfolded
N1d
Ndx
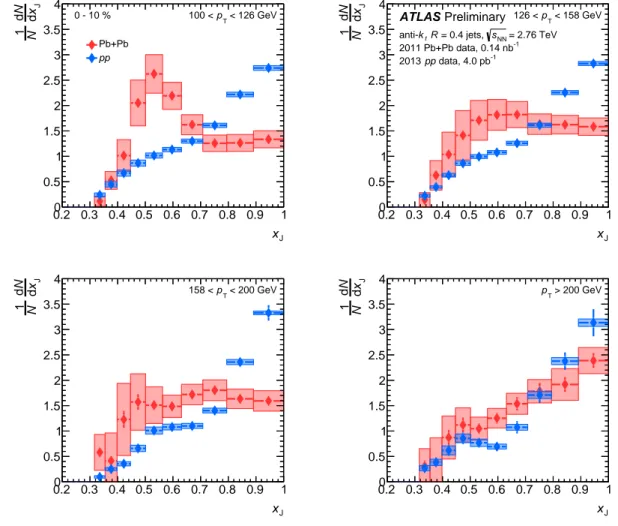
Jdistributions are shown Figure 2, for pairs with 100
< pT1 <126 GeV for different
centrality intervals. The distribution in
ppcollisions is shown on each panel for comparison. In the
60–80% centrality bin, where the e
ffects of quenching are expected to be the smallest, the Pb
+Pb data
are generally consistent with the
ppdata. In more central Pb+Pb collisions, the distributions become
significantly broader than that in
ppcollisions and the peak at
xJ∼1, corresponding to nearly-symmetric
dijet events, is reduced. The distribution becomes almost flat over the range 0.5
. xJ .1, before
developing a peak at
xJ∼0.5 in the most central collisions.
xJ
0.2 0.3 0.4 0.5 0.6 0.7 0.8 0.9 1
JxdN
d
N1
0 0.5 1 1.5 2 2.5 3 3.5 4
< 126 GeV pT
100 < 0 - 10 %
Pb+Pb pp
xJ
0.2 0.3 0.4 0.5 0.6 0.7 0.8 0.9 1
JxdN
d
N1
0 0.5 1 1.5 2 2.5 3 3.5 4
10 - 20 % Preliminary
ATLAS
data, 4.0 pb-1
pp 2013
2011 Pb+Pb data, 0.14 nb-1
= 2.76 TeV sNN
= 0.4 jets,
tR k anti-
xJ
0.2 0.3 0.4 0.5 0.6 0.7 0.8 0.9 1
JxdN
d
N1
0 0.5 1 1.5 2 2.5 3 3.5 4
20 - 30 %
xJ
0.2 0.3 0.4 0.5 0.6 0.7 0.8 0.9 1
JxdN
d
N1
0 0.5 1 1.5 2 2.5 3 3.5 4
30 - 40 %
xJ
0.2 0.3 0.4 0.5 0.6 0.7 0.8 0.9 1
JxdN
d
N1
0 0.5 1 1.5 2 2.5 3 3.5 4
40 - 60 %
xJ
0.2 0.3 0.4 0.5 0.6 0.7 0.8 0.9 1
JxdN
d
N1
0 0.5 1 1.5 2 2.5 3 3.5 4
60 - 80 %
Figure 2: The N1 dN
dxJ distributions for pairs with 100 < pT1 < 126 GeV for different collision centralities. The Pb+Pb data is shown in red, while theppdistribution is shown for comparison in blue, and is the same in all panels.
Statistical uncertainties are indicated by the error bars while systematic uncertainties are shown with shaded boxes.
xJ
0.2 0.3 0.4 0.5 0.6 0.7 0.8 0.9 1
JxdN
d
N1
0 0.5 1 1.5
2 2.5 3 3.5 4
< 126 GeV pT
100 <
0 - 10 % Pb+Pb pp
xJ
0.2 0.3 0.4 0.5 0.6 0.7 0.8 0.9 1
JxdN
d
N1
0 0.5 1 1.5 2 2.5 3 3.5 4
< 158 GeV pT
126 <
Preliminary ATLAS
data, 4.0 pb-1
pp 2013
2011 Pb+Pb data, 0.14 nb-1
= 2.76 TeV sNN
= 0.4 jets,
tR k anti-
xJ
0.2 0.3 0.4 0.5 0.6 0.7 0.8 0.9 1
JxdN
d
N1
0 0.5 1 1.5
2 2.5 3 3.5 4
< 200 GeV pT
158 <
xJ
0.2 0.3 0.4 0.5 0.6 0.7 0.8 0.9 1
JxdN
d
N1
0 0.5 1 1.5 2 2.5 3 3.5 4
> 200 GeV pT
Figure 3: The N1 dN
dxJ distributions for different selections onpT1, shown for the 0–10% centrality bin (red) and for pp(blue). Statistical uncertainties are indicated by the error bars while systematic uncertainties are shown with shaded boxes.
Figure 3 shows the
N1d
Ndx
Jfor 0–10% Pb+Pb collisions and
ppcollisions for different selections on
pT1. In
ppcollisions, the
xJdistribution becomes increasingly narrow, indicating that higher
pTdijets tend to be better balanced in momentum (fractionally). The
xJdistribution begins to fall more steeply from
xJ∼1, but appears to flatten at intermediate values of
xJ. The modifications observed in the Pb+Pb data lessen with increasing
pT1and for pairs with
pT1 >200 GeV the maximum at
xJ∼1 is restored.
9 Conclusion
This note has presented a measurement of dijet di
fferential
xJdistributions in
ppand Pb
+Pb collisions at
√sNN =
2.76 TeV. The measurement was performed differentially in leading jet transverse momentum,
pT1, and in collision centrality. The measured distributions were unfolded to account for the e
ffects of
experimental resolution on the two-dimensional
pT1-p
T2distributions and then projected into bins of fixed
xJ. The distributions show a larger contribution of asymmetric dijet pairs in Pb+Pb data compared to that
in
ppdata, a feature that grows with centrality which is consistent with expectations of medium-induced energy loss due to jet quenching. In the 0–10% centrality bin at 100
< pT1 <126 GeV, the
xJdistributions develop a significant peak at
xJ∼0.5 indicating that the most probable configuration for dijets is for them to be highly imbalanced. This is in sharp contrast to the situation in the
ppdata where the most probable values are near
xJ∼1. The centrality-dependent modifications evolve smoothly from central to peripheral collisions, and the results in the 60–80% centrality bin and the
ppdata are generally consistent. At larger values of
pT1the
xJdistributions are observed to narrow and the di
fferences between the distribution central Pb+Pb and the
ppdata lessen. This is consistent with a picture in which the fractional energy loss decreases with jet
pT. The features in the data are compatible with those observed in previous measurements of dijets in Pb
+Pb collisions [3, 8, 35], however, the trends in this measurement are clear due to the application of the unfolding procedure. This result constitutes an important benchmark for theoretical models of jet quenching and the dynamics of relativistic heavy-ion collisions.
References
[1] K. Adcox et al., Nucl. Phys.
A 757(2005) 184–283, arXiv: nucl-ex/0410003.
[2] J. Adams et al., Nucl. Phys.
A 757(2005) 102–183, arXiv: nucl-ex/0501009.
[3] ATLAS Collaboration, Phys. Rev. Lett.
105(2010) 252303, arXiv: 1011.6182 [hep-ex].
[4] J. D. Bjorken, Fermilab Preprint, FERMILAB-PUB-82-059-THY (1982).
[5] ATLAS Collaboration, Phys. Lett.
B719(2013) 220–241, arXiv: 1208.1967 [hep-ex].
[6] ATLAS Collaboration, Phys. Rev. Lett.
114.7 (2015) 072302, arXiv:1411.2357 [hep-ex].
[7] ATLAS Collaboration, Phys. Rev. Lett.
111.15 (2013) 152301, arXiv:1306.6469 [hep-ex].
[8] CMS Collaboration, Phys. Rev. C
84(2011) 24906, arXiv: 1102.1957 [nucl-ex].
[9] CMS Collaboration, Phys. Lett.
B712(2012) 176–197, arXiv: 1202.5022 [nucl-ex].
[10] CMS Collaboration, Phys. Lett.
B718(2013) 773–794, arXiv: 1205.0206 [nucl-ex].
[11] ATLAS Collaboration, Phys. Lett.
B739(2014) 320–342, arXiv: 1406.2979 [hep-ex].
[12] CMS Collaboration, JHEP
1210(2012) 087, arXiv: 1205.5872 [nucl-ex].
[13] CMS Collaboration, Phys. Rev.
C90.2 (2014) 024908, arXiv:1406.0932 [nucl-ex].
[14] M. Cacciari, G. P. Salam and G. Soyez, JHEP
0804(2008) 063, arXiv: 0802.1189 [hep-ph].
[15] ATLAS Collaboration, JINST
3(2008) S08003.
[16] ATLAS Collaboration, Phys. Lett.
B707(2012) 330–348, arXiv: 1108.6018 [hep-ex].
[17] ATLAS Collaboration, Eur.Phys.J.
C73.3 (2013) 2304, arXiv:1112.6426 [hep-ex].
[18] M. L. Miller et al., Ann. Rev. Nucl. Part. Sci.
57(2007) 205–243, arXiv: nucl-ex/0701025.
[19] B. Alver et al. (2008), arXiv: 0805.4411 [nucl-ex].
[20] ATLAS Collaboration, Eur. Phys. J.
C72(2012) 1849, arXiv: 1110.1530 [hep-ex].
[21] S. Agostinelli et al., Nucl. Instrum. Meth.
A 506(2003) 250–303.
[22] ATLAS Collaboration, Eur. Phys. J.
C70(2010) 823–874,
arXiv: 1005.4568 [physics.ins-det].
[23] T. Sjostrand, S. Mrenna and P. Z. Skands, JHEP
0605(2006) 026, arXiv: hep-ph/0603175.
[24] ATLAS Collaboration, ATL-PHYS-PUB-2011-009 (2011),
url: http://cdsweb.cern.ch/record/1363300.
[25] T. Sjostrand, S. Mrenna and P. Z. Skands, Comput. Phys. Commun.
178(2008) 852–867, arXiv: 0710.3820 [hep-ph].
[26] ATLAS Collaboration, ATL-PHYS-PUB-2012-003 (2012),
url:http://cds.cern.ch/record/1474107.
[27] I. Lokhtin and A. Snigirev, Eur. Phys. J.
C45(2006) 211–217, arXiv: hep-ph/0506189.
[28] M. Cacciari, G. P. Salam and G. Soyez, Eur. Phys. J.
C72(2012) 1896, arXiv: 1111.6097 [hep-ph].
[29] ATLAS Collaboration, Eur.Phys.J.
C75.1 (2015) 17, arXiv:1406.0076 [hep-ex].
[30] ATLAS Collaboration, Phys. Rev.
C86(2012) 014907, arXiv: 1203.3087 [hep-ex].
[31] G. D’Agostini, Nucl. Instrum. Meth.
A362(1995) 487–498.
[32] ATLAS Collaboration, ATLAS-CONF-2015-016 (2015),
url: http://cds.cern.ch/record/2008677.
[33] ATLAS Collaboration, Eur. Phys. J.
C73(2013) 2306, arXiv: 1210.6210 [hep-ex].
[34] ATLAS Collaboration, ATLAS-CONF-2015-017 (2015),
url: http://cds.cern.ch/record/2008678.
[35] CMS Collaboration, Phys. Lett.
B730(2014) 243–263, arXiv: 1310.0878 [nucl-ex].
Additional figures
xJ
0.2 0.3 0.4 0.5 0.6 0.7 0.8 0.9 1
JxdN
d
N1
0 0.5 1 1.5 2 2.5 3 3.5 4
< 158 GeV pT
126 < 0 - 10 %
Pb+Pb pp
xJ
0.2 0.3 0.4 0.5 0.6 0.7 0.8 0.9 1
JxdN
d
N1
0 0.5 1 1.5 2 2.5 3 3.5 4
10 - 20 % Preliminary
ATLAS
data, 4.0 pb-1 pp 2013
2011 Pb+Pb data, 0.14 nb-1 = 2.76 TeV sNN = 0.4 jets, tR k anti-
xJ
0.2 0.3 0.4 0.5 0.6 0.7 0.8 0.9 1
JxdN
d
N1
0 0.5 1 1.5 2 2.5 3 3.5 4
20 - 30 %
xJ
0.2 0.3 0.4 0.5 0.6 0.7 0.8 0.9 1
JxdN
d
N1
0 0.5 1 1.5 2 2.5 3 3.5 4
30 - 40 %
xJ
0.2 0.3 0.4 0.5 0.6 0.7 0.8 0.9 1
JxdN
d
N1
0 0.5 1 1.5 2 2.5 3 3.5 4
40 - 60 %
xJ
0.2 0.3 0.4 0.5 0.6 0.7 0.8 0.9 1
JxdN
d
N1
0 0.5 1 1.5 2 2.5 3 3.5 4
60 - 80 %
Figure 4: The N1 dN
dxJ distributions for pairs with 126 < pT1 < 158 GeV for different collision centralities. The Pb+Pb data is shown in red, while theppdistribution is shown for comparison in blue, and is the same in all panels.
Statistical uncertainties are indicated by the error bars while systematic uncertainties are shown with shaded boxes.
xJ
0.2 0.3 0.4 0.5 0.6 0.7 0.8 0.9 1
JxdN
d
N1
0 0.5 1 1.5
2 2.5 3 3.5 4
< 126 GeV pT
100 <
20 - 30 % Pb+Pb pp
xJ
0.2 0.3 0.4 0.5 0.6 0.7 0.8 0.9 1
JxdN
d
N1
0 0.5 1 1.5 2 2.5 3 3.5 4
< 158 GeV pT
126 <
Preliminary ATLAS
data, 4.0 pb-1
pp 2013
2011 Pb+Pb data, 0.14 nb-1
= 2.76 TeV sNN
= 0.4 jets,
tR k anti-
xJ
0.2 0.3 0.4 0.5 0.6 0.7 0.8 0.9 1
JxdN
d
N1
0 0.5 1 1.5
2 2.5 3 3.5 4
< 200 GeV pT
158 <
xJ
0.2 0.3 0.4 0.5 0.6 0.7 0.8 0.9 1
JxdN
d
N1
0 0.5 1 1.5 2 2.5 3 3.5 4
> 200 GeV pT
Figure 5: The N1 dN
dxJ distributions for different selections on pT1, shown for the 20–30% centrality bin (red) and forpp(blue). Statistical uncertainties are indicated by the error bars while systematic uncertainties are shown with shaded boxes.
xJ
0.2 0.3 0.4 0.5 0.6 0.7 0.8 0.9 1
JxdN
d
N1
0 0.5 1 1.5
2 2.5 3 3.5 4
< 126 GeV pT
100 <
60 - 80 % Pb+Pb pp
xJ
0.2 0.3 0.4 0.5 0.6 0.7 0.8 0.9 1
JxdN
d
N1
0 0.5 1 1.5 2 2.5 3 3.5 4
< 158 GeV pT
126 <
Preliminary ATLAS
data, 4.0 pb-1
pp 2013
2011 Pb+Pb data, 0.14 nb-1
= 2.76 TeV sNN
= 0.4 jets,
tR k anti-
xJ
0.2 0.3 0.4 0.5 0.6 0.7 0.8 0.9 1
JxdN
d
N1
0 0.5 1 1.5
2 2.5 3 3.5 4
< 200 GeV pT
158 <
xJ
0.2 0.3 0.4 0.5 0.6 0.7 0.8 0.9 1
JxdN
d
N1
0 0.5 1 1.5 2 2.5 3 3.5 4
> 200 GeV pT
Figure 6: The N1 dN
dxJ distributions for different selections on pT1, shown for the 60–80% centrality bin (red) and forpp(blue). Statistical uncertainties are indicated by the error bars while systematic uncertainties are shown with shaded boxes.
xJ
0.10.2 0.3 0.4 0.5 0.6 0.7 0.8 0.9 1
JxdN
d 1 N
0 0.5 1 1.5 2 2.5 3 3.5 4
Preliminary
ATLAS 0 - 10 %
< 126 GeV pT
100 <
= 2.76 TeV sNN
= 0.4 jets,
tR
k anti-
2011 Pb+Pb data, 0.14 nb-1
xJ
0.1 0.2 0.3 0.4 0.5 0.6 0.7 0.8 0.9 1
JxdN
d 1 N
0 0.5 1 1.5 2 2.5 3 3.5
4 Measured 60 - 80 %
Unfolded
xJ
0.1 0.2 0.3 0.4 0.5 0.6 0.7 0.8 0.9 1
JxdN
d 1 N
0 0.5 1 1.5 2 2.5 3 3.5
4 2013 pp data, 4.0 pb-1 pp
Figure 7: The N1 dN
dxJ before (black) and after unfolding (red) shown for 100 < pT1 <126 GeV, for 0–10% (left), 60–80% (center) Pb+Pb collisions and forppcollisions (right). Statistical uncertainties are indicated by the error bars while systematic uncertainties are shown for the unfolded results with shaded boxes.