ATLAS-CONF-2016-052 08August2016Notreviewed,forinternalcirculationonly
ATLAS NOTE
ATLAS-CONF-2016-052
August 3, 2016
Search for pair production of gluinos decaying via top or bottom squarks in events with b-jets and large missing transverse momentum in p p collisions at √
s = 13 TeV with the ATLAS detector
The ATLAS Collaboration
Abstract
A search for supersymmetry involving the pair production of gluinos decaying via third- generation squarks to the lightest neutralino ( ˜χ0
1) is reported. It uses an LHC proton–proton dataset at a center-of-mass energy
√s = 13 TeVwith an integrated luminosity of 14.8 fb−1 collected with the ATLAS detector in 2015 and 2016. The signal is searched for in events containing several energetic jets, of which at least three must be identified asb-jets, large missing transverse momentum and, potentially, isolated electrons or muons. A topological observable formed from the scalar sum of the mass of large-radius jets in the event is used to enhance signal discrimination. No excess is found above the predicted background. For ˜χ0
1
masses below approximately 200 GeV gluino masses of less than 1.89 TeV are excluded at the 95% CL in simplified models of the pair production of gluinos decaying via sbottom or stop. These results significantly extend the exclusion limits obtained with the 2015 dataset.
© 2016 CERN for the benefit of the ATLAS Collaboration.
Reproduction of this article or parts of it is allowed as specified in the CC-BY-4.0 license.
Notreviewed,forinternalcirculationonly
1 Introduction
Supersymmetry (SUSY) [1–6] is a generalization of space-time symmetries that predicts new bosonic partners to the fermions and new fermionic partners to the bosons of the Standard Model (SM). IfR-parity is conserved [7], SUSY particles are produced in pairs and the lightest supersymmetric particle (LSP) is stable. The scalar partners of the left- and right-handed quarks, the squarks ˜qL and ˜qR, can mix to form two mass eigenstates ˜q1 and ˜q2, ordered by increasing mass. SUSY can suppress scale hierarchy [8–11]
reducing unnatural tuning in the Higgs sector by orders of magnitude provided that the superpartners of the top quark (stop, ˜t1 and ˜t2) have masses not too far above the weak scale. Because of the SM weak isospin symmetry, the mass of the left-handed bottom quark scalar partner (sbottom, ˜bL) is tied to the mass of the left-handed top quark scalar partner (˜tL), and as a consequence the mass of the lightest sbottom b˜1 is also expected to be close to the weak scale. The fermionic partners of the gluons, the gluinos ( ˜g), are also constrained by naturalness [12, 13] to have a mass around the TeV scale in order to limit their contributions to the radiative corrections to the stop masses. For these reasons, and because the gluinos are expected to be pair-produced with a high cross-section at the Large Hadron Collider (LHC), the search for gluino production with decays via stop and sbottom quarks is highly motivated at the LHC.
This note presents the search for gluino pair production decaying via stop or sbottom using a dataset of 14.8 fb−1 of proton–proton data collected with the ATLAS detector [14] at a center-of-mass energy of 13 TeV. The interpretation of the results is done using simplified models [15–17] with a single production mode and 100% branching ratios to a specific decay chain. In these models, both gluinos are assumed to either decay to stops via ˜g →t˜1t, or to sbottoms via ˜g →b˜1b. Each stop (sbottom) is then assumed to decay exclusively to a top (bottom) quark and the LSP: ˜t1 →tχ˜0
1( ˜b1 → bχ˜0
1). The LSP is assumed to be the lightest neutralino ˜χ0
1, a linear superposition of the superpartners of the neutral electroweak and Higgs bosons. The ˜χ0
1interacts only weakly, resulting in final states with substantial missing transverse momentum of magnitudeEmiss
T . The sbottom and stop are assumed to be produced off-shell such that the gluinos effectively undergo the three-body decay ˜g→bb¯χ˜0
1or ˜g→t¯tχ˜0
1, and that the only parameters of the simplified models are the gluino and ˜χ0
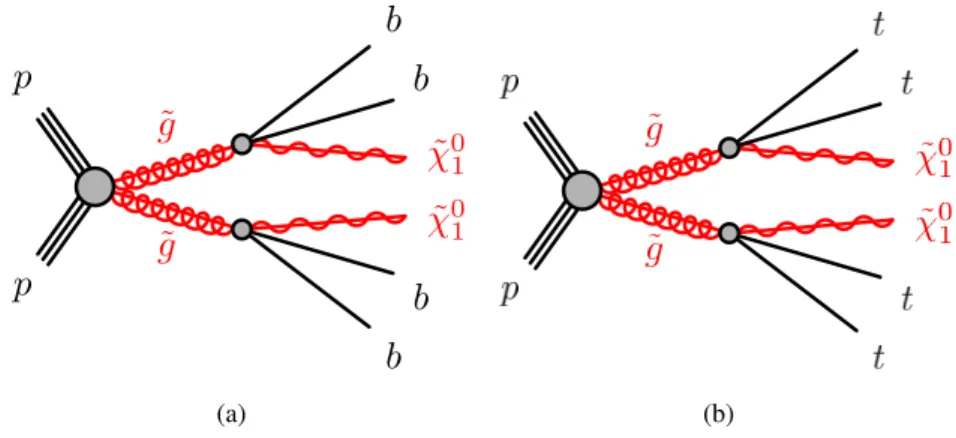
1 masses.1 The masses of the SUSY particles not involved in the process are set to very high values. Diagrams of the simplified models considered in this note, which are referred to as “Gbb” and “Gtt” in the following, are shown in Figures1(a) and1(b), respectively.
˜ g
˜ g p
p
˜ χ01 b
b
˜ χ01
b b
(a) (b)
Figure 1: The decay topologies in the (a) Gbb and (b) Gtt simplified models.
1Models with on-shell sbottom and stop were studied in Run 1 [18] and the limits on the gluino and the ˜χ0
1masses were found to be mostly independent of the stop and sbottom masses, except for stop masses below 500 GeV.
Notreviewed,forinternalcirculationonly
The Gbb experimental signature consists of four energeticb-jets (i.e. jets stemming from the hadronization of a b-quark) and largeEmiss
T . In order to achieve high signal purity, at least three of four required jets must be identified asb-jets (b-tagged). This requirement is very effective in rejectingtt¯events, which constitute the main background for both the Gbb and Gtt signatures, and which contain only twob-jets unless they are produced with additional heavy-flavor jets. The Gtt experimental signature also contains fourb-jets andEmiss
T , but yields in addition fourW bosons originating from the top quark decayst→W b. EachW boson can either decay leptonically (W →`ν) or hadronically (W → qq¯0). A Gtt event would therefore possess a high jet multiplicity, with as many as 12 jets originating from top quark decays and, potentially, isolated charged leptons. In this note, pair-produced gluinos decaying via stop and sbottom quarks are searched for using events with large numbers of jets, of which at least three must be identified asb-jets, largeEmiss
T , and either zero leptons (referred to as Gtt 0-lepton channel) or at least one identified charged lepton2 (referred to as Gtt 1-lepton channel). For both the Gbb and Gtt models, several signal regions are designed to cover different ranges of gluino and ˜χ0
1 masses. For the Gtt models with a large mass difference (mass splitting) between the gluino and ˜χ0
1, the top quarks tend to be highly boosted and their decay products collimated. In the corresponding signal regions, the presence of at least one large-radius, trimmed [19] jet, which is re-clustered from small-radius jets [20], is required. A topological observable, built from the mass of large-radius jets, is used to enhance the signal discrimination in these regions.
This analysis extends the search carried out with the 3.2 fb−1of
√s=13 TeV data recorded by ATLAS in 2015 [21], with signal regions re-optimised for the larger integrated luminosity. The expected (observed) exclusion limits at 95% confidence level (CL) on the gluino masses from the previous analysis are 1.70 (1.78) TeV and 1.68 (1.76) TeV in the Gbb and Gtt simplified models, respectively, for LSP masses below approximatively 700 GeV. Pair-produced gluinos with stop-mediated decays have also been searched for by ATLAS with the 2015 dataset in events containing pairs of same-sign leptons or three leptons [22].
The analysis reported in this note improves the expected limits on the gluino mass by 180 GeV for the Gbb model, and by 220 GeV for the Gtt model with respect to the previous analysis [21].
The CMS experiment also released several analyses searching for pair-produced gluinos decaying via stop and sbottom quarks with the
√s=13 TeV data recording in 2015 [23–31] with results comparable to the ATLAS searches.
2 ATLAS detector
The ATLAS detector is a multipurpose particle physics detector with a forward-backward symmetric cylindrical geometry and nearly 4πcoverage in solid angle.3 The inner tracking detector (ID) consists of silicon pixel and microstrip detectors covering the pseudorapidity region|η| < 2.5, surrounded by a transition radiation tracker, which enhances electron identification in the region|η| < 2.0. Before the start of Run 2, the new innermost pixel layer, the Insertable B-Layer (IBL) [32], was inserted at a mean sensor radius of 3.3 cm. The ID is surrounded by a thin superconducting solenoid providing an axial 2 T magnetic field and by a fine-granularity lead/liquid-argon (LAr) electromagnetic calorimeter covering |η| < 3.2.
A steel/scintillator-tile calorimeter provides coverage for hadronic showers in the central pseudorapidity
2The term “lepton” refers exclusively to an electron or a muon in this note.
3ATLAS uses a right-handed coordinate system with its origin at the nominal interaction point in the center of the detector.
The positivex-axis is defined by the direction from the interaction point to the center of the LHC ring, with the positivey-axis pointing upwards, while the beam direction defines thez-axis. Cylindrical coordinates(r, φ)are used in the transverse plane,φ being the azimuthal angle around thez-axis. The pseudorapidityηis defined in terms of the polar angleθbyη=−ln tan(θ/2).
Notreviewed,forinternalcirculationonly
range (|η| < 1.7). The endcap (1.5 < |η| < 3.2) of the hadronic calorimeter are made of LAr active layers with either copper or tungsten as the absorber material. The forward region (3.1 < |η| < 4.9) is instrumented with a LAr calorimeter for both EM and hadronic measurements. A muon spectrometer with an air-core toroid magnet system surrounds the calorimeters. Three layers of high-precision tracking chambers provide coverage in the range|η| < 2.7, while dedicated fast chambers allow triggering in the region |η| < 2.4. The ATLAS trigger system [33] consists of a hardware-based Level-1 trigger (L1) followed by a software-based High Level Trigger (HLT).
3 Data and simulated event samples
The data used in this analysis were collected by the ATLAS detector fromppcollisions produced by the LHC at a center-of-mass-energy of 13 TeV and 25 ns proton bunch spacing over the 2015 and 2016 data- taking periods. The full dataset corresponds to an integrated luminosity of 14.8 fb−1 with an associated uncertainty of±2.9%, after requiring that all detector subsystems were operational during data recording.
The measurement of the integrated luminosity is derived, following a methodology similar to that detailed in Ref. [34], from a calibration of the luminosity scale using a pair ofx–ybeam-separation scans. Events are required to pass anEmiss
T trigger [35] with cuts at 70 GeV and 100 GeV at the HLT level for the 2015 and 2016 dataset, respectively. These triggers are fully efficient for events passing the preselection defined in Section5. Each event includes on average 14 and 21 additional inelasticppcollisions (“pileup”) in the same bunch crossing in the 2015 and 2016 data, respectively.
Simulated event samples are used to model the signal and background processes in this analysis. The signal samples for the Gbb and Gtt processes are generated with up to two additional partons using MadGraph5_aMC@NLO [36] v2.2.2 at leading order (LO) with CTEQ6L1 [37] Parton Density Function (PDF) sets and interfaced to Pythia v8.186 [38] for the modeling of the parton showering, hadronization and underlying event.
The dominant background in the signal regions is the production oftt¯pairs with additional high-pT jets.
For the generation oft¯tand single top-quarks in theW t- ands-channel the Powheg-Box [39] v2 generator with the CT10 [40] PDF sets in the matrix element calculations is used. Electroweakt-channel single top-quark events are generated using the Powheg-Box v1 generator. This generator uses the 4-flavour scheme for the NLO matrix elements calculations together with the fixed four-flavour PDF set CT10f4.
For all top processes, top-quark spin correlations are preserved (in thet-channel, top quarks are decayed using MadSpin [41]). The parton shower, fragmentation, and the underlying event are simulated using Pythia6.428 [42] with the CTEQ6L1 PDF sets. The EvtGen v1.2.0 program [43] is used to simulate the properties of the bottom and charm hadron decays. Thehdampparameter in Powheg, which controls the pT of the first additional emission beyond the Born level and thus regulates thepTof the recoil emission against thet¯t system, is set to the mass of the top quark (mtop =172.5 GeV). This setting was found to give the best description of thepTof thet¯tsystem [44]. All events with at least one leptonically decaying W-boson are included. Fully hadronict¯tand single top events do not contain sufficientEmiss
T to contribute significantly to the background.
Smaller backgrounds in the signal region come from the production of tt¯ pairs in association with W/Z/h bosons and possibly additional jets, production ofttt¯¯t,W/Z+jets andW W/W Z/Z Z (diboson) events. The production oft¯tpairs in association with electroweak vector bosonsWandZ are modeled by samples generated at LO using MadGraph5_aMC@NLO v2.2.2 and showered with Pythia v8.186, while samples to modelt¯t hproduction are generated using MadGraph5_aMC@NLO v2.2.1 and showered with
Notreviewed,forinternalcirculationonly
Herwig++ [45] v2.7.1. These samples are described in detail in Ref. [46]. MadGraph5_aMC@NLO is also used to simulate thet¯ttt¯production. W/Z+jets processes are simulated using the Sherpa v2.2 [47]
generator, while Sherpa v2.1.1 is used to simulate diboson production processes. Matrix elements for theW/Z+jets and diboson processes are calculated using the Comix [48] and OpenLoops [49] generators and merged with the Sherpa parton shower [50] using the ME+PS@NLO prescription [51]. The Sherpa diboson sample cross section has been scaled down to account for its use ofαQED=1/129 rather than 1/132, corresponding to the use of current PDG parameters, as input to theGµ scheme [52]. Samples generated using MadGraph5_aMC@NLO v2.2.2 are produced with NNPDF 2.3 [53] PDF sets, while all other samples are generated with CT10 PDFs.
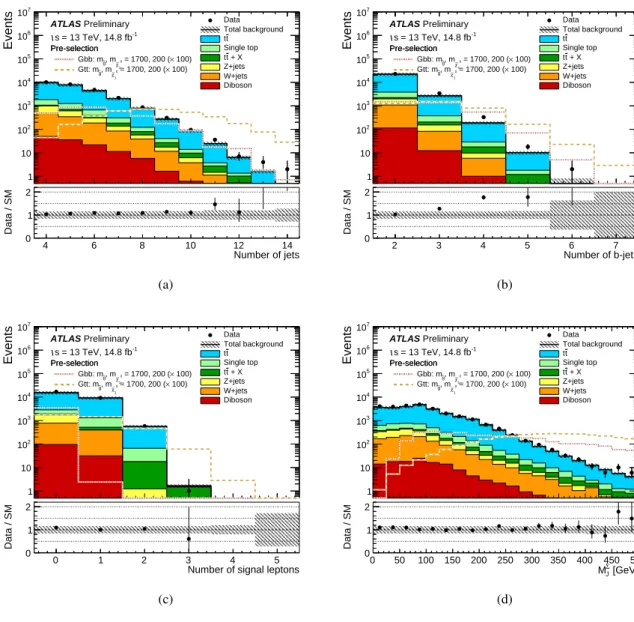
All simulated event samples, with the exception of the Gbb signals, are passed through the full ATLAS detector simulation using Geant4 [54]. The Gbb signal samples are passed through a fast simulation that uses a parameterized description to simulate the response of the calorimeter systems [55]. The simulated events are reconstructed with the same algorithm as that used for data. All Pythia v6.428 samples use the PERUGIA2012 (P2012) [56] set of tuned parameters (tune) for the underlying event, while Pythia v8.186 and Herwig++ showering are run with the A14 [57] and UEEE5 [58] underlying-event tunes, respectively. In-time and out-of-time pileup interactions from the same or nearby bunch-crossings are simulated by overlaying additionalppcollisions generated by Pythia v8.186 on top of the hard-scattering events. Details of the sample generation and normalization are summarized in Table1. Additional samples with different generators and settings are used to estimate systematic uncertainties on the backgrounds, as described in Section6.
The signal samples are normalized using the best cross-sections calculated at NLO in the strong coupling constant, adding the resummation of soft gluon emission at next-to-leading-logarithmic (NLL) accuracy [59–63]. The nominal cross-section and the uncertainty are taken from an envelope of cross-section predictions using different PDF sets and factorization and renormalization scales, as described in Ref. [64].
The cross-section of gluino pair-production in these simplified models is approximately 325 fb for a gluino mass of 1 TeV, falling to 2.8 fb for 1.8 TeV mass gluinos. All background processes are normalized to the best available theoretical calculation for their respective cross-sections. The order of this calculation in perturbative QCD (pQCD) for each process is listed in Table1.
4 Object reconstruction
Interaction vertices from the proton–proton collisions are reconstructed from at least two tracks with pT > 0.4 GeV, and are required to be consistent with the beamspot envelope. The primary vertex is identified as the one with the largest sum of squares of the transverse momenta from associated tracks (P
|pT,track|2) [71].
Basic selection criteria are applied to define candidates for electrons, muons and jets in the event. An overlap removal procedure is applied to these candidates to prevent double-counting. Further requirements are then made to select the final signal leptons and jets from the remaining objects. The details of the object selections and of the overlap removal procedure are given below.
Candidate jets are reconstructed from three-dimensional topological energy clusters [72] in the calorimeter using the anti-kt jet algorithm [73] with a radius parameter of 0.4 (small-Rjets). Each topological cluster is calibrated to the electromagnetic scale response prior to jet reconstruction. The reconstructed jets are then calibrated to the particle level by the application of a jet energy scale (JES) derived from
√s=13 TeV
Notreviewed,forinternalcirculationonly
Process Generator Tune PDF set Cross-section
+ fragmentation/hadronization order
Gbb/Gtt MadGraph5_aMC@NLO-2.2.2 A14 CTEQ6L1 NLO+NLL [59–64]
+ Pythia v8.186
tt¯ Powheg-Box v2 PERUGIA2012 CT10 NNLO+NNLL [65]
+ Pythia-6.428
Single top Powheg-Box v1 or v2 PERUGIA2012 CT10 NNLO+NNLL [66–68]
+ Pythia-6.428
ttW¯ /t¯t Z/4-tops MadGraph-2.2.2 A14 NNPDF2.3 NLO [36]
+ Pythia-8.186
t¯t h MadGraph5_aMC@NLO-2.2.1 UEEE5 CT10 NLO [69]
+ Herwig++-2.7.1
Diboson Sherpa-2.1.1 Default CT10 NLO [52]
W W,W Z,Z Z
W/Z+jets Sherpa-2.2 Default CT10 NNLO [70]
Table 1: List of generators used for the different processes. Information is given about the underlying-event tunes, the PDF sets and the pQCD highest-order accuracy used for the normalization of the different samples.
data and simulations [74, 75]. Quality criteria are imposed to reject events that contain at least one jet arising from non-collision sources or detector noise [76]. Further selections are applied to reject jets that originate from pileup interactions [77]. Candidate jets are required to havepT >20 GeV and|η| < 2.8.
Signal jets, selected after resolving overlaps with electrons and muons, are required to satisfy the stricter requirement ofpT>30 GeV.
A multivariate algorithm using information about the impact parameters of inner detector tracks matched to the jet, the presence of displaced secondary vertices, and the reconstructed flight paths of b- and c-hadrons inside the jet [78,79] is used to tag b-jets. Theb-tagging working point corresponding to an efficiency to identifyb-jets withpT > 20 GeV of 77%, as determined from a simulated sample oft¯tevents, was found to be optimal. The corresponding rejection factors against jets originating fromc-quarks, from τ-leptons and from light quarks and gluons in the same sample at this working point are 6, 22 and 134, respectively.
After resolving the overlap with leptons, the candidate small-R jets are used as inputs for further jet re-clustering [20] using the anti-kt algorithm with a radius parameter of 0.8. The calibration from the input small-Rjets propagates directly to the re-clustered jets. These re-clustered jets are then trimmed [19, 20,80,81] by removing subjets whosepTfalls below fcut=10% of thepTof the original re-clustered jet.
The resulting large-Rjets are selected by requiring them to have pT >100 GeV and|η| <2.0. When it is not explicitly stated otherwise, the term “jets” in this paper refers to small-Rjets.
Electron candidates are reconstructed from energy clusters in the electromagnetic calorimeter and inner detector tracks and are required to satisfy a set of “loose” quality criteria [82,83]. They are also required to have|η| <2.47. Muon candidates are reconstructed from matching tracks in the inner detector and in the muon spectrometer. They are required to meet “medium” quality criteria, as described in Ref. [84], and to have|η| <2.5. All electron and muon candidates must havepT >20 GeV and survive the overlap
Notreviewed,forinternalcirculationonly
removal procedure. Signal leptons are chosen from the candidates if they fulfill the requirement that the scalar sum ofpTof additional inner detector tracks in an isolation cone around the lepton track is<5% of the leptonpT. The angular separation between the lepton and theb-jet ensuing from a semileptonic top quark decay narrows as thepT of the top quark increases. This increased collimation is accounted for by varying the radius of the isolation cone as min(0.2, 10/plep
T ), whereplep
T is the leptonpTexpressed in GeV.
Signal electrons are further required to meet the “tight” quality criteria, while signal muons are required to satisfy the same “medium” quality criteria as the muon candidates. Electrons (muons) are matched to the primary vertex by requiring the transverse impact parameterd0to satisfy|d0|/σd0 <5 (3), where σd0is the measured uncertainty ofd0, and the longitudinal impact parameterz0to satisfy|z0sinθ| <0.5 mm4. In addition, events containing one or more muon candidates with|d0|(|z0|)>0.2 mm (1 mm) are rejected to suppress cosmic rays.
Overlaps between candidate objects are removed sequentially. Firstly, electron candidates that lie∆R <
0.015from muon candidates are removed to suppress contributions from muon bremsstrahlung. Overlaps between electron and jet candidates are resolved next, and finally, overlaps between remaining jets and muon candidates are removed.
Overlap removal between electron and jet candidates aims to remove jets that are formed primarily from the showering of a prompt electron and electrons that are produced in the decay chains of hadrons.
Consequently, any non-b-tagged jet whose axis lies ∆R < 0.2 from an electron is discarded. If the electron is within∆R = min(0.4,0.04+10 GeV/pT) of the axis of any jet remaining after this initial overlap removal procedure, the jet is retained and the electron is removed.
The overlap removal procedure between muon and jet candidates is designed to remove those muons that are likely to have originated from the decay of hadrons and to retain the overlapping jet. Jets and muons may also appear in close proximity when the jet results from high-pT muon bremsstrahlung, and in such cases the jet should be removed and the muon retained. Such jets are characterized by having very few matching inner detector tracks. Therefore, if the angular distance∆Rbetween a muon and a jet is within min(0.4, 0.04 + 10 GeV/pT), the jet is removed if it is notb-tagged and either has fewer than three matching inner detector tracks or has apT that is less than 50% of the pT of the muon. Otherwise, the muon is removed and the jet is kept.
The missing transverse momentum (Emiss
T ) in the event is defined as the magnitude of the negative vector sum transverse momentum (p~Tmiss) of all selected and calibrated objects in the event, with an extra term added to account for soft energy that is not associated to any of the selected objects. This soft term is calculated from inner detector tracks matched to the primary vertex to make it more resilient to contamination from pileup interactions [85,86] .
Corrections derived from data control samples are applied to simulated events to account for differences between data and simulation in the reconstruction efficiencies, momentum scale and resolution of leptons and in the efficiency and false positive rate for identifyingb-jets.
4Both transverse and longitudinal impact parameters are defined with respect to the selected primary vertex.
5∆R=q
(∆y)2+(∆φ)2defines the distance in rapidityyand azimuthal angleφ.
Notreviewed,forinternalcirculationonly
5 Event selection
The event selection criteria are defined based on kinematic requirements on the objects defined in Section4 and on the following event variables.
Two effective mass variables are used, which would typically have much higher values in pair-produced gluino events than in background events. The Gtt signal regions employ the inclusive effective mass mincl
eff :
mincl
eff =X
i
pTjeti +X
j
pT`j +Emiss
T ,
where the first and second sums are over the signal jets and leptons, respectively. The signal regions for the Gbb models, for which four high-pTb-jets are expected, are defined usingm4j
eff: m4j
eff =X
i≤4
pTjeti +Emiss
T ,
where the sum is over the four highest-pT(leading) signal jets in the event.
In regions with at least one signal lepton, the transverse massmTof the leading signal lepton (`) andEmiss
T
is used to discriminate between the signal and backgrounds from semileptonict¯tandW+jets events:
mT=q 2p`
TEmiss
T {1−cos[∆φ(p~Tmiss, `)]}.
Neglecting resolution effects,mTis bounded from above by theWboson mass for these backgrounds and typically has higher values for Gtt events. Another useful transverse mass variable ismb-jets
T,min, the minimum transverse mass formed byEmiss
T and any of the three leadingb-tagged jets in the event:
mb-jets
T,min=mini≤3
q 2pb-jeti
T Emiss
T {1−cos[∆φ(p~Tmiss,b-jeti)]}
! .
It is bounded below the top quark mass for semileptonict¯tevents while peaking at higher values for Gbb and Gtt events.
In the Gtt signal regions, the large number of high-pTtop quarks in signal events can be exploited by using the total jet mass variable, defined as:
MJΣ =X
i≤4
mJ,i (1)
wheremJ refers to the mass of large-radius re-clustered jets in the event. The variable is sensitive to the large amount of hadronic energy and the large degree of angular structure found in the signal events due to the presence of multiple hadronically decaying boosted objects. Background processes, dominated by semi-leptonic and di-leptonict¯t events, are expected to have a much smaller degree of structure at this scale and correspondingly small value of the total jet mass.
The signal regions require either zero or at least one lepton. The requirement of a signal lepton, with the additional requirements on jets, Emiss
T and event variables described in Section5.1, render the multijet background negligible for the≥ 1-lepton signal regions. For the 0-lepton signal regions, the minimum
Notreviewed,forinternalcirculationonly
azimuthal angle betweenp~Tmiss and the leading four small-R jets in the event,∆φ4jmin, is required to be greater than 0.4:
∆φ4jmin=min(|φjet
1−φp~
T
miss|, ...,|φjet
4−φp~
T
miss|) > 0.4. This requirement ensures that the multijet background, which can produce largeEmiss
T if containing poorly measured jets or neutrinos emitted close to the axis of a jet, is also negligible in the 0-lepton signal regions (along with the other requirements on jets,Emiss
T and event variables described in Section5.1).
[GeV]
miss ET
Events
1 10 102
103
104
105
106
107
ATLAS Preliminary = 13 TeV, 14.8 fb-1
s
Data Total background
t t Single top
+ X t t Z+jets W+jets Diboson Pre-selection
Pre-selection
100)
× = 1700, 200 (
0 1
, mχ∼
~g
Gbb: m
100)
× = 1700, 200 (
0 1
, mχ∼
g~
Gtt: m
[GeV]
miss
ET
200 300 400 500 600 700 800
Data / SM
0 1 2
(a)
[GeV]
incl meff
Events
1 10 102
103
104
105
106
107
ATLAS Preliminary = 13 TeV, 14.8 fb-1
s
Data Total background
t t Single top
+ X t t Z+jets W+jets Diboson Pre-selection
Pre-selection
100)
× = 1700, 200 (
0 1
, mχ∼
g~
Gbb: m
100)
× = 1700, 200 (
0 1
, mχ∼
g~
Gtt: m
[GeV]
incl
meff
500 1000 1500 2000 2500 3000
Data / SM
0 1 2
(b)
) [GeV]
miss (b-jets,ET min mT
Events
1 10 102
103
104
105
106
107
ATLAS Preliminary = 13 TeV, 14.8 fb-1
s
Data Total background
t t Single top
+ X t t Z+jets W+jets Diboson Pre-selection
Pre-selection
100)
× = 1700, 200 (
0 1
, mχ∼
~g
Gbb: m
100)
× = 1700, 200 (
0 1
, mχ∼
g~
Gtt: m
) [GeV]
miss
(b-jets,ET min
mT
0 50 100 150 200 250 300 350 400
Data / SM
0 1 2
(c)
) [GeV]
miss (lepton,ET mT
Events
1 10 102
103
104
105
106
107
ATLAS Preliminary = 13 TeV, 14.8 fb-1
s
Data Total background
t t Single top
+ X t t Z+jets W+jets Diboson Pre-selection
Pre-selection
100)
× = 1700, 200 (
0 χ∼1 g, m Gtt: m~
) [GeV]
miss
(lepton,ET
mT
0 50 100 150 200 250 300 350 400
Data / SM
0 1 2
(d)
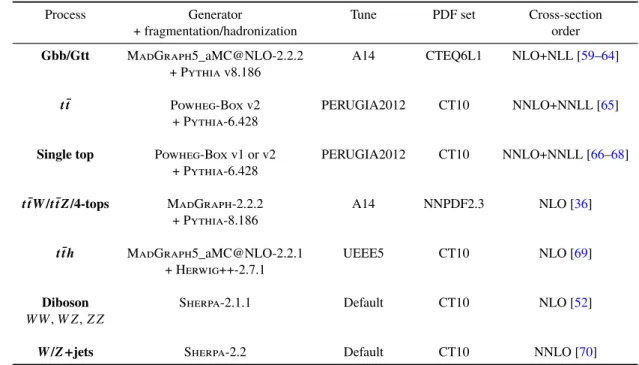
Figure 2: Distributions of kinematic variables in the preselection region described in the text: (a)Emiss
T , (b)mincl
eff , (c) mb-jets
T,min, and (d)mTfor preselected events with at least one signal lepton. The statistical and experimental systematic uncertainties (as defined in Section6) are included in the uncertainty band. The lower part of each figure shows the ratio of data to the background prediction. All backgrounds (includingt¯t) are normalized using the best available theoretical calculation described in Section3. The background categoryt¯t+XincludesttW¯ /Z,t¯t handttt¯t¯events.
Example signal models with cross-sections enhanced by a factor of 100 are overlaid for comparison.
Figure2shows the kinematic distributions ofEmiss
T ,mincl
eff ,mbT,min-jets andmT for a preselection that requires
Notreviewed,forinternalcirculationonly
Number of jets
Events
1 10 102
103
104
105
106
107
ATLAS Preliminary = 13 TeV, 14.8 fb-1
s
Data Total background
t t Single top
+ X t t Z+jets W+jets Diboson Pre-selection
Pre-selection
100)
× = 1700, 200 (
0 1
, mχ∼
~g
Gbb: m
100)
× = 1700, 200 (
0 χ∼1 g, m Gtt: m~
Number of jets
4 6 8 10 12 14
Data / SM
0 1 2
(a)
Number of b-jets
Events
1 10 102
103
104
105
106
107
ATLAS Preliminary = 13 TeV, 14.8 fb-1
s
Data Total background
t t Single top
+ X t t Z+jets W+jets Diboson Pre-selection
Pre-selection
100)
× = 1700, 200 (
0 1
, mχ∼
g~
Gbb: m
100)
× = 1700, 200 (
0 χ∼1 g, m Gtt: m~
Number of b-jets
2 3 4 5 6 7
Data / SM
0 1 2
(b)
Number of signal leptons
Events
1 10 102
103
104
105
106
107
ATLAS Preliminary = 13 TeV, 14.8 fb-1
s
Data Total background
t t Single top
+ X t t Z+jets W+jets Diboson Pre-selection
Pre-selection
100)
× = 1700, 200 (
0 1
, mχ∼
~g
Gbb: m
100)
× = 1700, 200 (
0 χ∼1 g, m Gtt: m~
Number of signal leptons
0 1 2 3 4 5
Data / SM
0 1 2
(c)
[GeV]
Σ MJ
Events
1 10 102
103
104
105
106
107
ATLAS Preliminary = 13 TeV, 14.8 fb-1
s
Data Total background
t t Single top
+ X t t Z+jets W+jets Diboson Pre-selection
Pre-selection
100)
× = 1700, 200 (
0 1
, mχ∼
g~
Gbb: m
100)
× = 1700, 200 (
0 χ∼1 g, m Gtt: m~
[GeV]
Σ
MJ
0 50 100 150 200 250 300 350 400 450 500
Data / SM
0 1 2
(d)
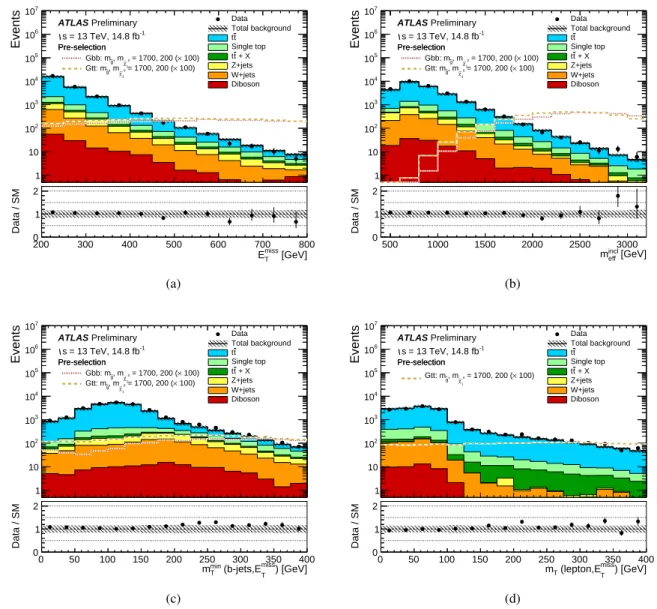
Figure 3: Distributions of (a) the number of signal jets, (b) the number ofb-tagged jets and (c) the number of signal leptons, and (d)MJΣ in the preselection region described in the text. The statistical and experimental systematic uncertainties (as defined in Section6) are included in the uncertainty band. The lower part of each figure shows the ratio of data to the background prediction. All backgrounds (includingt¯t) are normalized using the best available theoretical calculation described in Section3. The background categoryt¯t+XincludesttW¯ /Z,t¯t handttt¯t¯events.
Example signal models with cross-sections enhanced by a factor of 100 are overlaid for comparison.
Notreviewed,forinternalcirculationonly
Emiss
T >200 GeV, at least four signal jets of which at least two must beb-tagged, and∆φ4jmin>0.4. Figure3 shows the multiplicity of signal jets,b-tagged signal jets, signal leptons and the MJΣ distribution in the same preselection region. In both plots, the uncertainty bands include the statistical and experimental systematic uncertainties, as described in Section3, but not the theoretical uncertainties on the background modeling. A discrepancy between data and simulation is observed for the number ofb-tagged jets, but it has a negligible impact on the background estimate after the renormalization of the simulation in dedicated control regions with the sameb-tagged jets requirements as the signal regions, as described in section5.2.
Example signal models with enhanced cross-sections are overlaid for comparison.
5.1 Signal regions
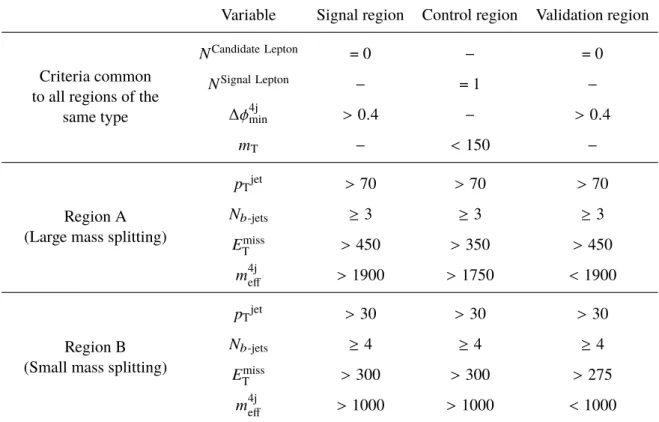
The signal regions are designed by optimizing the expected signal discovery reach. They are defined in Tables 2, 3 and4 for the Gbb, Gtt 0-lepton and Gtt 1-lepton channels, respectively, and are discussed below. These tables also contain the definition of the control regions used to normalize thet¯tbackground, discussed in Section5.2, and the validation regions used to cross-check the background estimate and which are discussed in Section5.3. The following region nomenclature is used in the remainder of the note. Signal, control and validation region names start with the prefix “SR”, “CR” and “VR”, respectively.
For validation regions in the Gtt channels, the prefix contains an additional part to specify the particular type of the validation region. The name of the region is completed by the targeted final state and a letter corresponding to the level of mass splitting between the gluino and the LSP. For example the validation region that cross-checks the extrapolation overmTfor the Gtt 1-lepton region A is denoted by
“VR-mT-Gtt-1L-A”.
The experimental signature for the Gbb model is characterized by four high-pT b-jets, largeEmiss
T and no leptons (Figure1(a)). The following requirements are applied to all Gbb signal regions. Events containing a candidate lepton are vetoed and at least four signal small-Rjets are required, of which at least three must beb-tagged. The remaining multijet background is rejected by requiring ∆φ4jmin > 0.4. The Gbb signal regions are described in the leftmost column of Table 2. Two signal regions A and B are designed to cover Gbb models with either large or small mass splittings between the gluino and the LSP, respectively.
The signal region A features more stringent cuts onEmiss
T ,m4j
eff and the transverse momentumpTjetof the required jets, while the signal region B requires at least fourb-tagged jets to compensate for the softer kinematic cuts.
The experimental signature for the Gtt model is characterized by several high-pTjets of which four areb- jets, largeEmiss
T and potentially leptons (Figure1(b)). The Gtt signal regions are classified into regions with a signal lepton veto (0-lepton channel) and regions with at least one signal lepton (1-lepton channel). The Gtt 0-lepton signal regions are defined in the leftmost column of Table3. In all Gtt 0-lepton signal regions at least eight signal jets, of which at least three must beb-tagged,∆φ4jmin >0.4 andmb-jets
T,min >80 GeV are required. Two Gtt 0-lepton signal regions are defined to cover Gtt models with different mass splittings between the gluino and the sum of the mass of the two top quarks and the LSP. The requirements on mincl
eff and MJΣ decrease with the mass splitting between the gluino and the LSP due to the softer signal kinematics.
The Gtt 1-lepton signal regions are defined in the leftmost column of Table4. Three signal regions are defined to cover Gtt models with different mass splittings between the gluino and the LSP. In all signal regions at least one signal lepton and at least six signal jets are required. Regions A and B, targeting large and moderate mass splittings, respectively, have tighter requirements onmincl
eff and mb-jets
T,minplus an