ATLAS-CONF-2015-041 31August2015
ATLAS NOTE
ATLAS-CONF-2015-041
31st August 2015
Measurement of the Production Cross Sections of a Z Boson in Association with Jets in p p collisions at √
s = 13 TeV with the ATLAS Detector
The ATLAS Collaboration
Abstract
Preliminary measurements of the cross section for the production of aZboson in association with jets in pp collisions at
√s = 13 TeV are presented, using data corresponding to an integrated luminosity of 85 pb−1 collected by the ATLAS experiment at the Large Hadron Collider. The cross sections are measured for events containing a Z boson decaying to electrons or muons and produced in association with up to four jets in the kinematical range ofpT >30GeV and|y| <2.5. The observed cross sections are compared to predictions from different Monte Carlo generators based on leading-order and next-to-leading-order matrix elements supplemented by parton showers.
© 2015 CERN for the benefit of the ATLAS Collaboration.
1 Introduction
The measurement of weak vector boson production at hadron colliders provides a benchmark of our understanding of quantum chromodynamic (QCD) and electroweak (EW) processes. The relatively large production cross sections and easily identifiable decays to leptonic final states offer a clean experimental signature which can be measured to high precision. In light of this, the inclusive W± and Z boson production cross sections in 13 TeV pp collisions have been recently measured [1] by the ATLAS experiment at the Large Hadron Collider (LHC). These measurements are complemented here by the analysis ofZboson events produced in association with jets. Such processes, previously measured by the ATLAS collaboration at a centre of mass energy of 7 TeV [2], represent an important test of perturbative QCD and constitute a non-negligible background for studies of the Higgs boson and searches for new phenomena. Predictions from the most recent generators combine NLO multi-leg matrix elements with a parton shower, but must still be tuned and validated with data.
In this note,pp collision data corresponding to an integrated luminosity of 85 pb−1, collected at
√s of 13 TeV with the ATLAS detector during the LHC Run 2, are used for a measurement of the Z boson production cross section in association with up to four jets. TheZ boson is identified using its decays to electron and muon pairs (Z →ee,Z →µµ). The ratios of the production cross section for successive jet multiplicities are also presented. The analysed dataset and the Z boson leptonic final state selection are consistent with the inclusive analysis previously mentioned [1].
2 The ATLAS detector
The ATLAS experiment [3] is a multi-purpose particle detector with a forward-backward symmetric cylindrical geometry and nearly 4πcoverage in solid angle.1 The collision point is surrounded by inner tracking devices followed by a superconducting solenoid providing a 2 T magnetic field, a calorimeter system, and a muon spectrometer.
The inner tracker provides precision tracking of charged particles for pseudorapidities|η| <2.5. It consists of pixel and silicon-microstrip detectors inside a transition radiation tracker. One significant upgrade for the new 13 TeV running period is the presence of the Insertable B-Layer [4], an additional pixel layer that provides high-resolution hits at small radius to improve tracking performance.
In the pseudorapidity region|η| < 3.2, high-granularity lead/liquid-argon (LAr) electromagnetic (EM) sampling calorimeters are used. An iron/scintillator tile calorimeter measures hadron energies for|η| <
1.7. The endcap and forward regions, spanning 1.5 < |η| <4.9, are instrumented with LAr calorimeters for both EM and hadronic measurements.
The muon spectrometer consists of three large superconducting toroids with eight coils each, a system of trigger chambers, and precision tracking chambers, which provide triggering and tracking capabilities in the ranges|η|< 2.4 and|η| <2.7, respectively.
1ATLAS uses a right-handed coordinate system with its origin at the nominal interaction point (IP) in the centre of the detector and thez-axis along the beam pipe. The x-axis points from the IP to the centre of the LHC ring, and the y-axis points upward. Cylindrical coordinates (r,φ) are used in the transverse plane,φbeing the azimuthal angle around the beam pipe.
The pseudorapidity is defined in terms of the polar angleθasη=−ln tan(θ/2).
A two-level trigger system is used to select events. The first-level trigger is implemented in hardware and uses a subset of the detector information. This is followed by the software-based High-Level Trigger (HLT) system, which runs offline reconstruction and calibration software, reducing the event rate to less than 1 kHz.
3 Dataset and simulated samples
The data were collected by the ATLAS detector during the period of June 13 to July 16, 2015. During this period, the LHC circulated 6.5 TeV proton beams with 50 ns bunch spacing. The peak delivered instantaneous luminosity wasL=1.7×1033cm−1s−1, and the mean number of additionalppinteractions per bunch crossing (pileup events) in the dataset washµi=19.
The dataset is screened for problems with subdetector systems or operational inefficiencies, and the data passing these basic data-quality requirements correspond to a total integrated luminosity of 85 pb−1. The uncertainty on the integrated luminosity is±9%. It is derived, following a methodology similar to that detailed in Ref. [5], from a preliminary calibration of the luminosity scale using a pair ofx-ybeam separation scans performed in June 2015.
Monte Carlo (MC) simulations, normalised to the results of the highest order calculations available, are used in the following to compare data to Z + jets predictions and to estimate the contribution from background events.
Signal events, containing a Z boson with associated jets, were simulated using the Sherpa v2.1.1 [6]
generator. Matrix elements were calculated for up to two partons at NLO and up to four additional partons at LO using the Comix [7] and OpenLoops [8] matrix element generators and merged with the Sherpa parton shower [9] using the ME+PS@NLO prescription [10]. The CT10 PDF set [11] was used in conjunction with dedicated parton shower tuning developed by the Sherpa authors. Simulated samples of Z+ jets production were also produced with the MadGraph5_aMC@NLO v2.2.2 generator [12], using explicit matrix elements for up to four partons at leading order, interfaced to the Pythia v8.186 parton shower model [13]. The A14 parton shower tune was used together with the NNPDF23LO PDF set [14]. The EvtGen v1.2.0 program [15] was used for properties of the bottom and charm hadron decays. TheZ boson samples are normalised to the next-to-next-to-leading order (NNLO) perturbative QCD inclusive predictions calculated with FEWZ3.1 program [16–19] with CT10NNLO PDFs [11], as detailed in Ref. [1].
The MC simulations for signal differ from the ones used in the inclusiveW±andZanalyses [1], where the Powheg-Box v2 [20–22] simulation program, interfaced with the Pythia v8.186 parton shower, was used for single boson [23] production. The Sherpa v2.1.1 and MadGraph5_aMC@NLO v2.2.2 generators are used in this note instead, as they are expected to better model the emission of additional partons. The Powheg + Pythia sample is used to model the smallZ →ττbackground.
Samples of top quark pair production were generated with the Powheg-Box v2 generator and Pythia v6.428 [24] (Perugia 2012 tune [25]). The samples are normalised to the cross section calculated at NNLO+NNLL (next-to-next-to-leading-log) with the Top++2.0 program [26].
Diboson processes with four charged leptons, three charged leptons and one neutrino, or two charged leptons and two neutrinos were simulated using the Sherpa v2.1.1 generator. The matrix elements contain the doubly-resonantW W,W Z and Z Z processes, and all other diagrams with four electroweak
Physics process Generator (σ·BR)[pb] Order Reference Z→`+`−+jets (m``>40 GeV) Sherpa v2.1.1 2091±5% NNLO [16–19]
Z→`+`−+jets (m``>40 GeV) MadGraph5 2091±5% NNLO [16–19]
W→`ν (`=e, µ, τ) Powheg +Pythia 8 20400±5% NNLO [16–19]
Z→`+`− (m``>60 GeV) Powheg +Pythia 8 1979±5% NNLO [16–19]
tt (mt=172.5 GeV) Powheg +Pythia 6 830±6% NNLO+NNLL [26]
Dibosons Sherpa 99±6% NLO [6]
Dijet (echannel, ˆpT>21 GeV) Pythia 8 180×103 LO [13]
bb(µchannel, ˆpT>15 GeV) Pythia 8 188 LO [13]
cc(µchannel, ˆpT>15 GeV) Pythia 8 58 LO [13]
Table 1: Signal and background MC samples and the generators used in the simulation. Each sample is normalised to the appropriate production cross section and multiplied by the relevant branching ratios (BR), as shown in the third column. ForW±boson and top-quark production, contributions from higher order QCD corrections have been calculated following the references given in the last column. Similarly, forZboson production, higher order QCD corrections have been evaluated in the mass range 66<m`` <116 GeV following the references given in the last column, and extrapolation scaling factors have been applied to match mass ranges used by the different simulations.
The diboson samples include on-shell and off-shellW W,W Z and Z Z production. The inclusive jet and heavy quark cross sections are calculated only at LO. These samples were generated with requirements on the transverse momentum of the partons involved in the hard-scattering process.
vertices. The 4`and 2`+2νprocesses were calculated at NLO for up to one additional parton; final states with two and three additional partons were calculated at LO. The 3`+1νprocess was calculated at NLO and up to three partons at LO using the Comix and OpenLoops matrix element generators and merged with the Sherpa parton shower using the ME+PS@NLO prescription. The CT10 PDF set was used in conjunction with dedicated parton shower tuning developed by the Sherpa authors.
Multijet events were simulated using Pythia v8.186 and EvtGen v1.2.0 in order to include the correct properties of heavy flavor hadron decays. Dedicated samples containingbbandccquark final states were simulated using Pythia v8.186.
To simulate the effects of additional proton-proton collisions in the same and nearby bunch crossings, additional events were generated using the soft QCD processes of Pythia v8.186 using tune A2 [27] and the MSTW2008LO PDFs [28]. All MC samples were reweighted so that thehµidistribution matched the observed distribution in the data. All of the samples were processed with the Geant4-based simulation [29]
of the ATLAS detector [30].
An overview of all signal and background processes considered and of the generators used for the simulation is given in Table1. Total production cross sections, including higher order QCD corrections and their respective uncertainties where available, are also listed in Table1.
4 Event selection
TheZ →`+`−event selection reproduces the one used for theZinclusive measurement [1]. Electron and muon candidate events are selected using triggers that require at least one electron or muon with transverse momentum thresholds of pT > 24 GeV and 20 GeV, respectively, with loose isolation requirements. To recover possible efficiency loss at high momenta, additional electron and muon triggers that do not make any isolation requirements are included with thresholds ofpT > 60 GeV and 50 GeV, respectively.
Candidate events are required to have a primary vertex, defined as the vertex with the highest sum of track p2
T, with at least two associated tracks with pT > 400 MeV.
Electron candidates are reconstructed from an isolated electromagnetic calorimeter energy deposit matched to an inner detector track, and are required to have pT > 25 GeV, to pass a medium likelihood-based identification requirement [31], and to lie within the fiducial region of pseudorapidity |η| < 2.47.
Candidates within the transition region between the barrel and endcap electromagnetic calorimeters, 1.37 < |η| < 1.52, are removed. The likelihood uses measurements of calorimeter shower shapes and measurements of track properties from the inner detector.
Muons are reconstructed in the region |η| < 2.4 from muon spectrometer tracks and matching inner detector tracks. All muons must havepT > 25 GeV and must pass the “medium” identification require- ments, based on requirements on the numbers of hits in the different inner detector and muon spectrometer subsystems, and on the compatibility between inner detector and muon spectrometer momentum meas- urements [32].
Both electrons and muons must satisfy apT-dependent cone-based isolation requirement. The isolation requirement is based on both calorimeter and tracker information, and is tuned so that the lepton isolation efficiency is at least 90% for all electrons and muons withpT > 25 GeV.
Events containing aZ boson candidate are selected by requiring exactly two selected leptons of the same flavour that are oppositely charged. The invariant mass of the dilepton pair has to satisfy the requirement 66<m`` <116 GeV.
Hadronic jets are reconstructed with the anti-kt algorithm [33] with radius parameter R = 0.4 using topological clusters in the calorimeter as input objects. Jets are calibrated using anET- andη-dependent simulation-based calibration scheme, with in-situ corrections based on Run 1 data [34], and checked with early Run 2 data [35]. In order to reduce the effects of pileup contributions, a significant fraction of tracks in each jet are required to have origins compatible with the primary vertex, as defined in the jet vertex tagger [36], and the expected average energy contribution from pileup clusters is subtracted according to the jet area.
Jets are required to have apT greater than 30 GeV, rapidity |y| < 2.5, and to pass the pileup reduction criteria. Jets closer than 0.4 in∆R≡p
(∆φ)2+(∆η)2to a selected lepton are discarded.
The numbers ofZ boson events selected for each inclusive jet multiplicity,≥ Njets with number of jets Njets=1−4, for theZ →eeand theZ → µµchannels, are summarised in Table4in Section8below.
5 Cross-section extraction methodology
The methodology for the measurement of the fiducial cross sections of aZboson produced in association with different inclusive jet multiplicities is similar to the one used for the inclusive Z cross section measurement, with the difference that specific fiducial volumes are defined for each of the studied jet multiplicities.
TheZ →`+`−fiducial volume, with`=e, µ, is defined as:
p`
T> 25 GeV |η`| <2.5 66< m`` <116 GeV (1)
wherem``is the dilepton invariant mass, and electrons and muons are defined as dressed leptons. Dressed leptons are calculated by adding the 4-vectors of all photons in a cone of∆R =0.1 around the lepton to the 4-vector of the final-state (bare) lepton. Photons from hadron decays are not considered2.
Particle-level jets are reconstructed using the anti-ktalgorithm on final-state hadrons and photons, includ- ing their leptonic decay products, and are used to define the fiducial regions. Zboson decay products are not considered as jet inputs. The kinematic particle-level jet selection mimics the selection used at the reconstructed level: particle-level jets are required to have apT >30 GeV and|y| < 2.5. Jets closer than 0.4 in∆Rto a selected lepton are removed.
The measured cross section in the fiducial phase space defined above for each inclusive jet multiplicity is given by the following formula:
σfidZ→`+`−+≥Njets ≡ A·σZ→`+`−+≥Njets ·BR(Z →`+`−)≡ NZsig
→`+`−+≥Njets
CZ→`+`−+≥Njets · L, (2) whereAdenotes the acceptance in the fiducial volume and the factors in the rightmost equation are defined as follows:
• NZsig
→`+`−+≥Njets denotes the total number of selected and background-subtracted data events for the Z →eeandZ → µµchannels with different jet multiplicities:
NZsig→`+`−+≥
Njets =NZobs→`+`−+≥Njets−NZbkg→`+`−+≥
Njets; (3)
where the total number of observed events,NZobs
→`+`−+≥Njets, and the predicted number of background events,NZbkg→`+`−+≥
Njets, are defined after the selection described in Section4.
• L denotes the integrated luminosity of the dataset used, which amounts to 85 pb−1 with 9%
uncertainty.
• CZ→`+`−+≥Njetsdenotes, for each jet multiplicity, the ratios between the total number of generated events which pass the final selection requirements after reconstruction and the total number of generated events within the fiducial acceptance. These correction factors account for the efficiencies for triggering, reconstructing3, and identifying theZboson leptonic decays falling within the fiducial acceptance, as well as the jet reconstruction and selection efficiencies, together with bin-by-bin jet multiplicity migrations with respect to the particle-level jets used in the definition of the fiducial regions.
6 Background estimation and kinematic distributions
The contribution from background processes present in the selected sample are estimated using MC simulation, as detailed in Section3.
2The difference between cross sections calculated at the Born level and at dressed level has been evaluated using Powheg-Box v2 plus Pythia v8.186 simulation, and amounts to approximately 1% per lepton in agreement with previous results [2].
3The small difference between the fiducial phase space and the phase space selected for lepton reconstruction is included in the correction factors.
Top-quark pair production is the dominant background for higher jet multiplicities: around 1% in the Z → `+`−+ ≥ 1 jet sample and rising from 5% up to 10% going from Z → `+`−+ ≥ 2 jets to Z →`+`−+ ≥ 4 jets event selections. Reasonable modelling of additional parton radiation intt events by the Powheg generator with Pythia 6 showering was observed at 13 TeV with a similar dataset [37].
Minor background contributions arise from diboson and single-boson production decaying to leptonic final states. The multijet background is negligible in the Z → µ+µ−channels and at most at the percent level in theZ→e+e−channels.
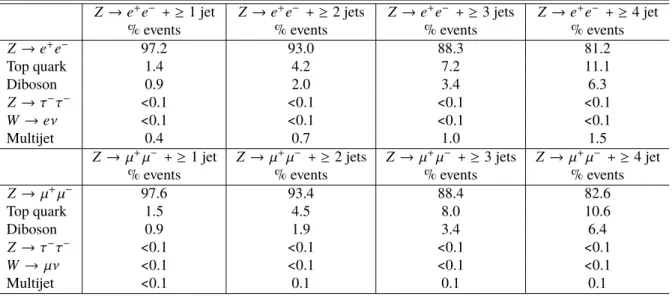
Table2 details the expected fractions of signal and background events in the various categories of jet multiplicities for both theZ →e+e−andZ → µ+µ−selections.
Z →e+e− +≥1 jet Z →e+e− +≥2 jets Z →e+e− +≥3 jets Z →e+e− +≥4 jet
% events % events % events % events
Z →e+e− 97.2 93.0 88.3 81.2
Top quark 1.4 4.2 7.2 11.1
Diboson 0.9 2.0 3.4 6.3
Z →τ−τ− <0.1 <0.1 <0.1 <0.1
W →eν <0.1 <0.1 <0.1 <0.1
Multijet 0.4 0.7 1.0 1.5
Z →µ+µ− +≥1 jet Z → µ+µ− +≥2 jets Z →µ+µ− +≥3 jets Z →µ+µ− +≥4 jet
% events % events % events % events
Z →µ+µ− 97.6 93.4 88.4 82.6
Top quark 1.5 4.5 8.0 10.6
Diboson 0.9 1.9 3.4 6.4
Z →τ−τ− <0.1 <0.1 <0.1 <0.1
W → µν <0.1 <0.1 <0.1 <0.1
Multijet <0.1 0.1 0.1 0.1
Table 2: Expected fractions of signal and background events for the various jet multiplicities considered. Expectations are expressed as a percentage of the total number of signal and background events in simulation passing the signal selection in each jet bin.
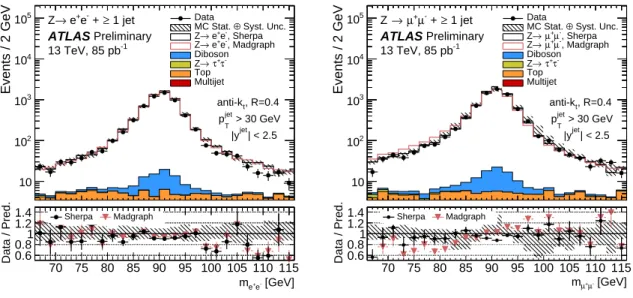
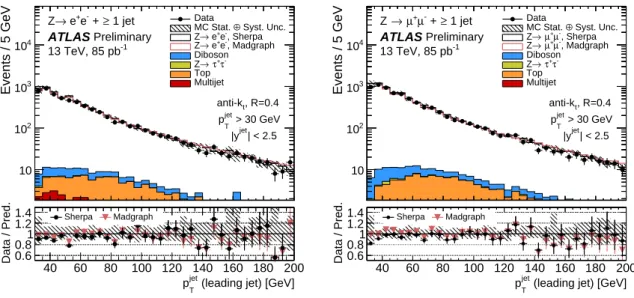
The agreement between data and predictions can be evaluated from the comparison of several kinematic distributions, with a special focus on Z+jets related quantities. Inclusive Z boson and lepton-specific distributions have been discussed elsewhere [1]. Figures1to4show the dilepton mass, the inclusive jet multiplicity and the transverse momentum and rapidity of the leading jet for events withZ →e+e−and Z →µ+µ−decays, compared to both the MadGraph and Sherpa simulation predictions.
The uncertainty bands shown in these distributions are described in Section7and include the following components: jet energy scale and resolution, lepton energy and momentum scale and resolution, lepton identification and trigger efficiency, pileup-reweighting and statistical uncertainty due to limited MC sample size. The 5% theoretical uncertainty on the signal cross section and the 9% luminosity uncertainty are not included in the uncertainty bands.
Both the MadGraph and the Sherpa simulation predictions show a reasonable agreement with the data.
In the muon channel, a trend is observed towards a lower jet multiplicity in data, but it is not significant.
Whereas Sherpa predicts a dilepton mass distribution that is consistent with the data, the MadGraph prediction agrees less well. However, the predictions of the two generators agree at the level of dressed leptons from the generators.
[GeV]
e- e+
m
70 75 80 85 90 95 100 105 110 115
Events / 2 GeV
10 102
103
104
105 Z→ e+e- + ≥ 1 jet 13 TeV, 85 pb-1
Preliminary
, R=0.4 anti-kt
> 30 GeV
jet
pT
| < 2.5
|yjet
ATLAS
Data
Syst. Unc.
⊕ MC Stat.
, Sherpa e-
e+
→ Z
, Madgraph e-
e+
→ Z Diboson
τ-
τ+
→ Z Top Multijet
[GeV]
e-
e+
m
70 75 80 85 90 95 100 105 110 115 Data / Pred.0.60.811.21.4 Sherpa Madgraph
[GeV]
µ- µ+
m
70 75 80 85 90 95 100 105 110 115
Events / 2 GeV
10 102
103
104
105 Z →µ+µ- + ≥ 1 jet 13 TeV, 85 pb-1
Preliminary
, R=0.4 anti-kt
> 30 GeV
jet
pT
| < 2.5
|yjet
ATLAS
Data
Syst. Unc.
⊕ MC Stat.
, Sherpa µ-
µ+
→ Z
, Madgraph µ-
µ+
→ Z Diboson
τ-
τ+
→ Z Top Multijet
[GeV]
µ-
µ+
m 70 75 80 85 90 95 100 105 110 115 Data / Pred.0.60.811.21.4 Sherpa Madgraph
Figure 1: Dilepton invariant mass forZ +≥ 1 jet events in theZ → e+e−+jets (left) and the Z → µ+µ−+jets selection (right) channels. Systematic uncertainties for the signal and background distributions are combined in the shaded band, and the statistical uncertainty is shown on the data points. Luminosity and theoretical uncertainties are not included.
Njets
0 1 2 3 4 5
Events
102
103
104
105
106 Z→ e+e- + jets 13 TeV, 85 pb-1
Preliminary
, R=0.4 anti-kt
> 30 GeV
jet
pT
| < 2.5
|yjet
ATLAS
Data
Syst. Unc.
⊕ MC Stat.
, Sherpa e-
e+
→ Z
, Madgraph e-
e+
→ Z Diboson
τ-
τ+
→ Z Top Multijet
Njets
≥ 0 ≥ 1 ≥ 2 ≥ 3 ≥ 4 ≥ 5 Data / Pred.0.60.811.21.4 Sherpa Madgraph
Njets
0 1 2 3 4 5
Events
102
103
104
105
106 Z →µ+µ- + jets 13 TeV, 85 pb-1
Preliminary
, R=0.4 anti-kt
> 30 GeV
jet
pT
| < 2.5
|yjet
ATLAS
Data
Syst. Unc.
⊕ MC Stat.
, Sherpa µ-
µ+
→ Z
, Madgraph µ-
µ+
→ Z Diboson
τ-
τ+
→ Z Top Multijet
Njets
≥ 0 ≥ 1 ≥ 2 ≥ 3 ≥ 4 ≥ 5 Data / Pred.0.60.811.21.4 Sherpa Madgraph
Figure 2: Inclusive jet multilplicity in the Z → e+e−+jets selection (left) and the Z → µ+µ−+jets selection (right). Systematic uncertainties for the signal and background distributions are combined in the shaded band, and the statistical uncertainty is shown on the data points. Luminosity and theoretical uncertainties are not included.
(leading jet) [GeV]
jet
pT
40 60 80 100 120 140 160 180 200
Events / 5 GeV
10 102
103
104
1 jet
≥
- +
+e
→ e Z
13 TeV, 85 pb-1
Preliminary
, R=0.4 anti-kt
> 30 GeV
jet
pT
| < 2.5
|yjet
ATLAS
Data
Syst. Unc.
⊕ MC Stat.
, Sherpa e-
e+
→
Z→ e+e-, Madgraph Z
Diboson τ-
τ+
→ Z Top Multijet
(leading jet) [GeV]
jet
pT
40 60 80 100 120 140 160 180 200 Data / Pred.0.60.811.21.4 Sherpa Madgraph
(leading jet) [GeV]
jet
pT
40 60 80 100 120 140 160 180 200
Events / 5 GeV
10 102
103
104
1 jet
≥
- + µ µ+
→ Z
13 TeV, 85 pb-1
Preliminary
, R=0.4 anti-kt
> 30 GeV
jet
pT
| < 2.5
|yjet
ATLAS
Data
Syst. Unc.
⊕ MC Stat.
, Sherpa µ-
µ+
→
Z→µ+µ-, Madgraph Z
Diboson τ-
τ+
→ Z Top Multijet
(leading jet) [GeV]
jet
pT
40 60 80 100 120 140 160 180 200 Data / Pred.0.60.811.21.4 Sherpa Madgraph
Figure 3: Transverse momentum of the highest-pT jet in each event in the Z → e+e−+jets selection (left) and the Z → µ+µ−+jets selection (right). Systematic uncertainties for the signal and background distributions are combined in the shaded band, and the statistical uncertainty is shown on the data points. Luminosity and theoretical uncertainties are not included.
(leading jet) yjet
-2 -1 0 1 2
Events / 0.2
10 102
103
104
105 Z→ e+e- + ≥ 1 jet 13 TeV, 85 pb-1
Preliminary ATLAS
Data
Syst. Unc.
⊕ MC Stat.
, Sherpa e-
e+
→ Z
, Madgraph e-
e+
→ Z Diboson
τ-
τ+
→ Z Top Multijet
(leading jet) yjet
-2 -1 0 1 2
Data / Pred.0.60.811.21.4 Sherpa Madgraph
(leading jet) yjet
-2 -1 0 1 2
Events / 0.2
10 102
103
104
105 Z →µ+µ- + ≥ 1 jet 13 TeV, 85 pb-1
Preliminary ATLAS
Data
Syst. Unc.
⊕ MC Stat.
, Sherpa µ-
µ+
→ Z
, Madgraph µ-
µ+
→ Z Diboson
τ-
τ+
→ Z Top Multijet
(leading jet) yjet
-2 -1 0 1 2
Data / Pred.0.60.811.21.4 Sherpa Madgraph
Figure 4: Rapidity of the highest-pTjet in each event in theZ →e+e−+jets selection (left) and theZ→ µ+µ−+jets selection (right). Systematic uncertainties for the signal and background distributions are combined in the shaded band, and the statistical uncertainty is shown on the data points. Luminosity and theoretical uncertainties are not included.
7 Particle-level corrections and systematic uncertainties
The central values of theCZ→`+`−+≥Njetscorrection factors are computed using a combination of simulation and corrections based on data. Several important components such as jet-energy calibration, lepton reconstruction, identification, and trigger efficiencies feed into the evaluation ofCZ→`+`−+≥Njetsand their systematic uncertainties. These efficiencies have been measured with MC samples and corrected using data-driven scale factors to take into account differences between data and simulation.
The values forCZ→`+`−+≥Njets, calculated with Sherpa, are presented in Table4. The correction factors for lower jet multiplicities are larger than the correction factors calculated for the inclusiveZboson events in Ref. [1], after correcting for dressed leptons, since they also account for reconstructed jets without a matched particle-level jet in the kinematic window.
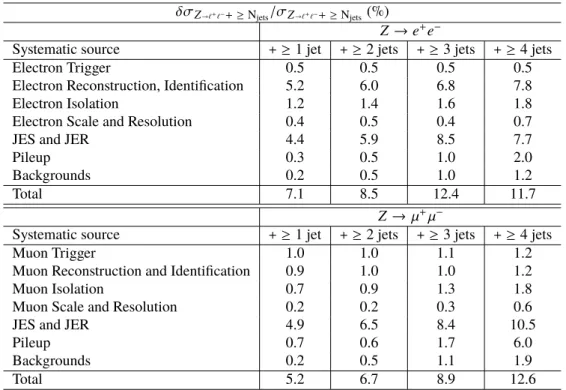
The contributions to the systematic uncertainties are described below. They are propagated to the final cross section by varying the subtracted backgrounds, maintaining the correlation with the corresponding uncertainties on theCZ→`+`−+≥Njetsvalues. Table 3 summarises the relative uncertainties on the cross section measurements. Uncertainties specific to each leptonic final state (Z →eeandZ →µµ) are:
• Trigger: Dedicated data-driven analyses are performed to obtain the trigger scale factors and the corresponding uncertainty from the data.
• Lepton Identification and Reconstruction: The efficiency obtained from the simulation of the electron offline selection (reconstruction, application of the medium likelihood working point, and isolation) is corrected with data, using specific scale factors with associated statistical and systematic uncertainties applied to simulation. The dominant uncertainty is associated with the electron identification. Similarly, for the muon channel, the efficiencies of the muon offline selection (reconstruction/identification and isolation) are corrected with data-driven scale factors.
• Lepton Energy Scale and Resolution: The uncertainties on the calibration of the electron energy and of the muon momentum cause a small change of acceptance due to a migration of events below and above thepTthreshold and across them``selection boundaries. This yields a small uncertainty on the measurement.
Uncertainties common to the electron and muon final state are as follows:
• Jet Energy Scale and Resolution: Uncertainties on jet energy scale calibration and resolution have a significant impact on the total correction factor uncertainties, especially for the higher jet multiplicities. The jet energy scale is varied in simulation according to the uncertainties derived from the
√s = 8 TeV simulation and in-situ calibration, and the uncertainties are extrapolated to
√s=13 TeV [35]. The uncertainties are evaluated using a decorrelation scheme, resulting in a set of 19 independent nuisance parameters which cover all the relevant calibration uncertainties. The jet energy resolution uncertainty is assessed using
√s=8 TeV data, and extrapolated to
√s =13 TeV.
• Pileup: The imperfect modelling of the underlying event and pile-up effects leads to acceptance changes at the percent level for different jet multiplicities. In order to assess this uncertainty the average number of interactions per bunch crossing is varied in simulation by 16% with respect to the nominal value.
δσZ→`+`−+≥Njets/σZ→`+`−+≥Njets(%)
Z →e+e−
Systematic source +≥1 jet +≥2 jets +≥3 jets +≥4 jets
Electron Trigger 0.5 0.5 0.5 0.5
Electron Reconstruction, Identification 5.2 6.0 6.8 7.8
Electron Isolation 1.2 1.4 1.6 1.8
Electron Scale and Resolution 0.4 0.5 0.4 0.7
JES and JER 4.4 5.9 8.5 7.7
Pileup 0.3 0.5 1.0 2.0
Backgrounds 0.2 0.5 1.0 1.2
Total 7.1 8.5 12.4 11.7
Z → µ+µ−
Systematic source +≥1 jet +≥2 jets +≥3 jets +≥4 jets
Muon Trigger 1.0 1.0 1.1 1.2
Muon Reconstruction and Identification 0.9 1.0 1.0 1.2
Muon Isolation 0.7 0.9 1.3 1.8
Muon Scale and Resolution 0.2 0.2 0.3 0.6
JES and JER 4.9 6.5 8.4 10.5
Pileup 0.7 0.6 1.7 6.0
Backgrounds 0.2 0.5 1.1 1.9
Total 5.2 6.7 8.9 12.6
Table 3: Relative systematic uncertainties on the final cross sections forZ →`+`−+jets production measurements in different bins of inclusive jet multiplicity.
• Jet vertex tagger: The modelling of the output of the jet vertex tagger for jets from the primary interaction has been checked using events where the Z boson recoils againts a jet. Since the distribution of the discriminant is described using the simulation within the uncertainties, no additional uncertainty on the jet vertex tagger efficiency is applied.
• MC modelling: The impact of LO vs. NLO matrix elements, parton shower, hadronisation and FSR modelling is assessed by comparing the nominal measured cross sections, derived using correction factors calculated with Sherpa with the cross sections calculated using MadGraph to derive the correction factors. The difference is found to be negligible. No additional uncertainty is applied.
8 Results
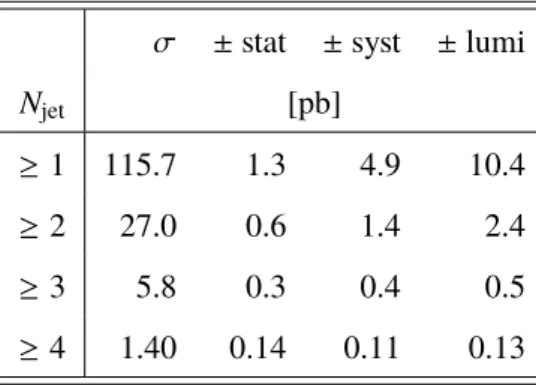
All quantities relevant for the cross section measurement in the the Z → ee and Z → µµ channels are reported in Table4, which lists the data yields, background expectations, and the correction factors.
Systematic uncertainties on the detector simulation are evaluated as described in Section7. They are propagated to the observed cross-section uncertainty via theCZ→`+`−+≥Njetscorrection factors and via the variation on background subtraction, in a correlated way. The uncertainty of 9% on the luminosity measurement enters in a similar way. The fiducial cross section for the differentZ+jets multiplicities is then derived using Equation2and the results are again reported in Table4.
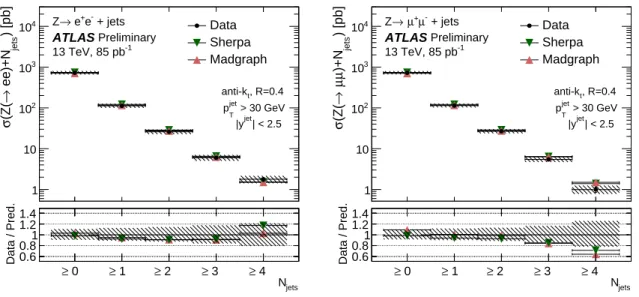
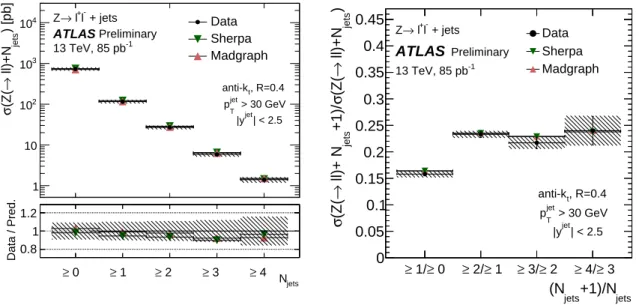
Figures5and6compare the measured fiducial cross sections for the various jet multiplicities and their ratios for successive jet multiplicities with the predictions from Sherpa and from MadGraph MC simulation.
Z

