ATLAS-CONF-2012-112 14August2012
ATLAS NOTE
ATLAS-CONF-2012-112
August 10, 2012
Search for Supersymmetry in Events with Large Missing Transverse Momentum, Jets, and at Least One Tau Lepton in 7 TeV Proton-Proton
Collision Data with the ATLAS Detector
The ATLAS Collaboration
Abstract
A search for Supersymmetry (SUSY) in events with large missing transverse momen- tum, jets, and at least one hadronically decaying τ lepton, with zero or one additional light lepton (e/µ), has been performed using 4.7 fb−1 of proton-proton collision data at
√s = 7 TeV recorded with the ATLAS detector at the Large Hadron Collider. No excess above the Standard Model background expectation is observed and a 95 % Confidence Level (CL) visible cross section upper limit for new phenomena is set. In the framework of gauge- mediated SUSY breaking models (GMSB), exclusion limits on the GMSB breaking scale Λ are set at 47 TeV, independently of tanβ. These limits provide the most stringent tests to date of GMSB SUSY breaking models in a large part of the parameter space considered, improving previous best limits from ATLASτanalyses.
c Copyright 2012 CERN for the benefit of the ATLAS Collaboration.
Reproduction of this article or parts of it is allowed as specified in the CC-BY-3.0 license.
1 Introduction
This note reports on the search for supersymmetry (SUSY) [1–9] in events with large missing transverse momentum, jets and at least one hadronically decayingτ lepton. Four different topologies with aτin the final state have been studied: with oneτ, with at least two taus, and with oneτand precisely one additionalµor electron. The analysis has been performed using 4.7 fb−1of proton-proton (pp) collision data at √s=7 TeV recorded with the ATLAS detector at the Large Hadron Collider (LHC) in the 2011 run. The results are interpreted in the context of a minimal gauge-mediated supersymmetry breaking (GMSB) model [10–15].
SUSY introduces a symmetry between fermions and bosons, resulting in a SUSY partner (sparticle) for each Standard Model (SM) particle with identical mass and quantum numbers except a difference by half a unit of spin. As none of these sparticles have been observed with the same masses as their SM partners, SUSY must be a broken symmetry if realised in nature. AssumingR-parity conservation [16–
20], sparticles are produced in pairs. These would then decay through cascades involving other sparticles until the lightest SUSY particle (LSP), which is stable, is produced.
Minimal GMSB models can be described by six parameters: the SUSY breaking mass scale felt by the low-energy sector (Λ), the messenger mass (Mmess), the number of SU(5) messenger fields (N5), the ratio of the vacuum expectation values of the two Higgs doublets (tanβ), the Higgs sector mixing parameter (µ) and the scale factor for the gravitino mass (Cgrav). For the analysis presented in this note, Λand tanβare treated as free parameters, and the other parameters are fixed to the values already used in Refs. [21, 22]: Mmess = 250 TeV,N5 =3,µ >0 andCgrav =1. With this choice of parameters, the production of squark and/or gluino pairs is expected to dominate at the LHC; these sparticles will decay into the next-to-lightest SUSY particle (NLSP), which subsequently decays to the LSP. In GMSB models, the LSP is the very light gravitino ( ˜G). Due to the very small LSP mass ofO(keV), the NLSP is the only sparticle decaying to the LSP and this leads to experimental signatures which are largely determined by the nature of the NLSP. This can be either the lightest stau (˜τ1), a right handed slepton (˜`R), the lightest neutralino ( ˜χ01), or a sneutrino (˜ν), dominantly leading to final states containingτleptons, light leptons (` = e, µ), photons, b-jets, or neutrinos. At large values of tanβ, the ˜τ1is the NLSP for most of the parameter space, which leads to final states containing between two and fourτleptons. In the so-called CoNLSP region, where the mass difference between the ˜τ1 and the ˜`R is smaller than the sum of the τand light lepton masses, both the ˜τ1and the ˜`Rdecay directly into the LSP and are therefore NLSP.
Previous searches of ˜τ1 pair production, with the subsequent decay ˜τ1 → τG˜ in the minimal GMSB model, had been reported by the LEP Collaborations ALEPH [23], DELPHI [24] and OPAL [25]. The analysis reported in this note extends the searches presented in Refs. [21, 22] and comprises the full 2011 dataset, corresponding to an integrated luminosity of (4.7±0.1) fb−1[26, 27] after applying beam, detector and data-quality requirements. The CMS Collaboration searched for new physics in same-sign di-tau events [28] and multi-lepton events including two taus in the final state [29] using 35 pb−1of data, but the minimal GMSB model was not considered.
2 ATLAS detector
The ATLAS experiment is described in detail elsewhere [30]. It is a multi-purpose detector with a forward-backward symmetric cylindrical geometry and nearly 4πsolid angle coverage. The inner track- ing detector (ID) consists of a silicon pixel detector, a silicon strip detector and a transition radia- tion tracker. The ID is surrounded by a thin superconducting solenoid providing a 2 T magnetic field and by fine-granularity lead/liquid-argon (LAr) electromagnetic calorimeters. An iron/scintillating-tile
calorimeter provides hadronic coverage in the central rapidity1range. The endcap and forward regions are instrumented with liquid-argon calorimeters for both electromagnetic and hadronic measurements.
An extensive muon spectrometer system that incorporates large superconducting toroidal magnets sur- rounds the calorimeters.
3 Simulated samples
The Monte Carlo (MC) simulations used to evaluate the expected backgrounds and selection efficiencies for the SUSY models considered are very similar to the ones used in Refs. [21,22]. A suite of generators is used to aid in the estimate of SM background contributions. The ALPGEN generator [31] is used to simulate samples of W and Z/γ∗ events with up to five accompanying jets, where CTEQ6L1[32]
is used for the parton density functions (PDFs). Z/γ∗ events withmll <40 GeV will be referred to in this note as ”Drell-Yan”. Top quark pair production, single top production and di-boson (WW and WZ) pair production are simulated withMC@NLO[33–35] and the next-to-leading order (NLO) PDF set CT10 [36]. Fragmentation and hadronisation are performed with HERWIG [37], usingJIMMY [38] for the underlying event simulation. The decay ofτleptons and radiation of photons are simulated using TAUOLA [39, 40] and PHOTOS [41], respectively. The production of multi-jet events is simulated with PYTHIA6.4.25 [42] using the AUET2B tune [43] andMRST2007 LO∗[44] PDFs. For the minimal GMSB model considered in this analysis, the SUSY mass spectra are calculated usingISAJET7.80 [45]. The MC signal samples are produced usingHERWIG++2.4.2 [46] withMRST2007 LO∗ PDFs. Signal cross sections are calculated to next-to-leading order in the strong coupling constant, adding the resummation of soft gluon emission at next-to-leading-logarithmic accuracy (NLO+NLL) [47–51]. The nominal cross section and the uncertainty are taken from an envelope of cross section predictions using different PDF sets and factorisation and renormalisation scales, as described in Ref. [52]. GMSB signal samples were generated on a grid ranging fromΛ =10 TeV toΛ =80 TeV and from tanβ=2 to tanβ=67, with the cross section dropping from 100 pb forΛ =15 TeV to 5.0 fb forΛ =80 TeV.
All samples are processed through the Geant4-based simulation [53] of the ATLAS detector [54].
The full simulation includes also a realistic treatment of the variation of the number of ppinteractions per bunch crossing (pile-up) in the data, with an average of∼9 interactions per crossing.
4 Object reconstruction
Jets are reconstructed using the anti-kt jet clustering algorithm [55] with radius parameterR = 0.4.
Jet energies are calibrated to correct for upstream material, calorimeter non-compensation, pile-up, and other effects [56]. Jets are required to have transverse momenta (pT) greater than 25 GeV and|η|<2.8, other than in the computation of the missing transverse momentum, where|η|<4.5 andpTgreater than 20 GeV is required.
Muon candidates are identified as tracks in the ID matched to track segments in the muon spectrome- ter [57]. They are required to havepT>10 GeV and|η|<2.4. Electron candidates are required to satisfy pT>20 GeV,|η|<2.47 and to pass the “tight” identification criteria described in Ref. [58], re-optimised for 2011 conditions.
Electrons or muons are required to be isolated, i.e. the scalar sum of the transverse momenta of tracks within a cone∆R = p
(∆φ)2+(∆η)2 <0.2 around the lepton candidate, excluding the lepton candidate track itself, is less than 10% of the transverse energy for electrons and less than 1.8 GeV for
1ATLAS uses a right-handed coordinate system with its origin at the nominal interaction point (IP) in the centre of the detector and thez-axis along the beam pipe. Thex-axis points from the IP to the centre of the LHC ring and they-axis points upward. Cylindrical coordinates (R, φ) are used in the transverse plane,φbeing the azimuthal angle around the beam pipe. The pseudorapidity is defined in terms of the polar angleθasη=−ln tan(θ/2).
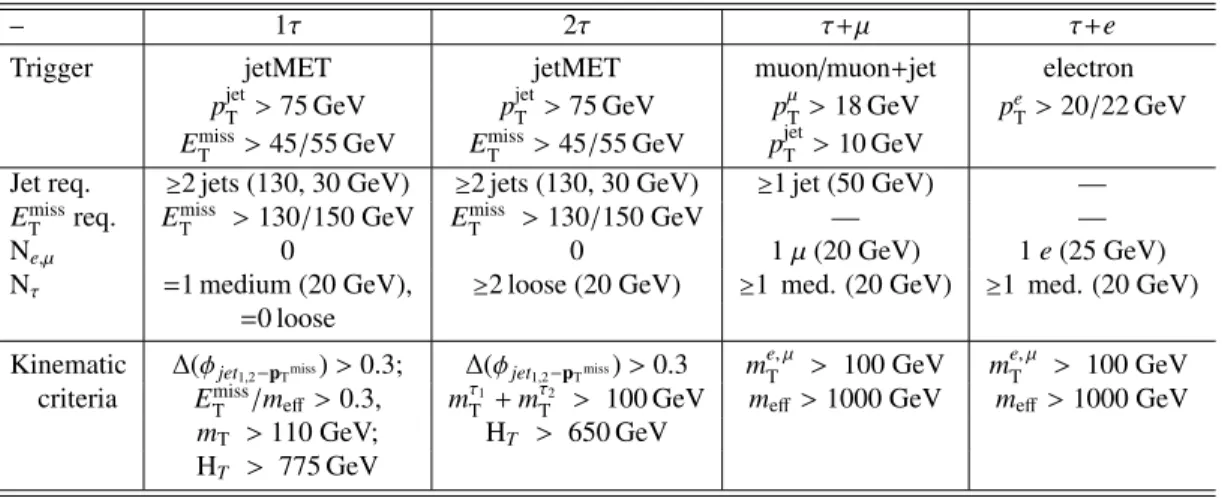
Table 1: Event selection for the four final states presented in this note. Numbers in parentheses are the minimal transverse momenta required for the objects. Pairs of numbers separated by a slash denote different selection criteria imposed in different data-taking periods.
– 1τ 2τ τ+µ τ+e
Trigger jetMET jetMET muon/muon+jet electron
pjetT >75 GeV pjetT >75 GeV pµT>18 GeV peT>20/22 GeV EmissT >45/55 GeV ETmiss>45/55 GeV pjetT >10 GeV
Jet req. ≥2 jets (130, 30 GeV) ≥2 jets (130, 30 GeV) ≥1 jet (50 GeV) — EmissT req. ETmiss >130/150 GeV EmissT >130/150 GeV — —
Ne,µ 0 0 1µ(20 GeV) 1e(25 GeV)
Nτ =1 medium (20 GeV), ≥2 loose (20 GeV) ≥1 med. (20 GeV) ≥1 med. (20 GeV)
=0 loose
Kinematic ∆(φjet1,2−pTmiss)>0.3; ∆(φjet1,2−pTmiss)>0.3 me, µT > 100 GeV me, µT > 100 GeV criteria EmissT /meff>0.3, mτT1+mτT2 > 100 GeV meff>1000 GeV meff>1000 GeV
mT >110 GeV; HT > 650 GeV HT > 775 GeV
muons. Tracks selected for the electron and muon isolation requirement defined above havepT >1 GeV and are associated to the primary vertex of the event.
The missing transverse momentum vector pTmiss (and its magnitude ETmiss) is measured from the transverse momenta of identified jets, electrons, muons and all calorimeter clusters with|η| < 4.5 not associated to such objects [59]. For the purpose of the measurement ofEmissT ,τleptons are not distin- guished from jets.
Jets originating from decays ofb-quarks are identified and used for separating theWand t¯t back- ground contributions. They are identified by a neural network based algorithm, which combines the information from the track impact parameters with the search for decay vertices along the jet axis [60].
A working point corresponding to 60 % (<1 %) tagging efficiency forb-jets (light flavour or gluon jets) is chosen [61].
Tau leptons considered in this search are reconstructed through their hadronic decays. Theτrecon- struction is seeded from anti-kt jets with pT > 10 GeV. Anη- and pT-dependent energy calibration to the hadronicτenergy scale is applied. Discriminating variables based on tracking and observables sen- sitive to the transverse and longitudinal shape of the energy deposits of tau candidates in the calorimeter are used. These quantities are combined in a boosted decision tree (BDT) discriminator [62] to optimize their impact. Measurements of transition radiation and calorimeter information are used to veto electrons mis-identified as taus. Suitableτlepton candidates must satisfy pT > 20 GeV,|η| <2.5, and have one or three associated tracks ofpT>1 GeV with a charge sum of±1. A sample ofZ→ττevents is used to measure the efficiency of the BDT tau identification. The “loose” and “medium” working points in Ref. [62] are used herein and correspond to efficiencies of about 60 % and 40 % respectively, independent ofpT, with a rejection factor of 20−50 againstτcandidates built from hadronic jets (“fake” taus).
5 Event Selection
Four mutually exclusive final states are considered for this search: events with only one hadronically decaying “medium”τ and no additional “loose” τcandidates, referred to as ’1τ’; events with two or more “loose” taus, referred as ’2τ’; events with at least one “medium”τand exactly one muon (electron), referred to as ’τ+µ’ (’τ+e’).
Table 2: Definition of the background control regions (CRs) used to estimate the yield of background candidates in the four final states: 1τ, 2τ,τ+µandτ+e.
Background 1τ 2τ τ+µ τ+e
tt¯ ∆(φjet1,2−pTmiss)>0.3 rad ∆(φjet1,2−pTmiss)>0.3 rad 30 GeV<EmissT <100 GeV mT<70 GeV mτT1+mτT2 ≥ 100 GeV 50 GeV<me, µT <150 GeV EmissT /meff>0.3 HT<550 GeV Nb−tag≥ 1 b-tag template fit Nb−tag≥ 1
W+jets ∆(φjet1,2−pTmiss)>0.3 rad ∆(φjet1,2−pTmiss)>0.3 rad 30 GeV<EmissT <100 GeV mT<70 GeV mτT1+mτT2 ≥ 100 GeV 50 GeV<me, µT <150 GeV EmissT /meff>0.3 HT<550 GeV Nb−tag=0
Nb−tag=0 Z+jets 2µ(20 GeV),|η| < 2.4 ∆(φjet1,2−pTmiss)> 0.3 rad
≥2 jets (130, 30 GeV) mτT1+mτT2 <80 GeV MC simulation Nb−tag=0 HT<550 GeV
Multi-jet ∆(φjet1,2−pTmiss)<0.3 rad ∆(φjet1,2−pTmiss)< 0.3 rad compare events with and without ETmiss/meff< 0.3 EmissT /meff< 0.4 lepton isolation [63]
In the 1τand 2τfinal states, candidate events are triggered by requiring a jet with high transverse momentum and highETmiss(‘jetMET’) [64], both measured at the electromagnetic scale2. In theτ+µfinal state, events are selected by a muon trigger and a muon plus jet trigger (’muon+jet’), while in theτ+e final state, a single electron trigger requirement is imposed [64]. They have been optimized to ensure a uniform trigger efficiency for all data-taking periods, which exceeds 98 % for all final states considered with respect to the offline criteria.
Pre-selected events are required to have a reconstructed primary vertex with at least five tracks (with pT >0.4 GeV), and are then required to go through further selection. To suppress soft multi-jet events in the 1τand 2τfinal states, a second jet with pT > 30 GeV is required. Remaining multi-jet events, where highly energetic jets are mis-measured, are rejected by requiring the azimuthal angle between the missing transverse momentum vector and either of the two leading jets to be greater than 0.3 rad.
Three quantities characterising the kinematic properties of the event are used to further suppress the main background processes (W+jets,Z+jets andtt¯events) in all four final states:
• the transverse massmτ,lT formed byETmissand either thepTof theτlepton in the 1τand 2τchannels, or of the light lepton (e/µ) in theτ+µandτ+eones:
mτ,lT =
q2pτ,lTEmissT (1−cos(∆φ(τ/l,EmissT ))) ;
• the scalar sumHTof the transverse momenta ofτlepton candidates and the two highest momentum jets in the events:HT=PpτT+P
i=1,2pjetTi;
• the effective massmeff=HT+ETmiss.
For each of the four final states, specific criteria are applied to the above quantities in order to define a signal region (SR), as summarized in Table 1.
2The electromagnetic scale is the basic calorimeter signal scale for the ATLAS calorimeters. It has been established using test-beam measurements for electrons and muons to give the correct response for the energy deposited in electromagnetic showers, although it does not correct for the lower response of the calorimeter to hadrons.
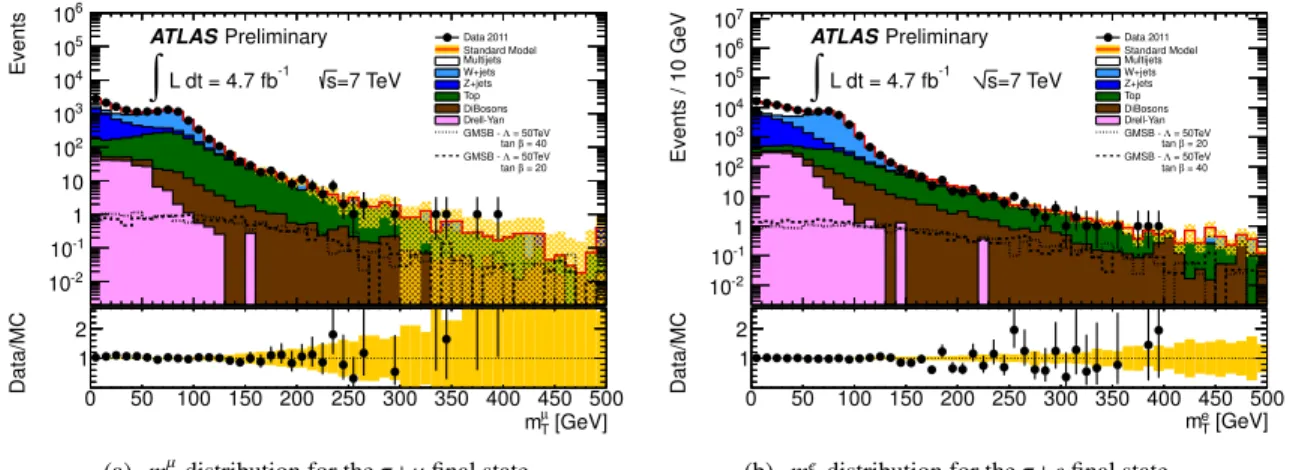
Fig. 1 shows themTandmτT1+mτT2distributions for the 1τand 2τchannels after all the requirements of the analysis except the final requirement onHT. Similarly, Fig. 2 shows theme, µT distributions for the τ+µandτ+echannels after all the requirements of the analysis except the finalmeffrequirement.
[GeV]
mT
0 50 100 150 200 250 300 350 400 450 500
Events / 10 GeV
10-1
1 10 102
103
104
105
ATLAS Preliminary = 7 TeV s
-1 L dt = 4.7 fb
∫
Data 2011 Standard Model Multijets W+jets Z+jets Top DiBosons Drell-Yan
= 50 TeV Λ GMSB -
= 40 β tan
= 50 TeV Λ GMSB -
= 20 β tan
[GeV]
mT
0 50 100 150 200 250 300 350 400 450 500
Data/MC 0
1 2
(a) mTdistribution for the 1τfinal state.
0 50 100 150 200 250 300 350 400 450 500
Events / 20 GeV
10-2
10-1
1 10 102
103
ATLASPreliminary
=7 TeV s L dt = 4.7 fb-1
∫
Data 2011 Standard Model Multijets W+jets Z+jets Top DiBosons Drell-Yan
= 50TeV Λ GMSB -
= 40 β tan
= 50TeV Λ GMSB -
= 20 β tan
[GeV]
τ2
+ mT τ1
mT
0 50 100 150 200 250 300 350 400 450 500
Data/MC
1 2
(b) mτT1+mτT2distribution for the 2τfinal state.
Figure 1: Distribution ofmT(a) andmτT1 +mτT2 (b) for the 1τand 2τfinal states, respectively, after all analysis requirements but the final requirement onHT. Data are represented by the points, with statistical uncertainty only. The SM prediction includes the data driven corrections discussed in the text. The band centred around the total SM background indicates the statistical uncertainty on the estimated background expectation. Also shown is the expected signal from two typical GMSB samples (Λ = 50 TeV,tanβ= 40,Λ =50 TeV,tanβ=20).
0 50 100 150 200 250 300 350 400 450 500
Events
10-2
10-1
1 10 102
103
104
105
106
ATLASPreliminary
=7 TeV s L dt = 4.7 fb-1
∫
Data 2011 Standard Model Multijets W+jets Z+jets Top DiBosons Drell-Yan
= 50TeV Λ GMSB -
= 40 β tan
= 50TeV Λ GMSB -
= 20 β tan
[GeV]
µ
mT
0 50 100 150 200 250 300 350 400 450 500
Data/MC
1 2
(a) mµTdistribution for theτ+µfinal state.
0 50 100 150 200 250 300 350 400 450 500
Events / 10 GeV
10-2
10-1
1 10 102
103
104
105
106
107
ATLASPreliminary
=7 TeV s L dt = 4.7 fb-1
∫
Data 2011 Standard Model Multijets W+jets Z+jets Top DiBosons Drell-Yan
= 50TeV Λ GMSB -
= 20 β tan
= 50TeV Λ GMSB -
= 40 β tan
[GeV]
eT
m 0 50 100 150 200 250 300 350 400 450 500
Data/MC
1 2
(b) meTdistribution for theτ+efinal state.
Figure 2: Distribution ofme, µT for theτ+µ (a) andτ+e(b) final states after all analysis requirements but the final requirement onmeff. Data are represented by the points, with statistical uncertainty only.
The SM prediction includes the data driven corrections discussed in the text. The band centred around the total SM background indicates the statistical uncertainty on the estimated background expectation.
Also shown is the expected signal from two typical GMSB samples (Λ = 50 TeV,tanβ = 40, Λ = 50 TeV,tanβ=20).
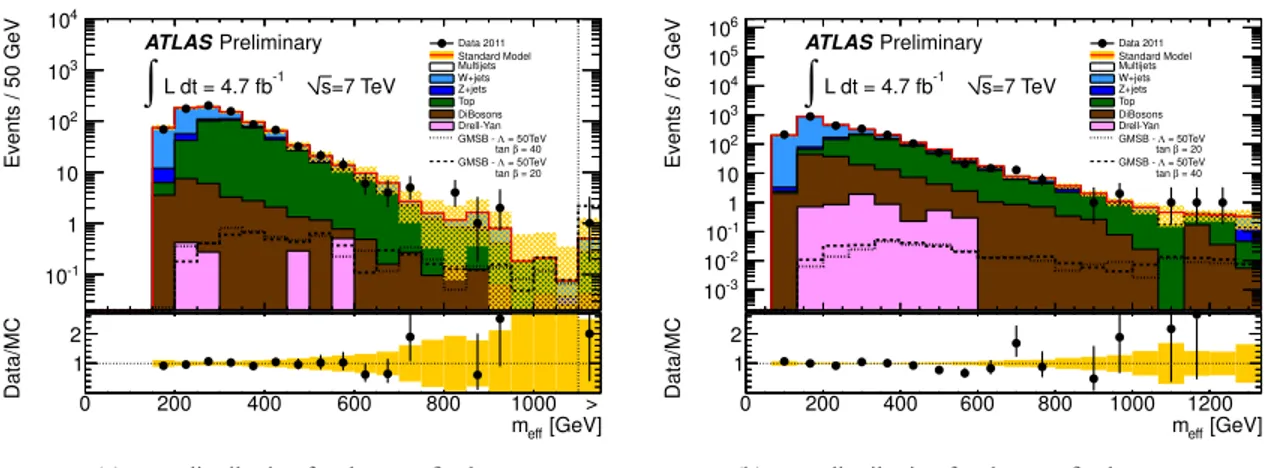
Fig. 3 and 4 show theHTdistributions in the 1τand 2τchannels, andmeff distributions in theτ+µ andτ+echannels, respectively, after all other selection criteria have been imposed.
[GeV]
HT
0 200 400 600 800 1000 1200
Events / 40 GeV
10-1
1 10 102
103 ATLAS Preliminary
= 7 TeV s
-1 L dt = 4.7 fb
∫
Data 2011 Standard Model Multijets W+jets Z+jets Top DiBosons Drell-Yan
= 50 TeV Λ GMSB -
= 40 β tan
= 50 TeV Λ GMSB -
= 20 β tan
[GeV]
HT
0 200 400 600 800 1000 1200
Data/MC 0
1 2
(a) HTdistribution for the 1τfinal state.
0 200 400 600 800 1000 1200
Events / 40 GeV
10-1
1 10
102 ATLASPreliminary
=7 TeV s L dt = 4.7 fb-1
∫
Data 2011 Standard Model Multijets W+jets Z+jets Top DiBosons Drell-Yan
= 50TeV Λ GMSB -
= 40 β tan
= 50TeV Λ GMSB -
= 20 β tan
[GeV]
HT
0 200 400 600 800 1000 1200
Data/MC
1 2
(b) HTdistribution for the 2τfinal state.
Figure 3: Distribution ofHT for the 1τ(a) and 2τ(b) final states after all analysis requirements. Data are represented by the points, with statistical uncertainty only. The SM prediction includes the data driven corrections discussed in the text. The band centred around the total SM background indicates the statistical uncertainty on the estimated background expectation. Also shown is the expected signal from two typical GMSB samples (Λ =50 TeV,tanβ=40,Λ =50 TeV,tanβ=20).
0 200 400 600 800 1000
Events / 50 GeV
10-1
1 10 102
103
104
ATLASPreliminary
=7 TeV s L dt = 4.7 fb-1
∫
Data 2011 Standard Model Multijets W+jets Z+jets Top DiBosons Drell-Yan
= 50TeV Λ GMSB -
= 40 β tan
= 50TeV Λ GMSB -
= 20 β tan
[GeV]
meff
0 200 400 600 800 1000
Data/MC
1 2
>
(a) meffdistribution for theτ+µfinal state.
0 200 400 600 800 1000 1200
Events / 67 GeV
10-3
10-2
10-1
1 10 102
103
104
105
106
ATLASPreliminary
=7 TeV s L dt = 4.7 fb-1
∫
Data 2011 Standard Model Multijets W+jets Z+jets Top DiBosons Drell-Yan
= 50TeV Λ GMSB -
= 20 β tan
= 50TeV Λ GMSB -
= 40 β tan
[GeV]
meff
0 200 400 600 800 1000 1200
Data/MC
1 2
(b) meffdistribution for theτ+efinal state.
Figure 4: Distribution ofmeff for theτ+µ(a) andτ+e(b) final states after all analysis requirements.
Data are represented by the points, with statistical uncertainty only. The SM prediction includes the data driven corrections discussed in the text. The band centred around the total SM background indicates the statistical uncertainty on the estimated background expectation. Also shown is the expected signal from two typical GMSB samples (Λ =50 TeV,tanβ=40,Λ =50 TeV,tanβ=20). In theτ+µplot, the event in data surviving all the analysis requirements is shown in the overflow bin. This is compatible with the expected Standard Model background.
6 Background estimation
For all four final states, the SM background expectation predicted by simulation in the SR is corrected, after all selection criteria are applied, by means of control regions (CRs) which are chosen such that a specific background process is enriched while any overlap with the SR is avoided. Scaling factors are obtained from the ratio of the number of observed to number of simulated background events in the control region where a given background is enriched. This is necessary due to the fact that the MC overestimates the number of events in the CR compared to data, mainly due to mis-modeling ofτmis- identification probabilities and kinematics. MC studies show that theτmis-identification probability is, to a good approximation, independent of the kinematic variables used to separate the SR from the CRs, so that the measured ratio of the data to MC event yields in the CR can be used to compute scaling factors to correct the MC background prediction in the SR.
The dominant backgrounds in the SR arise from top quark pair plus single top events (herein gener- ically indicated astt),¯ W+jets, Z+jets and multi-jet events. The latter background does not contribute significantly to theτ+µfinal state. The CR definitions used to estimate these backgrounds in the various channels are summarized in Table 2.
In the 2τchannel, theW andtt¯backgrounds are dominated by events in which oneτcandidate is a trueτand the others are mis-reconstructed from hadronic activity in the final state. The background fromZ+jets events is dominated by final states withZ→ττdecays. The CRs defined for the estimation of these backgrounds have a very small contamination from multi-jet events due to the requirement on
∆(φjet1,2−pTmiss) and the presence of two or more taus.
The signal contribution in these CRs is expected to be at less than 0.1 % for the models considered.
Correlations between different samples in the various CRs are taken into account by considering the ma- trix equationN~data = Aω~ whereN~datais the observed number of data events in each of the CRs defined in Table 2, after subtracting the expected number of multi-jet events and any remaining sub-dominant background contribution, obtained from MC. The matrixAis obtained from the MC expectation for the number of events originating from each of the backgrounds (tt,¯WandZ). The vectorω~ of scaling factors is then computed by inverting the matrixA.
To obtain the uncertainties for the scaling factors, all contributing parameters are varied according to their uncertainties, the procedure is repeated and new scaling factors are obtained. The width of the distribution of the resulting scaling factors is then used as their uncertainty. The typical scaling factors obtained with this procedure are between 0.75 and 1 , with uncertainty of order 40 %.
In the 1τchannel, the number of events fromW+jets andWZprocesses in the SR is estimated by scaling the number of corresponding MC events with the ratio of data to MC events in theW+jets CR.
The corresponding scaling factors are computed separately for the cases in which theτcandidates from W/tt¯decays are true taus and for those in which they are mis-reconstructed from hadronic activity in the final state. In the case of background events with trueτcandidates, the charge asymmetry method in the W+jets CR is used [65, 66] to estimate theW+jets scaling factor. The charge of theW+jets is defined by the charge of the leadingτcandidate in theW+jets CR. A scaling-factor based technique is also used to estimate the background coming fromt¯tevents, where the number of b-tagged events in data in thett¯ CR is fitted to a template from MC. For background events coming from fakeτcandidates, the method already discussed for the 2τbackground estimation is employed, where the parameters in the vectorω~ of scaling factors areωWf ake,ωtrueW ,ωt¯f aket andωtruet¯t . The values ofωtruet¯t obtained from this method and the template fit are in very good agreement. The factorωtrueW obtained with the charge asymmetry method agrees within 2σwith the one obtained with the matrix inversion method. The resulting difference is then assigned as a systematic uncertainty on theW+jets background estimation procedure. The background fromZ+jets events is due to events where theZdecays to a pair of neutrinos, and contributes fully to the observedEmissT . The background contribution in the SR is estimated from data by measuring the data/MC
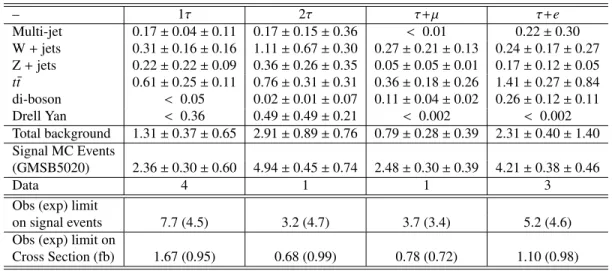
Table 3: Number of expected background events and data yields in the four final states discussed. Where possible, the uncertainties are separated in statistical and systematic. The SM prediction is computed taking into account correlations between the different uncertainties. Also shown are the number of ex- pected signal MC events for one GMSB point (Λ=50 TeV, tanβ=20) and the 95 % Confidence Level (CL) limit on the number of observed (expected) signal events from any new physics scenario that can be set for each of the four final states, taking into account the observed events in data and the background expectations.
– 1τ 2τ τ+µ τ+e
Multi-jet 0.17±0.04±0.11 0.17±0.15±0.36 < 0.01 0.22±0.30 W+jets 0.31±0.16±0.16 1.11±0.67±0.30 0.27±0.21±0.13 0.24±0.17±0.27 Z+jets 0.22±0.22±0.09 0.36±0.26±0.35 0.05±0.05±0.01 0.17±0.12±0.05 t¯t 0.61±0.25±0.11 0.76±0.31±0.31 0.36±0.18±0.26 1.41±0.27±0.84 di-boson < 0.05 0.02±0.01±0.07 0.11±0.04±0.02 0.26±0.12±0.11 Drell Yan < 0.36 0.49±0.49±0.21 < 0.002 < 0.002 Total background 1.31±0.37±0.65 2.91±0.89±0.76 0.79±0.28±0.39 2.31±0.40±1.40 Signal MC Events
(GMSB5020) 2.36±0.30±0.60 4.94±0.45±0.74 2.48±0.30±0.39 4.21±0.38±0.46
Data 4 1 1 3
Obs (exp) limit
on signal events 7.7 (4.5) 3.2 (4.7) 3.7 (3.4) 5.2 (4.6) Obs (exp) limit on
Cross Section (fb) 1.67 (0.95) 0.68 (0.99) 0.78 (0.72) 1.10 (0.98)
ratio from Z → `+`− decays in theZ+jets CR defined in Table 2. Typical scaling factors are between 0.75 and 1.2 , with uncertainty of order 20 %.
In theτ+µandτ+echannels, thet¯tbackground consists of events where the muon (electron) candi- date is a true muon (electron), and theτcandidate can either be a trueτor a hadronic jet mis-identified as aτ. On the other hand, theW+jets background consists mainly of events where theτ candidate is mis-reconstructed from hadronic activity in the final state. For this reason, thet¯tCR is separated in two:
one dominated by trueτcandidates, defined by 50 GeV<me, µT <100 GeV, and one dominated by fake ones (100 GeV< me, µT < 150 GeV). The same matrix approach already described is then used to esti- mate the contribution of true/fakett¯andW+jets backgrounds to the SR. The scaling factors obtained are of the order of 0.6-0.8 , with typical uncertainty of 15 %. TheZ+jets background is much smaller than theW+jets one, and it is estimated using MC simulated events.
The multi-jet background expectation for the 1τand 2τfinal states is computed in a multi-jet domi- nated CR defined by inverting the∆(φjet1,2−pTmiss) requirement and not applying themT(mτT1+mτT2) andHT selection. In addition, an upper limit is imposed on the ratioETmiss/meffto increase the purity of this CR sample. In theτ+µandτ+echannels, the multi-jet background arises from mis-identified prompt lep- tons. By comparing the rates of events with and without the lepton isolation requirement, a data-driven estimate is obtained following the method described in Ref. [63].
The contribution from other sources of background considered (Drell-Yan and di-boson events) is estimated in all analyses using MC simulated events.
The resulting estimated numbers of background events in the SR for all the channels are summarized in Table 3.
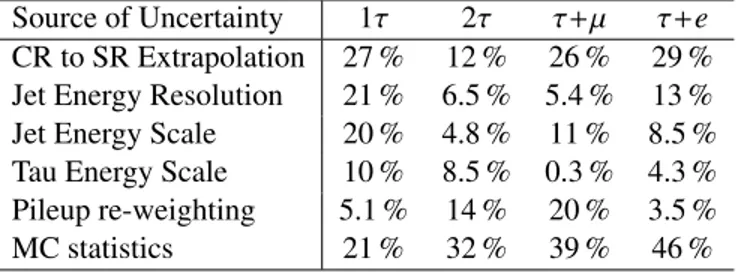
Table 4: Overview of the major systematic uncertainties and the MC statistical uncertainty for the back- ground estimates in the four channels presented in this note.
Source of Uncertainty 1τ 2τ τ+µ τ+e
CR to SR Extrapolation 27 % 12 % 26 % 29 % Jet Energy Resolution 21 % 6.5 % 5.4 % 13 % Jet Energy Scale 20 % 4.8 % 11 % 8.5 % Tau Energy Scale 10 % 8.5 % 0.3 % 4.3 % Pileup re-weighting 5.1 % 14 % 20 % 3.5 %
MC statistics 21 % 32 % 39 % 46 %
7 Systematic uncertainties on the background
Various systematic uncertainties have been studied and the effect on the number of expected background events in each one of the channels presented here has been taken into account, following the approach of Refs. [21, 22]. The dominant systematic uncertainties in the different channels are summarised in Table 4.
The theoretical uncertainty on the MC-based corrected extrapolation of the W+jets and t¯t back- grounds from the CR into the SR is estimated using alternative MC samples. These MC samples have been obtained by varying the renormalisation and factorisation scales, the functional form of the fac- torisation scale and the matching threshold in the parton shower process in the generators used for the simulation of the events described in Section 3.
Systematic uncertainties on the jet energy scale (JES) and jet energy resolution (JER) [56] are applied in MC to the selected jets and propagated throughout the analysis. The difference in the number of expected background events obtained with the nominal MC simulation after applying these changes is taken as the systematic uncertainty.
The effect of theτ energy scale (TES) uncertainty on the expected background is estimated in a similar way. The uncertainties from the jet andτenergy scale are treated as fully correlated.
The uncertainties on theτidentification efficiency on the background depend on theτidentification algorithm (“loose” or “medium”), the kinematics of theτsample and the number of associated tracks.
In the different channels, they vary between 2-5 %.
A systematic uncertainty associated with the simulation of pile-up in the MC is also taken into ac- count, with uncertainties varying between 5-20 %.
The effect of the 1.8 % uncertainty on the luminosity measurement [26, 27] on the normalization of theZ+jets, Drell-Yan and di-boson backgrounds, for which scale factors derived from CR regions were not applied, is also considered.
The total systematic uncertainties obtained in the 1τ, 2τ,τ+µandτ+echannels are 52 %, 26 %, 49 % and 60 %, respectively. The limited size of the MC samples used for background estimation gives rise to a statistical error ranging from 21 % in the 1τto 46 % in theτ+echannel.
8 Signal e ffi ciencies and systematic uncertainties
The GMSB signal samples have been described in Section 3. The total cross section drops from 100 pb forΛ =15 TeV to 5.0 fb forΛ =80 TeV. The cross section for strong production, for which this analysis has the largest efficiency, decreases faster than the cross section for slepton- and gaugino production, such that for large values ofΛthe selection efficiency with respect to the total SUSY production decreases.
For the different final states, in the ˜τ1NLSP region the efficiency is of the order of 3 % for the 2τchannel,
1 % for theτ+µandτ+echannels, and 0.5 % for the 1τchannel. In the non-˜τ1NLSP regions and for high Λvalues it drops to 0.1-0.2 % for all final states. The total systematic uncertainty on the signal selection from the various sources discussed in Section 7 ranges between 10-15 % for the 1τchannel, 15-18 % for the 2τchannel, 8-16 % for theτ+µchannel and 11-17 % for theτ+echannel over the GMSB signal grid.
Theoretical uncertainties related to the GMSB cross section predictions are obtained using the same procedure as detailed in Ref. [22]. These uncertainties are calculated for individual SUSY production processes and for each model point in the GMSB grid, leading to overall theoretical cross section uncer- tainties between 5 % and 25 %.
9 Results
Table 3 summarizes the number of observed yields in the four channels in data and the number of ex- pected background events, with separate statistical and systematic uncertainties. From the data observed, an upper limit at 95 % Confidence Level (CL) of 7.7, 3.2, 3.7 and 5.2 observed signal events from any scenario of physics beyond the SM is calculated in the 1τ, 2τ, τ+µ and τ+echannels, respectively.
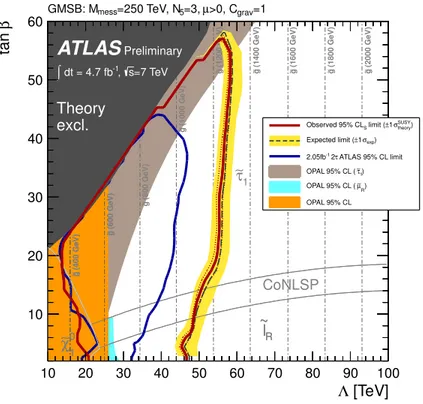
Using only the background expectations, an expected limit of 4.5, 4.7, 3.4 and 4.6 events is calculated for the four channels (1τ, 2τ,τ+µ andτ+e). These limits are computed using the profile likelihood method [67] andCLscriterion [68]. Uncertainties on the background and signal expectations are treated as Gaussian-distributed nuisance parameters in the likelihood fit. These upper limits translate into a 95 % CL observed (expected) upper limit on the visible cross section for new phenomena for each of the four final states, defined by the product of cross section, branching fraction, acceptance and efficiency for the selections defined in Section 5. The results are summarized in Table 3 for all channels. In order to produce the strongest possible 95 % CL limit on the GMSB model parametersΛand tanβ, a statistical combination of the four channels is performed, in which the full likelihood function that represents the outcome of the combination is used. This uses the fact that the four final states considered are all statis- tical independent. The resulting observed and expected limits for the combination of the four final states are shown in Fig. 5. These limits are calculated including all experimental and theoretical uncertainties on the background and signal expectations. Excluding the theoretical uncertainties on the signal cross section from the limit calculation has a negligible effect on the limits obtained. Fig. 5 also includes the limits from OPAL [25] for comparison. The best exclusion of the combination of all final states is set for Λ =58 TeV for values of tanβ ≥ 45. The results extend previous limits and values ofΛ<47 TeV are now excluded at 95 % CL, independent of tanβ.
10 Conclusions
A search for SUSY in final states with jets,EmissT , light leptons (e/µ) and hadronically decayingτleptons is performed using 4.7 fb−1of √s =7 TeV ppcollision data recorded with the ATLAS detector at the LHC. In the four final states studied, no excess is found above the expected SM backgrounds. The results are used to set model-independent 95 % CL upper limits on the number of signal events from new phenomena and corresponding upper limits on the visible cross section for the four different final states.
Limits on the model parameters are set for a minimal GMSB model. A limit on the SUSY breaking scale Λof 47 TeV is determined, independent of tanβ, by statistically combining the result of the four analyses described in this note. The limit onΛincreases to 58 TeV for tanβ ≥ 45. These results provide the most stringent test to date of GMSB SUSY breaking models in a large part of the parameter space considered, improving previous best limits from ATLASτanalyses.
[TeV]
Λ
10 20 30 40 50 60 70 80 90 100
βtan
10 20 30 40 50 60
grav=1
>0, C µ
5=3,
=250 TeV, N GMSB: Mmess
1
χ∼0
τ∼1
CoNLSP
lR
~ Theory
excl.
(2000 GeV)g~
(1800 GeV)g~
(1600 GeV)g~
(1400 GeV)g~
(1200 GeV)g~
(1000 GeV)g~
(800 GeV)g~
(600 GeV)g~
(400 GeV)g~
1
χ∼0 ~lR
Theory excl.
(600 GeV)g~
(400 GeV)g~ (600 GeV)g~
(400 GeV)g~
1
χ∼0
Theory excl.
ATLAS
Preliminary=7 TeV s
-1, dt = 4.7 fb
∫
theory) σSUSY
±1 limit ( Observed 95% CLS
) σexp
±1 Expected limit (
ATLAS 95% CL limit τ
-1 2 2.05fb
1) τ∼
OPAL 95% CL (
R) µ∼
OPAL 95% CL ( OPAL 95% CL
Figure 5: Expected and observed 95 % CL lower limits on the minimal GMSB model parametersΛand tanβ. The dark grey area indicates the region which is theoretically excluded due to unphysical sparticle mass values. The different NLSP regions are indicated. In the CoNLSP region the ˜τ1and the ˜`Rare the NLSP. Additional model parameters areMmess =250 TeV,N5 =3,µ >0 andCgrav =1. The previous OPAL [25] limits are shown. The recent ATLAS limit [22] obtained on a sub-set (2 fb−1) of the 2011 data and only in the 2τfinal state is also shown.
References
[1] H. Miyazawa,Baryon Number Changing Currents, Prog. Theor. Phys.36 (6)(1966) 1266–1276.
[2] P. Ramond,Dual Theory for Free Fermions, Phys. Rev.D3(1971) 2415–2418.
[3] Y. A. Golfand and E. P. Likhtman,Extension of the Algebra of Poincare Group Generators and Violation of p Invariance, JETP Lett.13(1971) 323.
[4] A. Neveu and J. H. Schwarz,Factorizable dual model of pions, Nucl. Phys.B31(1971) 86.
[5] A. Neveu and J. H. Schwarz,Quark Model of Dual Pions, Phys. Rev.D4(1971) 1109.
[6] J. Gervais and B. Sakita,Field theory interpretation of supergauges in dual models, Nucl. Phys.
B34(1971) 632–639.
[7] D. V. Volkov and V. P. Akulov,Is the Neutrino a Goldstone Particle?, Phys. Lett.B46(1973) 109.
[8] J. Wess and B. Zumino,A Lagrangian Model Invariant Under Supergauge Transformations, Phys.
Lett.B49(1974) 52.
[9] J. Wess and B. Zumino,Supergauge Transformations in Four-Dimensions, Nucl. Phys.B70(1974) 39.
[10] M. Dine and W. Fischler,A Phenomenological Model of Particle Physics Based on Supersymmetry, Phys. Lett.B110(1982) 227.
[11] L. Alvarez-Gaume, M. Claudson, and M. Wise,Low-energy Supersymmetry, Nucl. Phys.B207 (1982) 96.
[12] C. R. Nappi and B. A. Ovrut,Supersymmetric Extension of the SU(3) x SU(2) x U(1) Model, Phys.
Lett.B113(1982) 175.
[13] M. Dine and A. E. Nelson,Dynamical supersymmetry breaking at low-energies, Phys. Rev.D48 (1993) 1277,arXiv:hep-ph/9303230.
[14] M. Dine, A. E. Nelson, and Y. Shirman,Low-energy dynamical supersymmetry breaking simplified, Phys. Rev.D51(1995) 1362,arXiv:hep-ph/9408384.
[15] M. Dine, A. E. Nelson, Y. Nir, and Y. Shirman,New Tools for Low-energy Dynamical Supersymmetry Breaking, Phys. Rev.D53(1996) 2658,hep-ph/9507378.
[16] P. Fayet,Supersymmetry and Weak, Electromagnetic and Strong Interactions, Phys. Lett.B64 (1976) 159.
[17] P. Fayet,Spontaneously Broken Supersymmetric Theories of Weak, Electromagnetic and Strong Interactions, Phys. Lett.B69(1977) 489.
[18] G. R. Farrar and P. Fayet,Phenomenology of the Production, Decay, and Detection of New Hadronic States Associated with Supersymmetry, Phys. Lett.B76(1978) 575.
[19] P. Fayet,Relations Between the Masses of the Superpartners of Leptons and Quarks, the Goldstino Couplings and the Neutral Currents, Phys. Lett.B84(1979) 416.
[20] S. Dimopoulos and H. Georgi,Softly Broken Supersymmetry and SU(5), Nucl. Phys.B193(1981) 150.
[21] ATLAS Collaboration,Search for Supersymmetry with Jets, Missing Transverse Momentum and at Least One Hadronically Decaying Tau Lepton in Proton-Proton Collisions at √s=7TeV with the ATLAS Detector, Phys. Lett.B 714(2012) 197,arXiv:1204.3852 [hep-ex].
[22] ATLAS Collaboration,Search for Events with Large Missing Transverse Momentum, Jets and at Least Two Tau Leptons in 7 TeV Proton-Proton Collision Data with the ATLAS Detector, Phys.
Lett.B 714(2012) 180,arXiv:1203.6580 [hep-ex].
[23] ALEPH Collaboration, A. Heister et al.,Search for Gauge Mediated SUSY Breaking Topologies in e+e−Collisions at Center-of-mass Energies up to 209 GeV, Eur. Phys. J.C25(2002) 339,
arXiv:hep-ex/0203024.
[24] DELPHI Collaboration, J. Abdallah et al.,Search for supersymmetric particles in light gravitino scenarios and sleptons NLSP, Eur. Phys. J.C27(2003) 153,arXiv:hep-ex/0303025.
[25] OPAL Collaboration, G. Abbiendi et al.,Searches for gauge-mediated supersymmetry breaking topologies in e+e- collisions at LEP2, Eur. Phys. J.C46(2006) 307,arXiv:hep-ex/0507048. [26] ATLAS Collaboration,Updated Luminosity Determination in pp Collisions at √s=7TeV using
the ATLAS Detector, ATLAS-CONF-2012-080, 2012.
https://cdsweb.cern.ch/record/1460392.
[27] ATLAS Collaboration,Luminosity Determination in pp Collisions at √s=7TeV Using the ATLAS Detector at the LHC, Eur. Phys. J.C71(2011) 1630,arXiv:1101.2185 [hep-ex]. [28] CMS Collaboration,Search for new physics with same-sign isolated dilepton events with jets and
missing transverse energy at the LHC, JHEP1106(2011) 077,arXiv:1104.3168 [hep-ex]. [29] CMS Collaboration,Search for Physics Beyond the Standard Model Using Multilepton Signatures
in pp Collisions at √s=7TeV, Phys. Lett.B704(2011) 411,arXiv:1106.0933 [hep-ex]. [30] ATLAS Collaboration,The ATLAS Experiment at the CERN Large Hadron Collider, JINST3
(2008) S08003.
[31] M. L. Mangano et al.,ALPGEN, a generator for hard multiparton processes in hadronic collisions, JHEP0307(2003) 001,arXiv:hep-ph/0206293 [hep-ph].
[32] J. Pumplin et al.,New generation of parton distributions with uncertainties from global QCD analysis, JHEP0207(2002) 012,arXiv:hep-ph/0201195 [hep-ph].
[33] S. Frixione and B. R. Webber,Matching NLO QCD computations and parton shower simulations, JHEP0206(2002) 029,arXiv:hep-ph/0204244 [hep-ph].
[34] S. Frixione, P. Nason, and B. R. Webber,Matching NLO QCD and parton showers in heavy flavor production, JHEP0308(2003) 007,arXiv:hep-ph/0305252 [hep-ph].
[35] S. Frixione, E. Laenen, P. Motylinski, and B. R. Webber,Single-top production in MC@NLO, JHEP0603(2006) 092,arXiv:hep-ph/0512250 [hep-ph].
[36] H. L. Lai,New parton distributions for collider physics, Phys.Rev.D82(2010) 074024.
[37] G. Corcella et al.,HERWIG 6: An Event generator for hadron emission reactions with interfering gluons (including supersymmetric processes), JHEP0101(2001) 010,arXiv:hep-ph/0011363 [hep-ph].
[38] J. Butterworth, J. R. Forshaw, and M. Seymour,Multiparton interactions in photoproduction at HERA, Z.Phys.C72(1996) 637,arXiv:hep-ph/9601371 [hep-ph].
[39] S. Jadach, Z. Was, R. Decker, and J. H. Kuhn,The Tau Decay Library TAUOLA, Version 2.4, Comput. Phys. Commun.76(1993) 361.
[40] P. Golonka et al.,The Tauola-Photos-F Environment for the TAUOLA and PHOTOS Packages, Release II, Comput. Phys. Commun.174(2006) 818.
[41] E. Barberio and Z. Was,PHOTOS - a Universal Monte Carlo for QED Radiative Corrections:
Version 2.0, Comput. Phys. Commun.79(1994) 291.
[42] T. Sjostrand, S. Mrenna, and P. Skands,PYTHIA 6.4 Physics and Manual, JHEP0605(2006) 026, arXiv:hep-ph/0603175 [hep-ph].
[43] ATLAS Collaboration,ATLAS Tunes for PYTHIA6 and PYTHIA8 for MC11,
ATLAS-PHYS-PUB-2011-009, July, 2011. https://cdsweb.cern.ch/record/1363300. [44] A. Sherstnev and R. S. Thorne,Parton Distributions for LO Generators, Eur. Phys. J.C55(2008)
553,arXiv:0711.2473 [hep-ph].
[45] F. E. Paige, S. D. Protopopescu, H. Baer, and X. Tata,ISAJET 7.69: A Monte Carlo Event Generator for pp,pp, and e¯ +e−Reactions,arXiv:hep-ph/0312045.
[46] M. Bahr et al.,Herwig++Physics and Manual, Eur. Phys. J.C58(2008) 639–707, arXiv:0803.0883v3 [hep-ph].
[47] W. Beenakker, R. Hopker, M. Spira, and P. Zerwas,Squark and Gluino Production at Hadron Colliders, Nucl. Phys.B492(1997) 51,arXiv:hep-ph/9610490 [hep-ph].
[48] A. Kulesza and L. Motyka,Threshold resummation for squark-antisquark and gluino-pair production at the LHC, Phys. Rev. Lett.102(2009) 111802,arXiv:0807.2405 [hep-ph]. [49] A. Kulesza and L. Motyka,Soft gluon resummation for the production of gluino-gluino and
squark-antisquark pairs at the LHC, Phys.Rev.D80(2009) 095004,arXiv:0905.4749 [hep-ph].
[50] W. Beenakker et al.,Soft-gluon resummation for squark and gluino hadroproduction, JHEP0912 (2009) 041,arXiv:0909.4418 [hep-ph].
[51] W. Beenakker et al.,Squark and gluino hadroproduction, Int. J. Mod. Phys.A26(2011) 2637–2664,arXiv:1105.1110 [hep-ph].
[52] M. Kr¨amer et al.,Supersymmetry production cross sections in pp collisions at √s=7TeV, arXiv:1206.2892 [hep-ph].
[53] Geant4 Collaboration, S. Agostinelli et al., Geant4: A simulation toolkit, Nucl. Instrum. Meth.
A506(2003) 250.
[54] ATLAS Collaboration,The ATLAS Simulation Infrastructure, Eur. Phys. J.C70(2010) 823, arXiv:1005.4568 [physics.ins-det].
[55] M. Cacciari, G. P. Salam, and G. Soyez,The anti-kt jet clustering algorithm, JHEP0804(2008) 063,arXiv:0802.1189 [hep-ph].
[56] ATLAS Collaboration,√s=7TeV, 2011. Submitted to Eur. Phys. J. C.Jet Energy Measurement with the ATLAS Detector in pp Collisions at
[57] ATLAS Collaboration,Measurement of the W →lνand Z/γ→ll production cross section in proton-proton collisions at √s=7TeV with the ATLAS detector, JHEP1012(2010) 060, arXiv:1010.2130 [hep-ex].
[58] ATLAS Collaboration,Electron performance measurements with the ATLAS detector using the 2010 LHC proton-proton collision data, Eur. Phys. J.C 72(2012) 1909,arXiv:1110.3174 [hep-ex].
[59] ATLAS Collaboration,Performance of Missing Transverse Momentum Reconstruction in Proton-Proton Collisions at 7 TeV with ATLAS, Eur. Phys. J.C72(2012) 1844,
arXiv:1108.5602 [hep-ex].
[60] ATLAS Collaboration,Commissioning of the ATLAS high-performance b-tagging algorithms in the 7 TeV collision data, ATLAS-CONF-2011-102, Jul, 2011.
http://cdsweb.cern.ch/record/1369219.
[61] ATLAS Collaboration,Measurement of the b-tag Efficiency in a Sample of Jets Containing Muons with 5 fb−1of Data from the ATLAS Detector, ATLAS-CONF-2012-043, Mar, 2012.
http://cdsweb.cern.ch/record/1435197.
[62] ATLAS Collaboration,Performance of the Reconstruction and Identification of Hadronic Tau Decays with ATLAS, ATLAS-CONF-2011-152, Nov, 2011.
http://cdsweb.cern.ch/record/1398195.
[63] ATLAS Collaboration,Measurement of the top quark-pair production cross section with ATLAS in p–p collisions at √s=7TeV, Eur. Phys. J.C 71(2011) 1577,arXiv:1012.1792 [hep-ex]. [64] ATLAS Collaboration,Performance of the ATLAS Trigger System in 2010, Eur. Phys. J. C72
(2012) 1849,arXiv:1110.1530 [hep-ex].
[65] ATLAS Collaboration,Measurement of the inclusive W±and Z/γ∗cross sections in the e andµ decay channels in p–p collisions at √s=7TeV with the ATLAS detector, Phys. Rev.D 85(2012) 072004,arXiv:1109.5141 [hep-ex].
[66] ATLAS Collaboration,Measurement of the charge asymmetry in top quark pair production in p–p collisions at √s=7TeV using the ATLAS detector, Eur. Phys. J.C 72(2012) 2039,
arXiv:1203.4211 [hep-ex].
[67] G. Cowan, K. Cranmer, E. Gross, and O. Vitells,Asymptotic formulae for likelihood-based tests of new physics, Eur. Phys. J.C 71(2011) 1554,arXiv:1007.1727 [physics.data-an].
[68] A. L. Read,Presentation of search results: The CLstechnique, J. Phys.G28(2002) 2693.
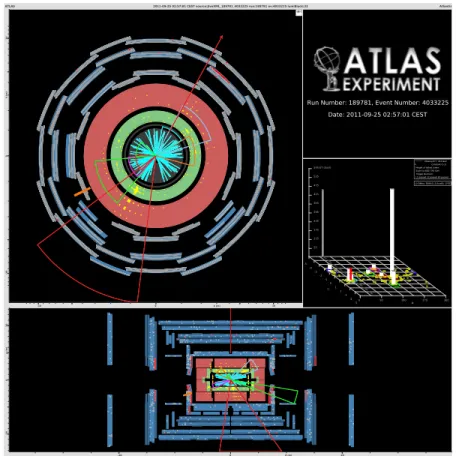
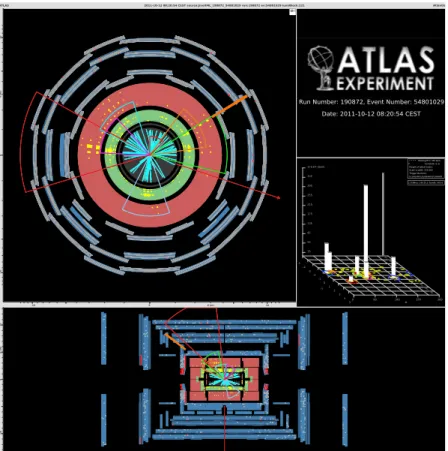
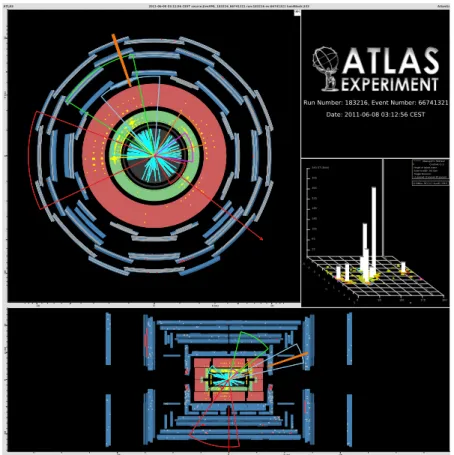
Appendix A
This section contains the event displays of the events observed in the signal regions of the different channels.
Figure 6: Event selected in the 1τchannel. ThepTof the leading and sub-leading jets are 592 GeV (red) and 86 GeV (green) respectively. The selected taupTis 32 GeV (orange).EmissT is 478 GeV (red arrow).
Figure 7: Event selected in the 1τchannel. ThepTof the leading and sub-leading jets are 372 GeV (red) and 124 GeV (green) respectively. The selected taupTis 66 GeV (orange).ETmissis 324 GeV (red arrow).
Figure 8: Event selected in the 1τchannel. ThepTof the leading and sub-leading jets are 341 GeV (red) and 212 GeV (green) respectively. The selected tau pT is 109 GeV (orange). EmissT is 577 GeV (red arrow).
Figure 9: Event selected in the 1τchannel. ThepTof the leading and sub-leading jets are 386 GeV (red) and 188 GeV (blue) respectively. The selected taupTis 266 GeV (orange).ETmissis 300 GeV (red arrow).
Figure 10: Event selected in the 2τchannel. ThepTof the leading and sub-leading jets are 466 GeV (red) and 131 GeV (green) respectively. The pT of the leading and sub-leading taus are 129 GeV and 22 GeV (orange) respectively.EmissT is 452 GeV (red arrow).
Figure 11: Event selected in the τ+e channel. The pT of the leading and sub-leading jets are 548 GeV (red) and 448 GeV (green) respectively. The selected tau and electron pT are 22 GeV (or- ange) and 90 GeV (yellow).EmissT is 68 GeV (red arrow).