ATLAS-CONF-2014-015 31/03/2014
ATLAS NOTE
ATLAS-CONF-2014-015
March 31, 2014
Search for a WZ resonance in the fully leptonic channel using pp collisions at √
s = 8 TeV with the ATLAS detector
The ATLAS Collaboration
Abstract
The search for resonantWZ production in theℓνℓ′ℓ′(ℓ, ℓ′ = e, µ) decay channel using 20.3 fb−1of √s=8 TeV LHC collision data collected by the ATLAS detector is presented.
No significant deviation from the Standard Model prediction is observed and upper limits on the production cross section of an extended gauge modelW′and a simplified model of heavy vector triplets are derived. A corresponding observed (expected) mass limit of 1.52 (1.49) TeV is found for theW′.
°c Copyright 2014 CERN for the benefit of the ATLAS Collaboration.
Reproduction of this article or parts of it is allowed as specified in the CC-BY-3.0 license.
1 Introduction
The search for diboson resonances is an essential complement to the investigation of the source of elec- troweak symmetry breaking. Despite the apparent compatibility between the properties of the newly observed boson at the LHC [1, 2, 3, 4] with those expected from the Standard Model (SM) Higgs boson, the naturalness problem associated with a light Higgs boson suggests that the SM is likely to be an effec- tive theory valid only at low energies. Extensions of the SM, such as Grand Unified Theories [5], Little Higgs models [6], Technicolor [7, 8, 9, 10], more generic Composite Higgs models [11, 12], or models of extra dimensions [13, 14, 15], predict diboson resonances at high mass.
This article describes a search for resonantWZproduction in the fully leptonic decay channelsWZ→ ℓνℓ′ℓ′(ℓ, ℓ′ =e, µ) using 20.3 fb−1ofppcollision data at √
s=8 TeV collected by the ATLAS detector.
Four possible leptonic decay channels (eνee,eνµµ,µνeeandµνµµ) are considered and the combination of these four channels shall be referred to as all channels combined. To interpret the results obtained, the extended gauge model (EGM) [16] with a spin-1 W′ boson shall be used as a benchmark signal hypothesis. In this model, the couplings of the EGMW′boson to the SM particles are identical to those of theW boson except that its coupling toWZis suppressed with respect to the SMWWZtriple gauge coupling by a factor of (mW/mW′)2 to make the width of the resonance scale linearly with mass. In other scenarios, such as for leptophobicWbosons [17, 18, 19], the decay to a pair of gauge bosons can be a dominant channel. A narrow W′ resonance is predicted in the EGM, with an intrinsic width that is negligible with respect to the experimental resolution on the reconstructedWZinvariant mass which is of the order of 100 GeV for aW′ boson with mW′ = 1 TeV. Hence, the final results presented here can be reinterpreted in the context of any spin-1 narrow-width resonance for given signal efficiencies and acceptances. In that vein, a phenomenological Lagrangian for heavy vector triplets (HVT) [20], which can be used to reinterpret the results in terms of a large class of specific models, parametrizes their couplings to fermions and to gauge bosons, and introduces a global parametergV, related to the general strength of the interaction. It provides two benchmark models which will be used here as well. In Model A, weakly coupled vector resonances arise from an extension of the SM gauge group. In Model B, the heavy vector triplet is produced by a strongly coupled scenario, in particular from a Composite Higgs model where the Higgs results from S O(5)/S O(4) global symmetry, with a ρ triplet mixing with the SM vector bosons. The parametergV modifies the couplings of fermions and gauge bosons to the heavy vector triplet.
Direct searches forWZresonances have been reported by several experiments. The ATLAS collabo- ration reported on searches for aW′resonance using approximately 1 fb−1of data for theℓνℓ′ℓ′channel, and 4.7 fb−1 of data for theℓνj jchannel, both at √
s = 7 TeV and excluded an EGMW′ boson with masses below 760 GeV [21] and 950 GeV [22] respectively. The CMS collaboration analyzed 5 fb−1of data at √
s= 7 TeV in theℓνℓ′ℓ′channel and EGMW′bosons with masses below 1143 GeV [23] were excluded.
2 The ATLAS detector
The ATLAS detector [24] consists of an inner tracking detector (ID), electromagnetic (EM) and hadronic sampling calorimeters, and a muon spectrometer. The ID is immersed in a 2 T magnetic field generated by a superconducting solenoid, and consists of a silicon pixel detector, a silicon microstrip detector, and a transition radiation tracker. The ID provides a pseudorapidity coverage of |η| < 2.5 1. The EM
1ATLAS uses a right-handed coordinate system with its origin at the nominal ppinteraction point (IP) in the center of the detector and thez-axis along the beam. Thex-axis points from the IP to the center of the LHC ring, and they-axis points upward. Cylindrical coordinates (r, φ) are used in the transverse plane,φbeing the azimuthal angle around thez-axis. The pseudorapidity is defined in terms of the polar angleθasη = −ln tan(θ/2). The separation between final state particles is
calorimeters are composed of interspersed lead and liquid argon acting as absorber and active material respectively, with high granularity in both the barrel (|η| < 1.475) and end-cap (1.375 < |η| < 3.2) regions. In the forward regions (3.15<|η|<4.9), where radiation is intense, the calorimeters have lower granularity and sampling fraction, as well as absorbers that are made of copper and tungsten instead of lead. The hadronic calorimeter uses steel and scintillating tiles in the barrel region, while the endcaps use liquid argon as the active material and copper as absorber. The muon spectrometer (MS) is based on three large superconducting air-core toroids arranged with an eight-fold azimuthal coil symmetry around the calorimeters. Three layers of precision tracking chambers, consisting of drift tubes and cathode strip chambers, enable precision muon track measurements in the pseudorapidity region of |η| < 2.7, and resistive-plate and thin-gap chambers provide muon triggering capability in the region of|η|<2.4.
3 Data and Monte Carlo modeling
The data analyzed here were collected by the ATLAS detector at the LHC inppcollisions at a center-of- mass energy of √
s=8 TeV during the 2012 data taking run. Events are selected using unprescaled single isolated electron (muon) triggers with a 24 GeV transverse energy (momentum) threshold. Since we re- quire three high-pTleptons in the final state, the trigger efficiency is very high. After data-quality require- ments are applied, the total integrated luminosity is 20.3 fb−1with a relative uncertainty of 2.8% [25].
The luminosity uncertainty is taken into account as a systematic uncertainty.
The baseline EGMW′ signals are generated with PYTHIA8.162 [26] and the MSTW2008LO [27]
parton distribution function (PDF) set. The production cross section times branching ratio (withW → eνe, µνµ, τντ, where allτdecays are considered, andZ →ee, µµ) at leading order (LO) ranges from 1.1 pb formW′ =200 GeV, 32 fb formW′ = 600 GeV, 0.59 fb formW′ = 1.2 TeV to 0.06 fb formW′ = 2 TeV.
Regarding the W → τντ component, only the leptonic τ decay affects the signal acceptance, albeit slightly and only at high signal mass. The decayZ →ττis negligible. The intrinsic width of the EGM W′scales linearly withmW′ and spans from 5.46 GeV formW′ = 200 GeV to 72 GeV formW′ =2 TeV.
The cross sections are scaled to their theoretical predictions at next-to-next-to-leading-order (NNLO) using ZWPROD [28]. Monte-Carlo (MC) events are processed through the full detector simulation [29]
using4 [30], and their reconstruction is performed with the same software used to reconstruct data events. The MC samples are only available for the EGMW′signal from 200 GeV to 2 TeV at an interval of 200 GeV. An interpolation procedure is adopted to obtain the distributions for mass points between 200 GeV and 400 GeV with 25 GeV step width and from 400 GeV to 2 TeV with 50 GeV step width.
Process Generator Parton Shower PDF
W′ PYTHIA PYTHIA MSTW2008LO [27]
WZ POWHEG-BOX PYTHIA
ZZ POWHEG-BOX PYTHIA CT10 [31]
Zγ SHERPA SHERPA
tt+W¯ /Z MadGraph PYTHIA CTEQ6L1 [32]
Table 1: Overview of the primary MC samples. The reducible backgrounds from misidentified jets are estimated from the data.
The dominant irreducible SM WZ background is modeled by POWHEG-BOX 1.0 [33], a next-to- leading-order (NLO) event generator combined with the NLO CT10 PDF set [31]. Background events arising fromZZare modeled withPOWHEG-BOX, while those fromt¯t+W/Zprocesses are generated with
defined as∆R= p
(∆η)2+(∆φ)2. The transverse momentum is denoted aspT.
MadGraph5.1.4.8 [34] together with the CTEQ6L1 [32] PDF set. All these events are interfaced with PYTHIAfor parton showering.
A second category of background arises from photons being misidentified as electrons, mainly from Zγproduction. A photon can be reconstructed as an electron if it lies close to a charged particle track or the photon converts toe+e−after interacting with the material in front of the calorimeter. The contribution is estimated usingZγsimulated MC events generated withSHERPA1.4.0 [35].
Finally, a third category of background includes all other sources where one or more jets is misiden- tified as an isolated lepton. These include the production of Z+jets simulated with ALPGEN2.14 [36], t¯twithMC@NLO4.03 [37], WW+jets withPOWHEG-BOX, single top withAcerMC3.8 [38],W+jets with ALPGEN, and QCD multijets events withPYTHIA. The parton showering is modelled byHERWIG/JIMMY[39, 40] for Z+jets,tt¯andW+jets events, and PYTHIAfor WW+jets, single top and QCD multijets events.
The contributions from thesefakebackgrounds are estimated using a data-driven method as described in Sect. 5. The MC simulation of these backgrounds shall nonetheless be used for their modeling of prompt leptons, which is needed in the computation of the rate at which jets are misidentified as leptons. The contribution from events with only one jet misidentified as an isolated lepton is found to be dominant and the others negligible. Thus in the analysis we denote thefakebackgrounds asℓℓ′+jets.
An overview of the main MC samples used is found in Table 1. Correction factors for lepton re- construction and identification efficiencies are applied to the simulation to account for differences with respect to data. The simulated lepton 4-momenta are tuned, via calorimeter energy scaling and momen- tum resolution smearing, to reproduce what is observed in data from leptonic W, Z and J/ψ decays.
Furthermore, additional inelastic ppcollision events are overlaid with the hard scattering process in the MC simulation and then reweighted to reproduce the observed average number of interactions per bunch-crossing in data.
4 Event selection
Candidate events are required to contain at least one primary vertex (PV), which is defined as the vertex with the largest sum of squared transverse momenta of associated tracks. This PV must also have at least three associated tracks with pT >0.4 GeV.
Electron candidates are reconstructed in the region of the EM calorimeter with|η|<2.47 by matching the calorimeter clusters to the tracks in the ID. The transition region between the barrel and endcap calorimeters (1.37 < |η| < 1.52) is excluded. Candidate electrons must satisfy themedium++quality definition [41] re-optimized for 2012 data-taking conditions, which is based on a set of requirements on the calorimeter shower shape, track quality, and track matching with the calorimeter cluster. The longitudinal impact parameterz0 of the associated track with respect to the PV must satisfy|z0sinθ| <
0.5 mm. The transverse impact parameterd0 of the associated track must satisfy|d0/σd0| < 6, where σd0 is the uncertainty in the measurement of d0. To reduce the background due to jets misidentified as electrons, electron candidates are required to be isolated in both the calorimeters and the ID with the requirements of RisoCal < 0.16 and RisoID < 0.16. RisoCal is the total transverse energy recorded in the calorimeters within a cone of radius∆R= p
(∆η)2+(∆φ)2 =0.3 around the electron direction excluding the energy of the electron itself, divided by the electronET; andRisoID is the sum of thepTof the tracks in a cone of∆R= 0.3 around the lepton direction, excluding the track of the lepton, divided by the lepton
pT.
Muon candidates are reconstructed within the range|η| < 2.5 by combining tracks in the ID and MS. A robust reconstruction is ensured by requiring a minimum number of silicon microstrip and pixel hits associated with the track. Similar to electron candidates, the muon reconstructed track must satisfy the requirements|z0sinθ| < 0.5 mm and|d0/σd0| < 3.5. The measured momenta in the ID and MS are required to be consistent with each other by satisfying |(q/p)ID− (q/p)MS| < 5σ, where (q/p)ID and
(q/p)MSare the chargeqover momentum pin the ID and MS respectively, andσis the total uncertainty on the difference betweenq/p measurements in the ID and MS. The muon isolation requirements are RisoCal<0.2 andRisoID <0.15.
When theZ boson has high momentum, its collimated lepton decay products can have a∆R < 0.3.
The isolation requirements imposed on each lepton are therefore modified to not include in the calculation ofRisoCalandRisoIDthe energy and momenta of the other second same-flavour lepton. This allows to maintain a high signal efficiency for high mass signals. For instance, for amW′ = 1.4 TeV signal, the relative efficiency gain, with respect to the selection without modifying the isolation requirements, is of the order of 60%.
Jets are reconstructed up to|η|< 4.5 from calorimeter clusters with the anti-kt algorithm [42] using a distance parameter of 0.4 . The jet energy is calibrated to the hadronic scale and the jet candidate is required to havepT >25 GeV. For those withpT<50 GeV and|η|<2.4, the jet vertex fraction, defined as the fraction of the sum of thepTof the tracks associated with the jet and matched to the primary vertex, normalised by the sum of the pTof all tracks associated with the jet, is required to be larger than 50%. If a reconstructed jet lies within a cone of∆R= 0.3 from an electron, the jet is discarded. Similarly, if an electron is found within a cone of∆R=0.1 from a muon, the electron is discarded.
The measurement of the missing transverse momentum, EmissT , is based on the measurement of all reconstructed objects in the EM and hadronic calorimeters (including taus), and muons reconstructed by the ID and the MS. Calorimeter cells associated with reconstructed jets withpT>20 GeV are calibrated at the hadronic scale, whereas calorimeter cells not associated with any objects are calibrated at the EM energy scale.
CandidateWZ →ℓνℓ′ℓ′events are selected by requiring three charged leptons withpT>25 GeV and EmissT >25 GeV. Events are rejected if a fourth lepton is found withpT>20 GeV. At least one of the three leptons is required to be geometrically matched to a lepton reconstructed by the trigger algorithm. Two opposite-sign same-flavour leptons are required to have an invariant mass (mℓℓ) within 20 GeV of theZ boson pole mass 91.1875 GeV [43]. If two possibilities exist, the pair that hasmℓℓclosest to theZboson pole mass is chosen. To suppress theZ+jets background where one jet is reconstructed as an isolated electron, the electrons used in the reconstruction of the W bosons are required to pass more stringent identification criteria (the tight++quality definition defined in Ref [41]) than themedium++quality definition required for the leptons that are the product of the Z boson decay. Finally, to increase the sensitivity of the search, events are selected if∆y(W,Z) < 1.5, where∆y(W,Z) is the rapidity difference between theWandZbosons.
Attributing theEmissT to the transverse component of the neutrino momentum, its longitudinal com- ponent is derived requiring that the lepton, from theWboson decay, and the neutrino momentum have an invariant mass equal to the pole mass of the Wboson 80.385 GeV [44]. The constraint results in a quadratic equation with two solutions. The one with the smaller absolute value is kept if the solutions are real, and only the real part is kept if the solutions are complex numbers. The invariant mass of the WZ →ℓνℓ′ℓ′system is reconstructed from the four-vectors of the candidateWandZbosons and shall be used as the signal discriminant variable.
To improve the sensitivity of the search to the EGMW′ boson, two signal regions are defined, one more sensitive for high mass W′ signals (mW′ & 250 GeV) and the other one for low mass W′ sig- nals (mW′ . 250 GeV). The high mass signal region (SR1) is defined by the additional requirement
∆φ(ℓ,EmissT ) < 1.5, where∆φ(ℓ,ETmiss) is the azimuthal angle difference between the lepton from theW decay and the missing transverse momentum vector. Conversely, the low mass signal region (SR2) is required to have∆φ(ℓ,EmissT )>1.5, where low mass signal efficiency is recovered.
For the EGMW′signals, the acceptance times efficiency (A ×ǫ) in SR1 increases from 2% to 30%
formW′ from 200 GeV to 2 TeV, while theA ×ǫin SR2 decreases from 8% to 0%.
5 Background estimations
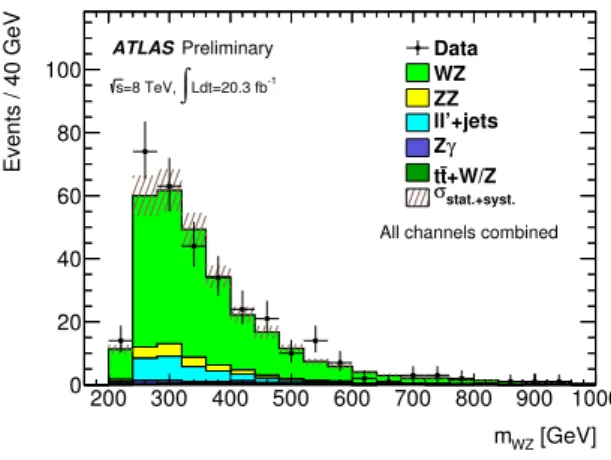
The dominant irreducible backgrounds come from the SMWZ, ZZ andtt¯+W/Z processes with three prompt leptons in the final state. The contributions from these backgrounds are estimated using the MC samples. A control region dominated by SMWZevents is defined to check the modeling of the MC predictions for these irreducible backgrounds. The selection criteria used for this region are similar to the signal regions except that the requirement on∆y(W,Z) is reversed and the requirement on∆φ(ℓ,ETmiss) is dropped. In total 323 events are observed in data for all four channels combined and the SM backgrounds are expected to be 298±4(stat.)±26(syst.) events. Good agreement is found between observed data and SM predictions also in terms of the shape of various kinematical distributions. One example is shown in Fig. 1 for themWZ distribution.
[GeV]
mWZ
200 300 400 500 600 700 800 900 1000
Events / 40 GeV
0 20 40 60 80 100
ATLASPreliminary Ldt=20.3 fb-1
∫
=8 TeV, s
All channels combined Data WZ ZZ ll’+jets
γ Z
+W/Z t t
stat.+syst.
σ
Figure 1: Distributions of the expected versus observed yields in the SMWZcontrol region for the four ℓνℓ′ℓchannels combined. The uncertainty bands upon the expected background include both statistical and systematic uncertainties in the MC and the fake background estimation added in quadrature.
Contributions from theℓℓ′+jets background, where at least one lepton originates from hadron decays in jets, are estimated using a data-driven fake factor method. A lepton-like jet is defined as a jet that passes all lepton selection criteria but, in the muon case, fails either the calorimeter or track isolation requirement, and, in the electron case, fails the isolation ormedium++quality requirement but passes a looser set of electron identification quality requirements. A fake factor defined as the ratio of the proba- bility for a jet to satisfy all lepton identification criteria to the probability of a jet satisfying the lepton-like jet criteria is computed. The fake background is dominated by events with one jet misidentified as an isolated lepton, while contributions from other processes with two or three jets misidentified as isolated leptons are found to be negligible. The fake background is thus estimated by applying the fake factor to a data sample (denoted as “tight+loose sample”) selected using all signal selection criteria except for the requirement that one lepton must be a lepton-like jet. Since the electron identification requirements are different for those coming from aZ or aWboson decay, the electron fake factor is calculated separately for these two cases. In the tight+loose sample and the samples used for the fake factor measurement, the prompt background contributions are estimated using MC and subtracted from the data samples. The remaining events are thus the expected lepton yields due to misidentified jets.
The lepton fake factor is measured in two different data samples: dijet andZ+jets events. In both cases the tag-and-probe method is used, but the tagged objects are different. The larger amount of data within the dijet sample permits to measure the dependence of the lepton fake factor on the lepton pT
orη, while the Z+jets sample leads to a measurement where the kinematical distributions and flavour compositions are closer to that of the signal region, albeit with significantly less data only to allow a
measurement of the fake factor as a single number.
The dijet sample is selected with one tagged jet satisfying the nominal jet requirement and a probe jet that are back-to-back with∆φ >2.5. These events are selected by a single muon trigger in the muon case and by a single photon trigger in the electron case. The muon/photon requirements at the trigger level are looser than the lepton-like jet selection criteria in order to allow for an unbiased measurement of the lepton fake factor. To better mimic the properties of the signal region, the missing transverse energy is required to be higher than 25 GeV. The attributes of the probed jet are then examined to determine the probability that it passes the nominal lepton selection criteria or only those of the lepton-like jet.
TheZ+jets sample is selected with one same-flavour opposite-charge lepton pair that is consistent with aZ boson decay and a third lepton passing the loose lepton quality definition. They are selected by a set of single and di-lepton triggers to improve the trigger efficiency. To suppress the inclusion of prompt leptons from WZ production, events are required to haveETmiss < 25 GeV. The third lepton is used as a probe for measuring the fake factor.
In both samples, several sources of systematic uncertainty for the measurement of the fake factor are considered, stemming from trigger efficiencies threshold, kinematical and flavour differences with respect to the signal region, the EmissT threshold requirement, and MC subtraction. In the dijet sample, possible biases related to the tagged jet pT threshold, the transverse mass requirement on the probed jet and ETmisssystem, and the azimuthal angle separation between the tagged jet and the probed jet are also considered. Likewise, additional biases associated to the Z+jets sample are potential systematic kinematical differences between a low and highETmissregion.
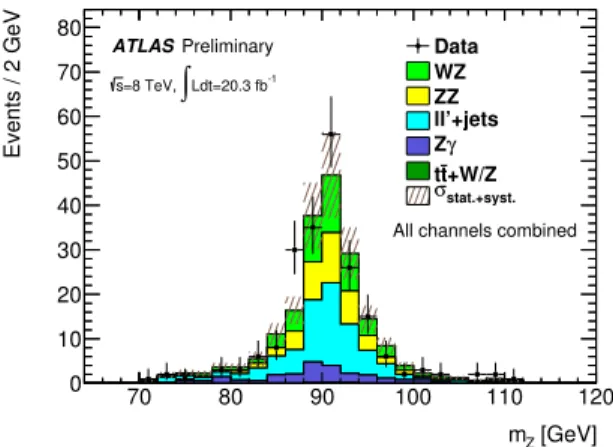
The fake factors, which are of the order of 0.1, are measured in both samples and are found to be consistent with each other. The central values from the dijet sample measurement are the ones used in this analysis, while differences in the fake factors between the two samples are used as additional systematic uncertainties. The observed and predicted background event yields are compared in a ℓℓ′+jet enriched control region where events are required to have the same lepton selection and Z-mass requirement as in the nominal signal selection, the EmissT is required to be less than 25 GeV and the transverse mass of the lepton-ETmisssystemmWT =
q
2pℓTEmissT (1−cos∆φ) be less than 25 GeV, where pℓT is the transverse momentum of the third lepton and∆φis the opening angle between the third lepton and theETmissdirection in the transverse plane. In this region, a total of 204 events are observed in data with a SM expectation of 195 ±4(stat.)± 38(syst.) events. Good agreement is found between observed data and estimated background for various kinematical distributions, one example is shown in Fig. 2 for themZdistribution.
[GeV]
mZ
70 80 90 100 110 120
Events / 2 GeV
0 10 20 30 40 50 60 70
80 ATLASPreliminary Ldt=20.3 fb-1
∫
=8 TeV, s
All channels combined Data WZ ZZ ll’+jets
γ Z
+W/Z t t
stat.+syst.
σ
Figure 2: Dilepton invariant mass distribution in theℓℓ′+jets background control region. The uncertainty bands upon the expected background include both statistical and systematic uncertainties in the MC and the fake background estimation added in quadrature.
6 Systematic uncertainties
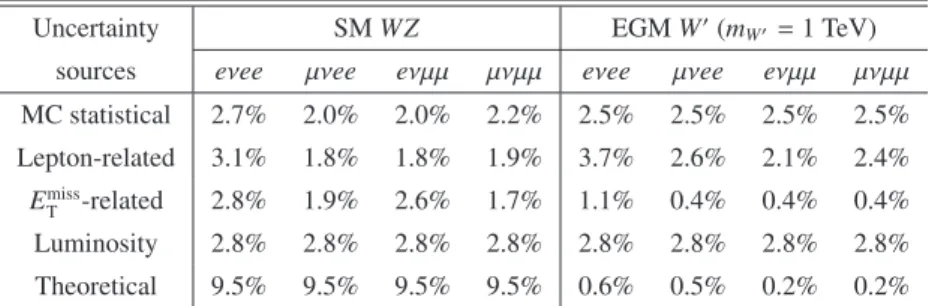
Relative uncertainties on the expected yields of the dominant WZbackground and the EGMW′ signal withmW′ =1 TeV in SR1 are shown in Table 2. These uncertainties are representative of the uncertainties found for other signal masses. The lepton-related uncertainty includes uncertainties from lepton trigger, identification, energy scale, energy resolution, isolation, and impact parameters. The uncertainties on the lepton momentum scale and resolution are also propagated to ETmisscalculation. Other EmissT -related uncertainties include uncertainties on energy deposits due to additional ppcollisions, energy deposits associated to reconstructed jets and energy deposits not associated to any reconstructed objects.
Cross section uncertainties for the dominant SM physics processes are computed via MCFM [45], which provides NLO QCD calculations for diboson production cross sections. The relative uncertainty due to higher order corrections to theWZcross sections is 5% [46]. The renormalization and factorization scales are varied by a factor of two relative to their nominal values. The resulting quadratic sum of the uncertainties in SR1 on the WZ, ZZ, and Zγ cross sections are found to be 6.9%, 4.3%, and 5.0%
respectively. PDF uncertainties are derived by comparing the predicted cross sections using CT10 and MSTW PDF as well as the CT10 eigenvector error PDF sets. The resulting uncertainties are 4.1%, 4.7%
and 3.2% for these three processes respectively.
Given that the SM background modeling suffers from low MC event counts in the tail of themWZ
distribution, an extrapolation method is devised to smoothen the predicted yields. The method consists in performing two independentχ2fits, one on theWZbackground in the region withmWZ > 500 GeV, and a second on the non-WZ backgrounds in the region with mWZ > 300 GeV, each with the power law function N(x) = c0xc1, where x is the mWZ invariant mass. The normalization parameter c0 is adjusted and set to the expected number of events for each of the two types of backgrounds. The non- WZ backgrounds are fitted jointly to gain from their combined statistical size, thus reducing the total uncertainty on the fit, which is computed via the function’s Hessian error matrix. Other fitting functions such as an exponential or more elaborate power law functions were tested, but their shapes were found to be within the uncertainties of the simple power law function given above. Hence, only the uncertainties on the simple power law function are considered, which dominate all other uncertainties in the mWZ range beyond mWZ = 800 GeV (e.g. the fit uncertainty reaches 50% on the total expected yields at mWZ =800 GeV and 400% atmWZ =1.6 TeV).
Additionally, the predicted shapes of themWZdistribution for the SMWZprocess byPOWHEG-BOXand the multi-leg generators SHERPAandMadGraph, as well as NLO generators such asMC@NLOare com- pared. The largest differences with respect to the POWHEG-BOX distribution are used as a systematic uncertainty on the predictedmWZ shape.
Uncertainty SMWZ EGMW′(mW′=1 TeV)
sources eνee µνee eνµµ µνµµ eνee µνee eνµµ µνµµ MC statistical 2.7% 2.0% 2.0% 2.2% 2.5% 2.5% 2.5% 2.5%
Lepton-related 3.1% 1.8% 1.8% 1.9% 3.7% 2.6% 2.1% 2.4%
EmissT -related 2.8% 1.9% 2.6% 1.7% 1.1% 0.4% 0.4% 0.4%
Luminosity 2.8% 2.8% 2.8% 2.8% 2.8% 2.8% 2.8% 2.8%
Theoretical 9.5% 9.5% 9.5% 9.5% 0.6% 0.5% 0.2% 0.2%
Table 2: Relative uncertainties of the expected yields for the SMWZbackground and the EGMW′signal withmW′ = 1 TeV in SR1. The renormalization and factorization scale, PDF uncertainties on fiducial cross-section are included under theoretical uncertainty for SMWZ background. For EGMW′signal, the theoretical uncertainty stands for the Scale and PDF uncertainty on its acceptance. Shape-related uncertainties are not included here. Similar uncertainties are found in SR2.
A procedure was developed to obtain the mWZ distribution for any givenmW′ mass point using a functional interpolation between the available mWZ signal templates. All systematic uncertainties are individually interpolated.
Theoretical uncertainties on the EGMW′ signal yields mainly come from the uncertainties on the signal acceptance times efficiency due to the PDF set used. Similar to the PDF uncertainty evaluation for the SM physics processes, the uncertainties on the signal A×ǫ are derived from the CT10 eigen- vector error sets and the difference between the predictions of the CT10 and MSTW PDF sets combined quadratically.
7 Results
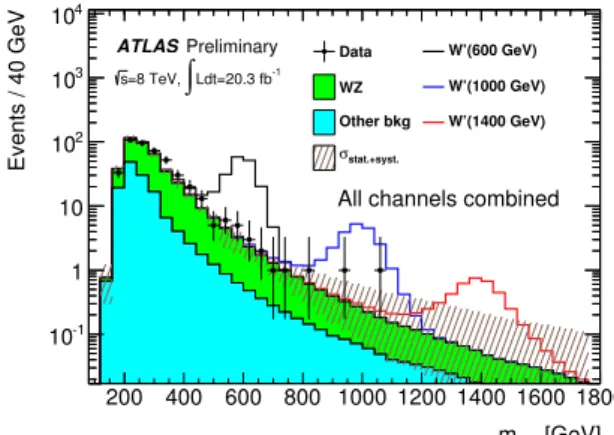
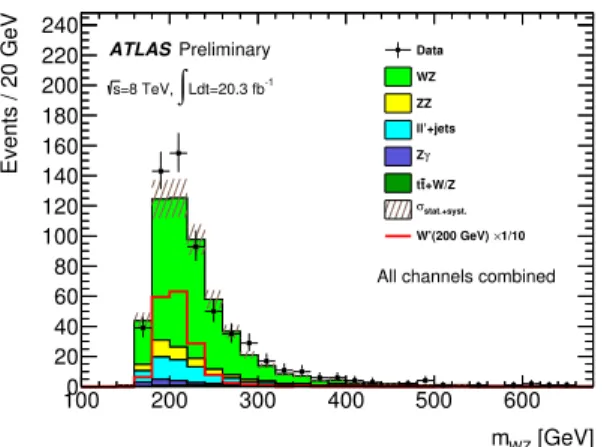
ThemWZspectrum in the two signal regions is scrutinized for data excesses. A total of 449WZcandidate events in SR1 are observed in data after applying all event selection criteria, to be compared with the SM prediction of 421±5(stat.)+56−39(syst.) events. The corresponding numbers in SR2 are 617 events selected in data and 563±5(stat.)+55−43(syst.) events expected from SM processes. ThemWZ distribution in SR1 is compared to the expected SM background distribution in Fig. 3, which combines all four lepton decay channels. The contributions from hypothetical EGMW′bosons with masses of 0.6, 1.0, and 1.4 TeV are also overlaid. The breakdown of the signal, backgrounds and observed data in SR1 are shown in Table 3 for each individual channel and also all four channels combined. ThemWZ distribution in SR2 is shown in Fig. 4.
[GeV]
mWZ
200 400 600 800 1000 1200 1400 1600 1800
Events / 40 GeV
10-1
1 10 102
103
104
ATLASPreliminary Ldt=20.3 fb-1
∫
=8 TeV, s
All channels combined
Data W’(600 GeV)
WZ W’(1000 GeV)
Other bkg W’(1400 GeV) stat.+syst.
σ
Figure 3: Observed and predicted mWZ distribution for events in SR1. An extrapolation of the back- grounds to the very high mass region has been carried out using a power law fitting for the SMWZand the sum of all other backgrounds separately. Predictions fromW′ samples with masses of 600 GeV, 1 TeV and 1.4 TeV are also shown, stacked on top of the expected backgrounds. The uncertainty bands upon the expected background include both statistical and systematic uncertainties in the MC and the fake background estimation added in quadrature.
ThemWZ distribution is used to build a log-likelihood ratio (LLR) test statistic [47]. Confidence lev- els for the signal plus background hypothesis (CLs+b) and background-only hypothesis (CLb) are com- puted by integrating the LLR distributions obtained from simulated pseudo-experiments using Poisson statistics.
To check the consistency between the observed data and expected SM backgrounds, the probability that a background fluctuation gives rise to an excess at least as large as that observed in data is computed and reported in Table 4 for the signal hypothesis of aW′ particle with mass from 200 GeV to 1 TeV.
[GeV]
mWZ
100 200 300 400 500 600
Events / 20 GeV
0 20 40 60 80 100 120 140 160 180 200 220 240
ATLASPreliminary Ldt=20.3 fb-1
∫
=8 TeV, s
All channels combined Data
WZ ZZ ll’+jets Zγ
+W/Z t t
stat.+syst.
σ
×1/10 W’(200 GeV)
Figure 4: Observed and predictedmWZ distribution for events in SR2. Predictions from aW′ sample with mass of 200 GeV is also shown. The W′ curve has been scaled by 1/10 for better display. The uncertainty bands upon the expected background include both statistical and systematic uncertainties in the MC and the fake background estimation added in quadrature.
eνee µνee eνµµ µνµµ combined
Backgrounds:
WZ 56.5±1.5±6.1 68.6±1.4±7.0 70.1±1.4±7.2 89.8±2.0±9.1 285±3±29 ZZ 8.7±0.1±0.9 8.7±0.2±0.8 11.7±0.2±1.3 11.6±0.2±1.1 40.7±0.4±3.9 Zγ 6.4±0.8±1.5 negl. 8.1±0.9±1.2 negl. 14.5±1.2±2.2 t¯t+W/Z 2.5±0.1±0.8 3.2±0.1±1.0 2.6±0.1±0.8 3.3±0.1±1.0 11.6±0.2±3.5 ℓℓ′+jets 12.7±1.0+8.9
−5.6 19±2+11−4 14±1+13−7 23±2+15−7 69±3+47−24 Sum of Backgrounds 87±2+11−9 100±2+13−8 107±2+15−11 128±3+18−12 421±5+56−39
Data 99 90 136 124 449
Signals:
W′→WZ(M(W′)=600 GeV) 42.0±1.2±2.1 48.3±1.3±2.4 46.5±1.3±2.3 52.9±1.4±2.6 189.7±2.6±9.5 W′→WZ(M(W′)=1000 GeV) 5.7±0.1±0.3 5.9±0.2±0.3 5.7±0.1±0.3 5.7±0.1±0.3 23.0±0.3±1.0 W′→WZ(M(W′)=1400 GeV) 1.1±0.1±0.1 1.1±0.1±0.1 1.0±0.1±0.1 1.0±0.1±0.1 4.2±0.2±0.2
Table 3: The estimated background yields, the observed number of data events, and the predicted signal yield for a set ofW′resonance masses in SR1.
The lowest local p-value probability is found to be 8% for the 375 GeV resonance mass hypothesis, equivalent to a 1.75σlocal excess, and that no significant excess is observed.
In the modified frequentist approach [48], the 95% excluded cross section is computed as the cross section for which CLs, defined as the ratio CLs+b/CLb, is equal to 0.05. The limits statistically combine all lepton decay channels as well as the two signal regions to maximize the sensitivity of the search.
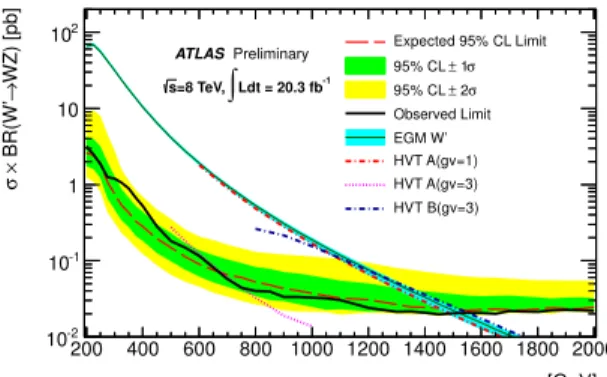
Figure 5 presents the 95% CL upper limits onσ(pp→W′)×BR(W′→WZ) as a function of the EGM W′mass together with the theoretical cross sections of the EGMW′and HVT benchmark models. Table 4 presents the expected and observed limits for a selected set of signal mass points as well as the EGMW′ signal acceptanceAand correction factorC. The acceptanceAis defined at particle level as the number of generated events found within the fiducial region divided by the total number of generated events.Cis defined as the number of reconstructed MC events passing the nominal selection requirements divided by the number of generated events at particle level within the fiducial region. The fiducial region selection criteria consist of the same kinematic cuts (lepton pT, lepton η, Z boson mass, EmissT , ∆y(W,Z) and
∆φ(ℓ,EmissT )) and lepton isolation requirements as in the nominal selections. Particle level refers to stable particles that are produced from the hard scattering or after the hadronization but before the interaction with the detector. Note thatA×C=A ×ǫ, whereAandǫare respectively the reconstructed acceptance
and efficiency. Table 5 presents the 95% CL expected and observed lower limits on the EGMW′ boson mass for each decay channel and their combination. The observed (expected) exclusion limit on the EGMW′mass is found to be 1.52 (1.49) TeV. The HVT resonances were found to have similar kinematic distributions to theW′. The corresponding observed (expected) limits for theA(gV =1),A(gV =3), and B(gV =3) HVT resonances [20] are 1.49 (1.45) TeV, 0.76 (0.69) TeV, and 1.56 (1.53) TeV respectively.
The HVT benchmark model curves are not shown for low resonance mass where the models do not apply.
[GeV]
mW’
200 400 600 800 1000 1200 1400 1600 1800 2000
WZ) [pb]→ BR(W’×σ
10-2
10-1
1 10
102 Expected 95% CL Limit
σ
± 1 95% CL
σ
± 2 95% CL Observed Limit EGM W’
HVT A(gv=1) HVT A(gv=3) HVT B(gv=3) ATLASPreliminary
Ldt = 20.3 fb-1
∫
=8 TeV, s
Figure 5: The observed 95% CL upper limits onσ(pp→W′)×BR(W′ →WZ) as a function of theW′ mass. The expected limits are also shown together with the±1 and±2 standard deviation uncertainty bands. Theoretical cross sections on the EGMW′ and the HVT benchmark models are also shown. The uncertainty band around the EGM W′ cross section line represents the theoretical uncertainty on the NNLO cross section calculation using ZWPROD [28].
mW′ Excludedσ×B[fb] SR1 SR2
p-value
(GeV) Expected Observed A/C A/C
200 2613 3182 0.025±0.001/0.75±0.05 0.135±0.003/0.57±0.02 0.36 400 281 526 0.311±0.005/0.63±0.01 0.0048±0.0005/3.3±0.4 0.094 600 90 115 0.426±0.006/0.68±0.01
not used
0.29
800 52 40 0.475±0.006/0.68±0.01 0.71
1000 38 33 0.505±0.007/0.68±0.01 0.59
1200 31 24 0.526±0.007/0.66±0.01 0.71
1400 25 21 0.530±0.007/0.66±0.01 0.81
1600 23 21 0.533±0.007/0.63±0.01 0.83
1800 23 21 0.544±0.007/0.60±0.01 0.82
2000 24 22 0.535±0.007/0.57±0.01 0.85
Table 4: The expected and observed 95% CL upper limits on the production cross section of narrow resonances decaying toWZas a function of their mass. The SR1 and SR2 fiducial acceptances at partical level (A) and correction factors (C) for a EGMW′as implemented inPYTHIAare also given. The mass points beyond 400 GeV in SR2 were not used in the limit setting phase due to their very low acceptances.
Errors shown are statistical. Thep-value, defined as 1-CLb, is also shown for each mass point in the last column.
8 Conclusion
A search for resonantWZdiboson production in the fully leptonic channel has been performed with the ATLAS detector, using 20.3 fb−1ofppcollision data collected at √
s=8 TeV at the LHC. No excess is
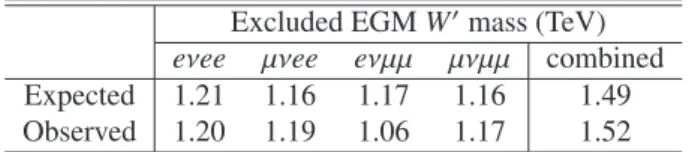
Excluded EGMW′mass (TeV) eνee µνee eνµµ µνµµ combined Expected 1.21 1.16 1.17 1.16 1.49 Observed 1.20 1.19 1.06 1.17 1.52
Table 5: 95% CL expected and observed mass limits in TeV for the EGMW′ boson in theeνee,eνµµ, µνee,µνµµchannels as well as the four channels combined.
found in data compared to the SM expectations. Stringent limits on the production cross section times WZbranching ratio were obtained for aW′arising from an extended gauge model decaying toWZas a function of the resonance mass. A corresponding observed (expected) mass limit of 1.52 (1.49) TeV is found for theW′.
References
[1] ATLAS Collaboration,Observation of a new particle in the search for the Standard Model Higgs boson with the ATLAS detector at the LHC, Phys. Lett.B716(2012) 1–29,arXiv:1207.7214 [hep-ex].
[2] CMS Collaboration,Observation of a new boson at a mass of 125 GeV with the CMS experiment at the LHC, Phys. Lett.B716(2012) 30–61,arXiv:1207.7235 [hep-ex].
[3] ATLAS Collaboration,Evidence for the spin-0 nature of the Higgs boson using ATLAS data, Phys.
Lett.B726(2013) 120–144,arXiv:1307.1432 [hep-ex].
[4] CMS Collaboration,Study of the Mass and Spin-Parity of the Higgs Boson Candidate Via Its Decays to Z Boson Pairs, Phys. Rev. Lett.110(2013) 081803,arXiv:1212.6639 [hep-ex].
[5] P. Langacker, R. W. Robinett, and J. L. Rosner,New Heavy Gauge Bosons in p p and pp¯ Collisions, Phys. Rev.D30(1984) 1470.
[6] N. Arkani-Hamed, A. G. Cohen, E. Katz, and A. E. Nelson,The littlest Higgs, JHEP07(2002) 034,arXiv:hep-ph/0206021.
[7] K. Lane and S. Mrenna,The Collider phenomenology of technihadrons in the technicolor straw man model, Phys. Rev.D67(2003) 115011,arXiv:hep-ph/0210299.
[8] E. Eichten and K. Lane,Low-scale technicolor at the Tevatron and LHC, Phys. Lett.B669(2008) 235–238,arXiv:0706.2339 [hep-ph].
[9] F. Sannino and K. Tuominen,Orientifold theory dynamics and symmetry breaking, Phys. Rev.
D71(2005) 051901,arXiv:hep-ph/0405209 [hep-ph].
[10] A. Belyaev et al.,Technicolor Walks at the LHC, Phys. Rev.D79(2009) 035006, arXiv:0809.0793 [hep-ph].
[11] K. Agashe, R. Contino, and A. Pomarol,The Minimal composite Higgs model, Nucl. Phys.B719 (2005) 165–187,arXiv:hep-ph/0412089 [hep-ph].
[12] G. Giudice, C. Grojean, A. Pomarol, and R. Rattazzi,The Strongly-Interacting Light Higgs, JHEP 0706(2007) 045,arXiv:hep-ph/0703164 [hep-ph].
[13] L. Randall and R. Sundrum,A large mass hierarchy from a small extra dimension, Phys. Rev. Lett.
83(1999) 3370–3373,arXiv:hep-ph/9905221.
[14] H. Davoudiasl, J. L. Hewett, and T. G. Rizzo,Bulk gauge fields in the Randall-Sundrum model, Phys. Lett.B473(2000) 43–49,arXiv:hep-ph/9911262.
[15] C. Csaki, C. Grojean, H. Murayama, L. Pilo, and J. Terning,Gauge theories on an interval:
Unitarity without a Higgs, Phys. Rev.D69(2004) 055006,arXiv:hep-ph/0305237 [hep-ph].
[16] G. Altarelli, B. Mele, and M. Ruiz-Altaba,Searching for new Heavy Vector Bosons in pp¯ Colliders, Z. Phys.C45(1989) 109.
[17] K. Babu, C. F. Kolda, and J. March-Russell,Leptophobic U(1) s and the R(b) - R(c) crisis, Phys.
Rev.D54(1996) 4635–4647,arXiv:hep-ph/9603212 [hep-ph].
[18] T. G. Rizzo,Gauge kinetic mixing and leptophobic Z′in E(6) and SO(10), Phys. Rev.D59(1999) 015020,arXiv:hep-ph/9806397 [hep-ph].
[19] J. Hewett and T. Rizzo,Dissecting the Wjj Anomaly: Diagnostic Tests of a Leptophobic Z’, arXiv:1106.0294 [hep-ph].
[20] D. Pappadopulo, A. Thamm, R. Torre, and A. Wulzer,Heavy Vector Triplets: Bridging Theory and Data,arXiv:1402.4431 [hep-ph].
[21] ATLAS Collaboration,Search for resonant WZ production in the WZ →ℓνℓ′ℓ′channel in √ s=7 TeV pp collisions with the ATLAS detector, Phys. Rev.D85(2012) 112012,arXiv:1204.1648 [hep-ex].
[22] ATLAS Collaboration,Search for resonant diboson production in the lvjj decay channels with the ATLAS detector, Phys. Rev.D87(2013) 112006,arXiv:1305.0125 [hep-ex].
[23] CMS Collaboration,Search for a W′or Techni-ρDecaying into WZ in pp Collisions at √ s=7 TeV, Phys. Rev. Lett.109(2012) 141801,arXiv:1206.0433 [hep-ex].
[24] ATLAS Collaboration,The ATLAS Experiment at the CERN Large Hadron Collider, JINST3 (2008) S08003.
[25] ATLAS Collaboration,Improved luminosity determination in pp collisions at √s=7 TeV using the ATLAS detector at the LHC, Eur. Phys. J.C73(2013) 2518,arXiv:1302.4393 [hep-ex].
[26] T. Sjostrand, S. Mrenna, and P. Z. Skands,A Brief Introduction to PYTHIA 8.1, Comput. Phys.
Commun.178(2008) 852–867,arXiv:0710.3820 [hep-ph].
[27] A. Martin, W. Stirling, R. Thorne, and G. Watt,Parton distributions for the LHC, Eur. Phys. J.
C63(2009) 189–285,arXiv:0901.0002 [hep-ph].
[28] R. Hamberg, W. van Neerven, and T. Matsuura,A Complete calculation of the orderα−s2 correction to the Drell-Yan K factor, Nucl. Phys.B359(1991) 343–405.
[29] ATLAS Collaboration,The ATLAS Simulation Infrastructure, Eur. Phys. J.C70(2010) 823–874, arXiv:1005.4568 [physics.ins-det].
[30] S. Agostinelli et al. Nucl. Inst. Meth.A506(2003) 250.
[31] L. Hung-Liang, M. Guzzi, J. Huston, Z. Li, P. M. Nadolsky, J. Pumplin, and C.-P. Yuan,New parton distributions for collider physics, Phys. Rev.D82(2010) 074024,arXiv:1007.2241 [hep-ph].
[32] P. M. Nadolsky, H.-L. Lai, Q.-H. Cao, J. Huston, J. Pumplin, et al.,Implications of CTEQ global analysis for collider observables, Phys. Rev.D78(2008) 013004,arXiv:0802.0007 [hep-ph].
[33] S. Alioli, P. Nason, C. Oleari, and E. Re,A general framework for implementing NLO calculations in shower Monte Carlo programs: the POWHEG BOX, JHEP1006(2010) 043,
arXiv:1002.2581 [hep-ph].
[34] J. Alwall, M. Herquet, F. Maltoni, O. Mattelaer, and T. Stelzer,MadGraph 5 : Going Beyond, JHEP1106(2011) 128,arXiv:1106.0522 [hep-ph].
[35] J. Archibald et al.,Simulation of photon-photon interactions in hadron collisions with SHERPA, Nucl. Phys. Proc. Suppl.179-180(2008) 218–225.
[36] M. L. Mangano, M. Moretti, F. Piccinini, R. Pittau, and A. D. Polosa,ALPGEN, a generator for hard multiparton processes in hadronic collisions, JHEP0307(2003) 001,
arXiv:hep-ph/0206293 [hep-ph].
[37] S. Frixione and B. R. Webber,Matching NLO QCD computations and parton shower simulations, JHEP0206(2002) 029,arXiv:hep-ph/0204244 [hep-ph].
[38] B. P. Kersevan and E. Richter-Was,The Monte Carlo event generator AcerMC versions 2.0 to 3.8 with interfaces to PYTHIA 6.4, HERWIG 6.5 and ARIADNE 4.1, Comput. Phys. Commun.184 (2013) 919–985,arXiv:hep-ph/0405247 [hep-ph].
[39] G. Corcella et al.,HERWIG 6: An event generator for hadron emission reactions with interfering gluons (including supersymmetric processes), JHEP01(2001) 010.
[40] J. Butterworth, J. R. Forshaw, and M. Seymour,Multiparton interactions in photoproduction at HERA, Z. Phys.C72(1996) 637–646,arXiv:hep-ph/9601371 [hep-ph].
[41] ATLAS Collaboration,Electron performance measurements with the ATLAS detector using the 2010 LHC proton-proton collision data, Eur. Phys. JC72(2012) 1909.
[42] M. Cacciari, G. P. Salam, and G. Soyez,The Anti-k(t) jet clustering algorithm, JHEP0804(2008) 063,arXiv:0802.1189 [hep-ph].
[43] ALEPH Collaboration, DELPHI Collaboration, L3 Collaboration, OPAL Collaboration, SLD Collaboration, LEP Electroweak Working Group, SLD Electroweak Group, SLD Heavy Flavour Group Collaboration, S. Schael et al.,Precision electroweak measurements on the Z resonance, Phys.Rept.427(2006) 257–454,arXiv:hep-ex/0509008 [hep-ex].
[44] CDF Collaboration, D0 Collaboration, T. Aaltonen et al.,Combination of CDF and D0 W-Boson Mass Measurements, Phys. Rev.D88(2013) 052018,arXiv:hep-ex/13077627 [hep-ex].
[45] J. M. Campbell, R. K. Ellis, and C. Williams,Vector boson pair production at the LHC, JHEP 1107(2011) 018,arXiv:1105.0020 [hep-ph].
[46] F. Campanario and S. Sapeta,WZ production beyond NLO for high-pTobservables, Phys. Lett.
B718(2012) 100–104,arXiv:1209.4595 [hep-ph].
[47] M. G. Kendall and A. Stuart,The Advanced Theory of Statistics, Charles Griffin and Company Limited, London, 1967.
[48] A. L. Read,Presentation of search results: The CL(s) technique, J. Phys.G28(2002) 2693–2704.
A Auxiliary material
q
q¯′
W
Z W′
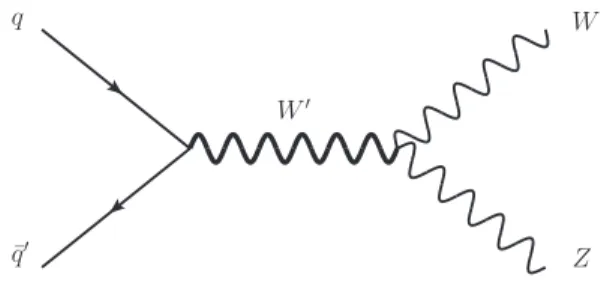
Figure 6: Feynman diagram forW′production at LHC.
eνee µνee eνµµ µνµµ combined
Process channel channel channel channel
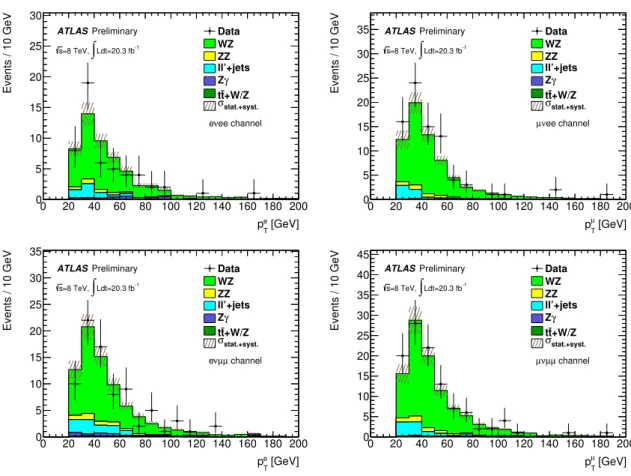
WZ 41.7±1.3±3.9 57.5±1.3±4.8 59.1±1.3±4.9 82.7±1.9±6.9 241±3±20 ZZ 3.2±0.1±0.4 4.0±0.1±0.4 4.8±0.1±0.6 5.6±0.1±0.5 17.6±0.2±1.7 Zγ 2.1±0.5±0.7 negl. 3.0±0.6±0.5 0.1±0.1±0.1 5.2±0.8±1.0 tt¯+W/Z 0.7±0.1±0.2 0.9±0.1±0.3 0.9±0.1±0.3 1.3±0.1±0.4 3.8±0.2±1.2 ℓℓ′+jets (data-driven) 5.3±0.7±2.7 5.4±1.0±2.7 10.1±0.9±5.1 9.8±1.2±4.9 31±2±15 Sum of Backgrounds 53.0±1.6±5.0 67.8±1.6±5.6 77.9±1.6±7.2 99.5±2.3±8.6 299±4±26
Data 53 81 82 107 323
Table 6: Event yields in the SM WZ control region for the eνee, µνee, eνµµ, µνµµ channel and all channels combined. Both the statistical and systematic uncertainties are given.
eνee µνee eνµµ µνµµ combined
Process channel channel channel channel
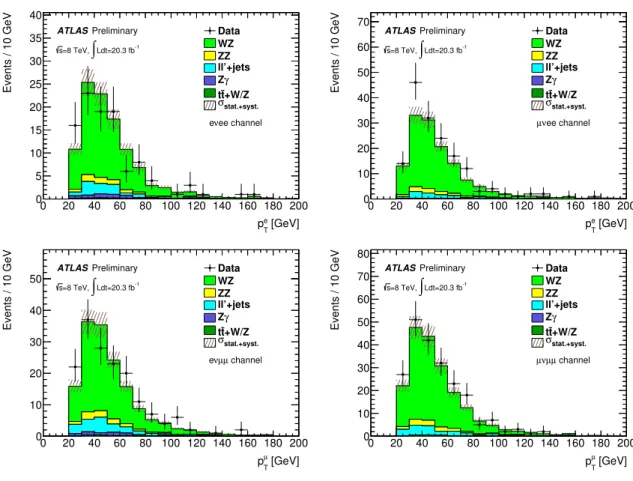
WZ 82.5±1.8±7.5 104.5±1.7±8.7 104.0±1.7±8.7 140±3±12 430±4±35 ZZ 7.5±0.1±0.9 10.7±0.2±0.9 9.2±0.2±1.1 15.0±0.2±1.2 42.4±0.4±3.8 Zγ 7.4±0.9±1.5 negl. 8.5±0.9±1.5 0.2±0.1±0.1 16.1±1.3±2.0 t¯t+W/Z 1.7±0.1±0.5 2.1±0.1±0.6 2.1±0.1±0.7 2.6±0.1±0.8 8.5±0.2±2.6 ℓℓ′+jets (data-driven) 13.3±1.1+7.5−5.4 13.0±1.5+6.8−2.9 17±1+13−6 22±2+13−7 65±3+40−21 Sum of Backgrounds 112±2+11−10 130±2+11−9 141±2+16−11 179±3+18−14 563±5+55−43
Data 121 165 151 180 617
W′(m=200 GeV) 317±20±22 402±21±28 426±23±30 565±26±40 1710±45±120
Table 7: Event yields in SR2 for the eνee,µνee,eνµµ, µνµµchannel and all channels combined. Both statistical and systematic uncertainties are shown for the backgrounds.