ATLAS-CONF-2016-023 16May2016
LHCTOP NOTE
ATLAS-CONF-2016-023 CMS PAS TOP-15-019
May 16, 2016
Combination of cross-section measurements for associated production of a single top-quark and a W boson at √
s = 8 TeV with the ATLAS and CMS experiments
The ATLAS and CMS Collaborations
1Abstract
A combination of cross-section measurements for the associated production of a top quark and a W boson in proton–proton collisions at
√s
=8 TeV by the ATLAS and CMS experiments is presented. The two measurements are based on integrated luminosities of 20.3 fb
−1and 12.2 fb
−1, respectively. The combined production cross-section of a single top quark and a W boson is determined as 23.1
±1.1 (stat.)
±3.3 (syst.)
±0.8 (lumi.) pb
=23.1
±3.6 pb, in agreement with the NLO+NNLL expectation.
1Work within the LHC top physics working group (LHC-TOP-WG).
More information at http://twiki.cern.ch/twiki/bin/view/LHCPhysics/LHCTopWG.
c
Copyright 2016 CERN for the benefit of the ATLAS and CMS Collaborations.
Reproduction of this article or parts of it is allowed as specified in the CC-BY-3.0 license.
1 Introduction
Single top-quark production at hadron colliders mostly proceeds, according to the standard model (SM) prediction, via three mechanisms that can be defined at leading order (LO): the t-channel, the s-channel and the production of a single top quark in association with a W boson (Wt-channel). The Wt-channel process studied here is the second-most abundant single top-quark production mechanism at the LHC, after t-channel production. The study of single top-quark processes not only provides a stringent test of SM predictions, but also allows for physics beyond the SM (BSM) to be probed. In particular, each of the three single top-quark channels is sensitive to di
fferent new physics mechanisms [1–9]. In the Wt-channel, both the top quark and the W boson are present in the final state, and a measurement of the Wt production cross-section is sensitive to BSM physics which modifies the Wtb interaction. The measurement of single top-quark production cross-sections allows for the determination of the magnitude of the Cabibbo–Kobayashi–Maskawa (CKM) matrix element V
tb, assuming that the production and top- quark decay through vertices involving the CKM matrix elements V
tsand V
tdare small. The cross- section is proportional to the square of
|f
LVV
tb|[10, 11], where f
LVis the left-handed vector-coupling form factor. No assumption about the number of quark generations or unitarity of the CKM matrix is required [1,12,13], thus the determination of
|Vtb|in the Wt-channel provides complementary information with respect to the analogous measurement in the t-channel. The Wt final state is also sensitive to singly produced new particles such as a vector-like quark B [7] or an excited quark b
∗[9, 14, 15]. The Wt process itself is also a background to Supersymmetry [16–19] and Higgs boson [20–23] searches.
Because of its low cross-section at
√s
=1.96 TeV, this process has not been observed at the Tevatron.
Evidence for Wt production was reported by ATLAS [24] and CMS [25] in proton–proton (pp) collisions at
√s
=7 TeV. The observation of Wt production in pp collisions at
√s
=8 TeV was reported by CMS using 12.2 fb
−1fb
−1of data [26] and a more precise cross-section measurement was reported by ATLAS based on 20.3 fb
−1fb
−1of data [27]. This note reports the combination of the 8 TeV measurements by ATLAS and CMS. It supersedes a previous combination [28] of the CMS result and a preliminary ATLAS measurement [29].
The theoretical prediction for the Wt production cross-section in pp collisions at
√s
=8 TeV for a top-quark mass of m
t =172.5 GeV, computed at next-to-leading order (NLO) [30–32] in QCD with resummation of next-to-next-to-leading soft gluon terms (NNLL), is [33, 34]:
σth.Wt=
22.4
±0.6 (scale)
±1.4 (PDF) pb
.(1) In this calculation, the uncertainty on the theoretical cross-section accounts for the variation of the renor- malisation and factorisation scales between m
t/2 and 2mtand for the parton distribution function (PDF) uncertainties (using the 90% confidence level uncertainties of the MSTW2008 next-to-next-to leading order PDF set [35, 36]).
This note is organised as follows: the ATLAS and CMS results are presented in Section 2. The combination methodology is given in Section 3 and the treatment of systematic uncertainties is given in Section 4. The combined cross-section is presented in Section 5. The extraction of the CKM matrix element
|Vtb|is presented in Section 6. Finally, a summary is presented in Section 7.
2 The ATLAS and CMS Wt cross-section measurements at 8 TeV
The ATLAS and CMS analyses [26, 27] use similar approaches to measure the Wt production cross- section. Both experiments select dilepton (ee, eµ,
µµ) events containing one or two jets, use a boosteddecision tree (BDT) [37–39] to separate the signal from the background, and determine the cross-section in a likelihood fit to data. Both experiments simulate the signal using the Powheg-Box generator [40]
with the diagram removal (DR) [41] scheme to remove overlap with t¯ t production. ATLAS also uses the
P
owheg-B
oxgenerator to simulate top-quark pair background events, while CMS uses Madgraph [42].
The cross-section is measured assuming a top-quark mass of 172.5 GeV. ATLAS uses the CT10 PDF set [43], while CMS uses the CTEQ6.6M PDF set [44]. The largest background to this event signature is from top-quark pair production, with smaller backgrounds from diboson, Z
+jets and events with non-prompt or mis-reconstructed leptons.
ATLAS measures the Wt production cross-section at
√s
=8 TeV [27] in the dilepton final state using a data sample corresponding to an integrated luminosity of 20.3 fb
−1. Events containing exactly two opposite-sign leptons and one or two jets are selected. At least one of the jets must be identified as containing a b quark. Electrons must have transverse energy E
T>25 GeV and pseudorapidity
|η|<2.47 (excluding the transition region 1.37
< |η| <1.52), and muons must have transverse momentum p
T >25 GeV and
|η|<2.5. Isolation requirements are applied to the two leptons. Jets are reconstructed using the anti-k
talgorithm [45, 46] with a distance parameter R
=0.4. Selected jets must have p
T >20 GeV and
|η| <2.5. Jets are identified as orginating from b-hadrons using a combination of multivariate algorithms which combine spatial and lifetime information from secondary vertices of tracks associated with the jets. Events with same-flavour leptons (ee or
µµ) are rejected if the dilepton invariant mass,m
``, falls between 81 GeV and 101 GeV to reject Z boson decays. Moreover, the missing transverse energy, E
missT, defined as the magnitude of the missing transverse momentum is required to be E
missT >40 GeV, increased to E
Tmiss >70 GeV for m
`` <120 GeV to reject Z
+jets. Events with di
fferent-flavour leptons are rejected if E
missT <20 GeV (50 GeV if m
eµ <80 GeV). Events are categorised according to the jet- and b-tagged jet multiplicity. The one-jet region has the largest signal contribution while events with two jets and one or two b-jets are dominated by the t¯ t background. In addition to these three regions, which are included in the signal extraction fit, two regions with one or two jets and zero b-jets are used to validate the modelling of the other backgrounds. The total number of data events in the three regions with b- tagged jets is about 19,000, of which about 1,700 events are expected to be from Wt-production. The Wt signal is separated from the dominant top-quark pair production background using a BDT discriminator, trained separately in each of the regions. The cross-section is determined in a profile likelihood fit to the BDT classifier, using the RooStats software [47, 48], exploiting the three regions with b-tagged jets.
Systematic uncertainties are treated as nuisance parameters in the fit. The measured cross-section is
σWt =23.0
±1.3 (stat.)
+3.2−3.5(syst.)
±1.1(lumi.) pb
=23.0
+3.6−3.9pb. (2) The observed (expected) significance of the signal compared to the background-only hypothesis is 7.7 (6.9) standard deviations, obtained using an asymptotic approximation [49]. From the cross-section measurement,
|f
LVV
tb|=1.01
±0.10 is obtained.
CMS measures the Wt production cross-section at
√s
=8 TeV [26] in the dilepton final state using a data sample corresponding to 12.2 fb
−1. Events containing exactly two opposite-sign isolated leptons and one or two jets, at least one of which is b-tagged, are selected. Leptons must have p
T >20 GeV and electrons (muons) are required to have
|η|<2.5 (2.4). Events with a ee or
µµinvariant mass between 81 and 101 GeV are vetoed to reject Z boson decays. Jets are reconstructed using the anti-k
talgorithm with a distance parameter R
=0.5. Selected jets are required to have p
T >30 GeV and
|η|<2.4. The missing transverse energy is required to be greater than 50 GeV. Events are separated into a signal-enhanced region with exactly one jet which is b-tagged and two background-enriched two-jet control regions to constrain the t¯ t-background: one where exactly one jet is b-tagged and the other where both are b-tagged.
In total, about 30,000 events are selected in data, with 2,500 expected signal events. The Wt signal
is separated from the background with a BDT discriminator. The most powerful variables providing
separation of Wt from t¯ t are those involving loose jets, which are low-p
T-jets that have p
T >20 GeV
and
|η| <4.9 but fail the nominal jet requirements. A profile-likelihood method is used to determine
the signal cross-section and its uncertainty. The cross-section is determined in a simultaneous fit to the
BDT distributions in the signal and control regions. The nuisance parameters associated with the main
systematic uncertainty contributions affecting the rate and shape of the BDT distribution of the signal and background processes are constrained from data. Nuisance parameters associated to luminosity and theory uncertainties are not profiled. The measured cross-section is
σWt =
23.4
±5.4 pb. (3)
The significance is evaluated from pseudo-datasets using a test statistic that is asymptotically equiv- alent to the log-likelihood-ratio used by ATLAS. The observed significance of the measurement is 6.1 standard deviations with 5.4 standard deviations expected. From the cross-section measurement,
|
f
LVV
tb|=1.03
±0.13 is obtained.
3 Combination methodology
As in previous combinations [28,50], the results here are combined using the best linear unbiased estima- tor (BLUE) method [51, 52]. The BLUE method is applied iteratively in order to reduce a possible bias arising from the systematic uncertainty dependence on the cross-section central value [28, 50, 53–55].
Convergence is reached when the central value and total uncertainty change by less than 1% compared to the previous iteration.
Similar to the input measurements, the cross-section combination is performed assuming m
t =172.5 GeV. No top-quark mass uncertainty is included in the cross-section combination. This uncer- tainty and the theoretical cross-section uncertainties are included in the
|Vtb|extraction, see Section 6.
4 Uncertainties
The 2012 LHC run allowed the collection of a dataset containing many thousands of Wt events. In this regime the measurement precision is limited by the understanding of sources of systematic uncertainties involved in this measurement.
The list of uncertainty sources and their assumed correlations are presented in Table 1. The contri- bution from each individual systematic uncertainty is evaluated by ATLAS by fixing the corresponding nuisance parameter at its postfit value
±the postfit uncertainty, and performing the fit again. The contri- bution of this uncertainty is given by the di
fference between the resulting central value and the nominal central value. At CMS, each contribution is evaluated by comparing the uncertainty in the nominal profile-likelihood fit to the uncertainty in the fit when fixing this nuisance parameter to its central value, subtracting the two values in quadrature. Using this method for the ATLAS analysis gives consistent uncertainty values. In the measurement by ATLAS, all systematic uncertainties are included as nuisance parameters in the fit while for CMS, the theory modeling uncertainties described below are evaluated externally.
The following sources of uncertainty are considered:
Data statistics:
uncertainty due to the limited size of the data sample. This uncertainty is considered uncorrelated between ATLAS and CMS.
Simulation statistics:
uncertainty due to the limited size of the simulation samples. This uncertainty is considered uncorrelated between ATLAS and CMS.
Luminosity:
uncertainty on the measured integrated luminosity as determined by the individual experi-
ments using methods described in Refs. [56, 57]. It a
ffects both signal and background yields determina-
tion. The luminosity uncertainty has a component that is correlated between ATLAS and CMS, arising
from the knowledge of the beam currents in the LHC accelerator, and an uncorrelated component. These
components are 2.5% and 1.1% for ATLAS and 1.5% and 2.1% for CMS. From these, a correlation
coefficient of
ρ=0.31 is obtained.
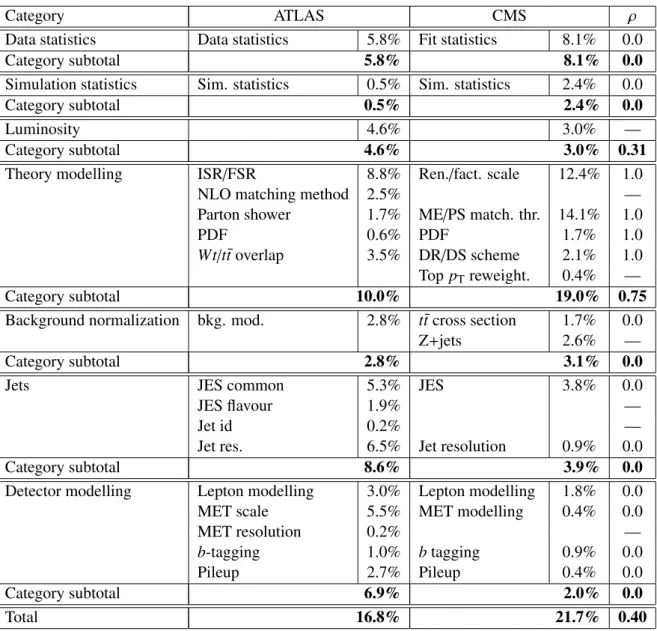
Table 1: Uncertainty components, their magnitude (relative to the individual measurements) and corre- lation (ρ) between the ATLAS and CMS measurements. Uncertainties in the same row can be compared between experiments as detailed in the text and in Refs. [26, 27]. The naming conventions follow those from the corresponding experiments.
Category ATLAS CMS
ρData statistics Data statistics 5.8% Fit statistics 8.1% 0.0
Category subtotal
5.8% 8.1% 0.0Simulation statistics Sim. statistics 0.5% Sim. statistics 2.4% 0.0
Category subtotal
0.5% 2.4% 0.0Luminosity 4.6% 3.0% —
Category subtotal
4.6% 3.0% 0.31Theory modelling ISR
/FSR 8.8% Ren.
/fact. scale 12.4% 1.0
NLO matching method 2.5% —
Parton shower 1.7% ME/PS match. thr. 14.1% 1.0
PDF 0.6% PDF 1.7% 1.0
Wt
/t¯ t overlap 3.5% DR/DS scheme 2.1% 1.0 Top p
Treweight. 0.4% —
Category subtotal
10.0% 19.0% 0.75Background normalization bkg. mod. 2.8% t¯ t cross section 1.7% 0.0
Z
+jets 2.6% —
Category subtotal
2.8% 3.1% 0.0Jets JES common 5.3% JES 3.8% 0.0
JES flavour 1.9% —
Jet id 0.2% —
Jet res. 6.5% Jet resolution 0.9% 0.0
Category subtotal
8.6% 3.9% 0.0Detector modelling Lepton modelling 3.0% Lepton modelling 1.8% 0.0
MET scale 5.5% MET modelling 0.4% 0.0
MET resolution 0.2% —
b-tagging 1.0% b tagging 0.9% 0.0
Pileup 2.7% Pileup 0.4% 0.0
Category subtotal
6.9% 2.0% 0.0Total
16.8% 21.7% 0.40Theory modelling:
the uncertainty in the modelling of signal and the top-quark pair background. This includes initial- and final-state radiation (ISR
/FSR), NLO matching method, parton-shower (PS) and PDF uncertainties and the uncertainty due to the Wt top-quark pair interference treatment as discussed below.
•
The uncertainty on ISR/FSR for ATLAS is considered to be correlated with the renormalisa- tion
/factorisation scale for CMS. The ATLAS uncertainty due to ISR and FSR is derived from a study of additional jet activity in t¯ t events at
√s
=7 TeV [58, 59] and is applied to both signal and top-quark pair background samples. The renormalisation and factorisation scales uncertainty in CMS also accounts for uncertainties in the Wt and t¯ t generators. It is estimated by varying the two scales consistently in the Wt and t¯ t samples to half or double of the nominal value. This uncertainty is larger than the sum in quadrature of the two individual contributions due to Wt and t¯ t, determined by varying the scales for the two processes independently. The CMS scale uncer- tainty is larger than the ATLAS ISR
/FSR uncertainty due to the inclusion of low- p
T-jets in the list of BDT variables. It was verified in a previous study that though the methods are different, they mostly address the same uncertainty, hence this uncertainty is considered correlated [50].
•
ATLAS includes an uncertainty to account for different NLO matching methods. This is evaluated for the Wt and t¯ t generators by comparing the P
owheg-B
oxand MC@NLO [60, 61] generators interfaced with H
erwig[62] (with J
immy[63] for underlying event modelling). This uncertainty is not considered in the CMS analysis, where the uncertainty on the scheme to remove overlap with t¯ t is assumed to be the dominant generator uncertainty (see below). The effect of dropping this uncertainty from the ATLAS measurement on the combination is evaluated in Section 5.1, it is very small.
•
ATLAS includes an uncertainty for parton-shower modelling in simulated Wt and t¯ t events, eval- uated by comparing the Powheg-Box generator interfaced with Pythia [64] and Herwig, respec- tively. This uncertainty is small for ATLAS due to the inclusion of both P
ythiaand H
erwigevents in the BDT training. For CMS, part of this uncertainty is accounted for in JES by comparing P
ythiaand Herwig showering programs. Moreover for the top-quark pair background, this is evaluated in the matrix element
/parton shower (ME
/PS) matching threshold uncertainty. CMS estimates this uncertainty using simulated samples with the values of the ME
/PS matching thresholds and renor- malisation/factorisation scale doubled and halved from their respective initial values of 20 GeV and m
2t +Pp
2T(where the sum is over all additional final state partons). This uncertainty is larger for CMS due to the inclusion of low- p
T-jets in the BDT variables. This uncertainty is considered correlated between ATLAS and CMS. The result does not depend significantly on this correlation assumption, see Section 5.1.
•
The PDF uncertainty is evaluated following the PDF4LHC procedure [65] and is considered cor- related between ATLAS and CMS.
•
Associated Wt production interferes with top-quark pair production at NLO [41, 66, 67]. This is
dealt with in both ATLAS and CMS by comparing two simulation approaches: diagram subtrac-
tion [12, 41] (DS), and diagram removal [41] (DR). In the DS approach, the diagrams with two
on-shell top quarks are subtracted in the amplitude evaluation. In this way interference terms are
not included in the simulation. In the DR approach, diagrams with two on-shell top quarks are
removed from the amplitudes. This approach accounts for the interference term, but is not gauge-
invariant. The DR approach is the default, and the DS approach is used to evaluate this systematic
uncertainty. This uncertainty is considered correlated between the two experiments.
•
For CMS, the small uncertainty on the modelling of the top-quark transverse momentum is also included. This is evaluated based on a model of the di
fference between the top-quark transverse momentum in t¯ t events between data and simulation [68, 69]. For ATLAS, modelling uncertainties for the top-quark transverse momentum in t¯ t events [70] are taken into account in the parton shower uncertainty in table 1, and are found to be small.
Note that CMS also reports an uncertainty due to m
twhich propagates into an uncertainty on the measured Wt cross-section of 9.4%, corresponding to an assumed m
tuncertainty of 2 GeV [26]. This contribution was dropped in the combination, consistent with the treatment in the t¯ t cross-section com- bination [71]. The measured cross-section value is quoted at a nominal m
tvalue of 172.5 GeV. The top- quark mass uncertainty is included in the extraction of the CKM matrix element
|Vtb|. An uncertaintycontribution due to the spin correlation uncertainty in t¯ t of 0.1% is also reported in the CMS measure- ment [26], evaluated with t¯ t simulation samples with and without spin correlation. This uncertainty was not included for the combination since spin correlation has been observed at the level expected in the SM within uncertainties [72, 73].
Background normalisation:
the uncertainty in the modelling of the background normalisation. This includes for both experiments the uncertainty on the cross-section predictions for top-quark pair pro- duction. For ATLAS, the small uncertainties on diboson and Z
+jets backgrounds and the uncertaintyon the data-driven background from non-prompt and mis-identified leptons are included as well. For CMS, the data-driven Z
+jets background normalisation uncertainty is also included. These uncertainties are considered uncorrelated because they are either data-driven or constrained in the fit to data by both experiments.
Jets:
uncertainty in the modelling of the jet identification, jet energy scale (JES) and jet energy resolu- tion. For ATLAS, the JES uncertainty is split into components representing the systematic uncertainties of the in-situ techniques [74, 75]. They are categorised as modelling, detector and statistical compo- nents (JES common), pileup dependence and flavour dependence. The detector modelling component is constrained in the fit to data. The jet p
Tthreshold is lower for ATLAS, hence the uncertainty on the jet energy resolution is large for ATLAS due to anti-correlation of this uncertainty between different jet multiplicities. For CMS, the JES uncertainty [76] is not separated into components in the analysis and is constrained to data in the profile likelihood fit, hence it is considered uncorrelated between ATLAS and CMS. The result is stable against variations of this correlation as documented in Section 5.1.
Detector modelling:
the uncertainty in the modelling of leptons, missing transverse energy and b tag- ging. It includes the sources described below.
•
The lepton modelling uncertainty (energy scale and resolution, reconstruction and trigger e
fficien- cies) is considered uncorrelated between ATLAS [77, 78] and CMS [79, 80] since it is determined from data.
•
ATLAS includes separate uncertainties for the scale and resolution uncertainty components of E
missT[81]. CMS includes a E
missTmodelling uncertainty [79, 80]. This uncertainty is smaller for CMS due to the use of low- p
T-jets, which allow this uncertainty to be constrained in the fit to data.
This uncertainty is considered uncorrelated between ATLAS and CMS.
•
For ATLAS, the b-tagging modelling uncertainty is separated into b-quark, c-quark and light quark components [82–84]. For CMS, the average b-tagging efficiency is constrained from control sam- ples in data within the same fit procedure used to perform the signal extraction [85]. For both experiments, the quoted b-tagging uncertainty estimates the uncertainty due to the possible extra mismodelling in simulation of the b-tagging efficiency dependency on the jet p
Tand
ηthat is not constrained from data.
Since it is constrained from data, the b-tagging uncertainty is considered uncorrelated between
ATLAS and CMS. It has been checked that the combination is stable against possible variations of this assumption (see Section 5.1).
•
The uncertainty due to modelling of pileup is based on data and is considered uncorrelated between ATLAS and CMS.
The total uncertainty in Table 1 (16.8% for ATLAS and 21.7% for CMS) is given by the sum in quadrature of the individual components. This di
ffers slightly from the total uncertainty in Eqs. 2 for ATLAS (
+−1716%) and 3 for CMS (±23%) due to the symmetrisation of uncertainties. Also, in this note m
tand spin correlation uncertainties for CMS have been dropped, as discussed above.
5 Result
The combined result is:
σWt=
23.1
±1.1 (stat.)
±3.3 (syst.)
±0.8 (lumi.) pb
=23.1
±3.6 pb. (4) The iterative procedure converged after two iterations. The overall correlation of the ATLAS and CMS measurements is
ρ =0.40. The weights of the ATLAS and CMS measurements in the combination are 0.70 and 0.30, respectively. The
χ2/ndof of the combination is 0.01, corresponding to ap-value of 0.94.
The pull of the ATLAS and CMS measurements with respect to the combination are
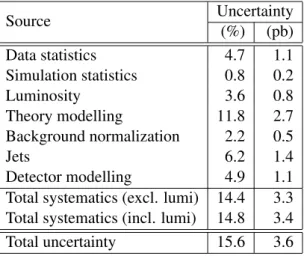
−0.08 and 0.08, respectively. These values are small because the central values of the individual measurements are close to each other. The contribution of each uncertainty category to the combined cross-section uncertainty is shown in Table 2. The theory uncertainty gives the dominant contribution to the total uncertainty. A breakdown of the individual theory uncertainty components in the combination is given in Table 3.
Table 2: Contribution of each uncertainty category to the combined cross-section uncertainty.
Source Uncertainty
(%) (pb)
Data statistics 4.7 1.1
Simulation statistics 0.8 0.2
Luminosity 3.6 0.8
Theory modelling 11.8 2.7
Background normalization 2.2 0.5
Jets 6.2 1.4
Detector modelling 4.9 1.1
Total systematics (excl. lumi) 14.4 3.3 Total systematics (incl. lumi) 14.8 3.4
Total uncertainty 15.6 3.6
Compared with the precision of the original analyses, 17% for ATLAS and 23% for CMS, the com-
bination results in an improved precision of 16%. The result of the combination of ATLAS and CMS
measurements is shown together with the individual ATLAS and CMS measurements and compared to
the theoretical prediction in Fig. 1.
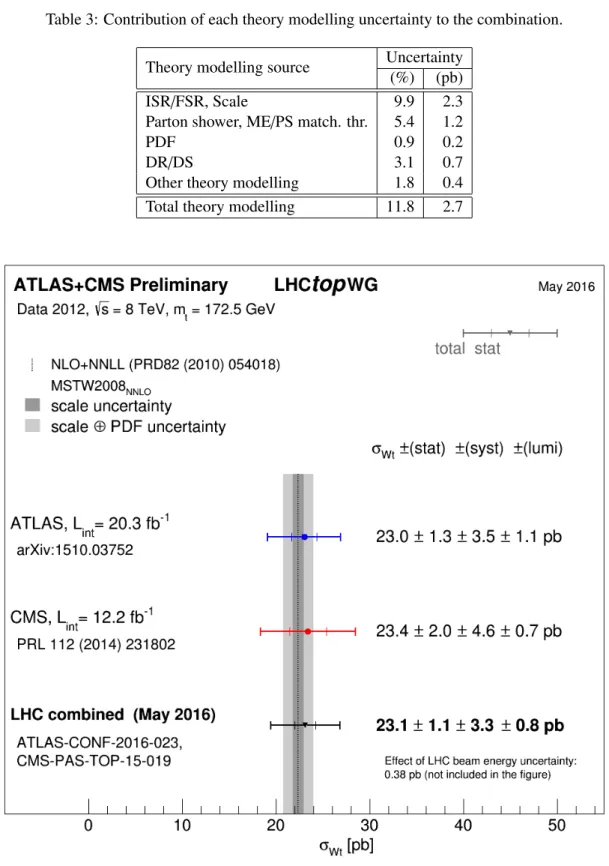
Table 3: Contribution of each theory modelling uncertainty to the combination.
Theory modelling source Uncertainty (%) (pb)
ISR
/FSR, Scale 9.9 2.3
Parton shower, ME
/PS match. thr. 5.4 1.2
PDF 0.9 0.2
DR
/DS 3.1 0.7
Other theory modelling 1.8 0.4 Total theory modelling 11.8 2.7
Figure 1: Cross-section measurements for the associated production of a top quark and a W boson performed by ATLAS and CMS, and combined result compared with the NLO
+NNLL prediction [34]
(gray bands). The uncertainties in the theoretical prediction are represented by dark and light gray bands
for renormalisation/factorisation scale and PDF (evaluated using MSTW2008 [36]), respectively.
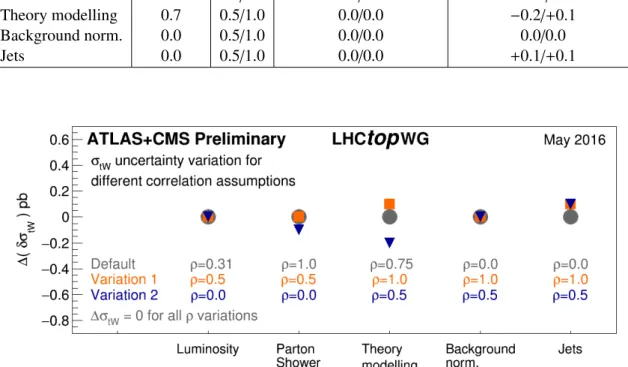
5.1 Stability tests
In order to test the stability of the cross-section combination with respect to the assumed correlations between ATLAS and CMS uncertainties the correlation coefficients have been varied for the luminosity, theory modelling, jets and background normalisation uncertainties. Table 4 summarises the result of these tests where the assumed correlations are varied using conservative choices. A graphical overview is provided in Fig. 2. In particular the theory modelling category has been varied from its default value to half and full correlation. There is no change in the central value and the largest change in uncertainty is 0.2 pb, corresponding to the case where the correlation for the theory modelling uncertainties is
ρ=0.5.
Table 4: Results of the stability tests performed on the correlation assumptions about the uncertainty categories. For each test the correlation factor
ρis varied from its default value to a test value and the corresponding shifts on the combined central value and on the measured uncertainty are reported.
Source Default
ρTest
ρShift: central value (pb) Shift: tot. uncertainty (pb)
Luminosity 0.31 0.0
/0.5 0.0
/0.0 0.0
/0.0
Parton Shower 1.0 0.0/0.5 0.0/0.0
−0.1/0.0
Theory modelling 0.7 0.5/1.0 0.0/0.0
−0.2/+0.1Background norm. 0.0 0.5
/1.0 0.0
/0.0 0.0
/0.0
Jets 0.0 0.5/1.0 0.0/0.0
+0.1/+0.1Figure 2: Results of the stability tests performed on the correlation assumptions about the uncertainty categories. For each test the correlation factor
ρis varied from its default value to a test value and the corresponding shifts on the measured uncertainty are reported. No e
ffect is observed on the combined central value.
As another test, the BLUE method has also been applied with fixed absolute uncertainties, i.e. with- out scaling the relative uncertainties from each experiment to the combined central value. The combined cross-section and uncertainty remain unchanged, as expected since the two individual measurements are close to each other.
As a test of the importance of the NLO matching method uncertainty, considered in the ATLAS
analysis, the BLUE combination has been performed with that uncertainty removed. The combined
cross-section is unchanged, and the combined uncertainty is reduced by 0.02 pb compared to the nominal
result from Eq. 4. The changes are small and the behaviour as expected when removing this small uncertainty.
Together, the tests show that the analysis is robust and does not depend critically on any of the correlation assumptions.
6 Extraction of |V
tb|
The Wt cross-section is proportional to the square of the magnitude of the CKM matrix element V
tb[86, 87], i. e.,
|
f
LVV
tb|2 = σexp.σtheo.,
(5)
with
σtheo.taken from Eq. 1 (which assumes f
LVV
tb=1).
The form factor f
LVcould be modified by new physics or radiative corrections through anomalous coupling contributions [11, 88–91]. No assumption is made about CKM unitarity [11, 91]. It is assumed that the Wtb coupling is left-handed and that the production and decay of the top quark are dominated by V
tband that the contributions from V
tsand V
tdare negligible.
The BLUE combination is performed for
|f
LVV
tb|2, including the top-quark mass uncertainty in the determination of
|Vtb|. For a shift of 1 GeV in the top quark mass, both the ATLAS and CMS cross-sections shift by 1.1 pb. The e
ffect on the theoretical prediction of the cross-section for the same mass shift is 0.4 pb. The uncertainty in the LHC beam energy [92] is also included in the
|Vtb|extraction. The uncertainty on the theoretical cross-section due to the beam energy uncertainty is 0.38 pb. These addi- tional uncertainties have a small impact on the BLUE
|Vtb|combination compared to the cross-section combination. When comparing a cross-section combination that includes these additional uncertainties with the default cross-section combination from Sec. 5, the central value,
χ2and p-value all change by less than 2%, and the uncertainty increases by 0.16 pb. Similarly, the
|Vtb|result is unchanged whether the experimental and theoretical uncertainties due to the top-quark mass are considered correlated (default) or not.
The following value is obtained for
|f
LVV
tb|:|
f
LVV
tb|=1.02
±0.09
.(6)
7 Summary
The ATLAS and CMS collaborations have measured the cross-section for the production of a top quark in association with a W boson in proton–proton collision at
√s
=8 TeV. The two cross-section mea- surements are combined using the best linear unbiased estimator (BLUE) method. The combined cross- section is
σWt =23.1
±1.1 (stat.)
±3.3 (syst.)
±0.8 (lumi.) pb
=23.1
±3.6 pb, in agreement with the NLO
+NNLL prediction. This corresponds to a decrease of the total uncertainty by 0.3 pb compared to the most precise individual measurement. The dominant uncertainties on the combined measure- ment are due to theory modelling. The form factor times CKM matrix element is determined to be
|
f
LVV
tb|=1.02
±0.09.
References
[1] T. M. P. Tait and C.-P. Yuan, Single Top Production as a Window to Physics Beyond the Standard Model, Phys. Rev. D
63(2000) 014018, arXiv:hep-ph/0007298.
[2] H.-J. He, T. M. P. Tait, and C. P. Yuan, New top flavor models with seesaw mechanism, Phys. Rev.
D
62(2000) 011702, arXiv:hep-ph/9911266 [hep-ph].
[3] Q. H. Cao, J. Wudka, and C.-P. Yuan, Search for new physics via single top production at the LHC, Phys. Lett. B
658(2007) 50–56, arXiv:0704.2809 [hep-ph].
[4] R. M. Godbole, L. Hartgring, I. Niessen, and C. D. White, Top polarisation studies in H
−t and Wt production, J. High Energy Phys.
1201(2012) 011, arXiv:1111.0759 [hep-ph].
[5] C. Zhang and S. Willenbrock, E
ffective-Field-Theory Approach to Top-Quark Production and Decay, Phys. Rev. D
83(2011) 034006, arXiv:1008.3869 [hep-ph].
[6] J. A. Aguilar-Saavedra, Single top quark production at LHC with anomalous Wtb couplings, Nucl.
Phys. B
804(2008) 160–192, arXiv:0803.3810 [hep-ph].
[7] J. Aguilar-Saavedra, R. Benbrik, S. Heinemeyer, and M. Perez-Victoria, Handbook of vectorlike quarks: Mixing and single production, Phys. Rev. D
88(2013) 094010, arXiv:1306.0572 [hep-ph].
[8] G. Durieux, F. Maltoni, and C. Zhang, Global approach to top-quark flavor-changing interactions, Phys. Rev. D
91(2015) no. 7, 074017, arXiv:1412.7166 [hep-ph].
[9] J. Nutter, R. Schwienhorst, D. G. Walker, and J.-H. Yu, Single Top Production as a Probe of B-prime Quarks, Phys. Rev. D
86(2012) 094006, arXiv:1207.5179 [hep-ph].
[10] D0 Collaboration, V. M. Abazov et al., Combination of searches for anomalous top quark couplings with 5.4 fb
−1of p p collisions, Phys. Lett. B ¯
713(2012) 165–171, arXiv:1204.2332 [hep-ex].
[11] J. Alwall, R. Frederix, J. M. Gerard, A. Giammanco, M. Herquet, S. Kalinin, E. Kou, V. Lemaitre, and F. Maltoni, Is V(
tb)
'1?, Eur. Phys. J. C
49(2007) 791–801, arXiv:hep-ph/0607115 [hep-ph].
[12] T. M. P. Tait, The tW
−mode of single top production, Phys. Rev. D
61(2000) 034001, arXiv:hep-ph/9909352 [hep-ph].
[13] A. Belyaev and E. Boos, Single top quark tW
+X production at the CERN LHC: A Closer look, Phys. Rev. D
63(2001) 034012, arXiv:hep-ph/0003260 [hep-ph].
[14] ATLAS Collaboration, Search for the production of single vector-like and excited quarks in the Wt final state in pp collisions at
√s
=8 TeV with the ATLAS detector, JHEP
1602(2016) 110, arXiv:1510.02664 [hep-ex].
[15] CMS Collaboration, Search for the production of an excited bottom quark decaying to tW in proton–proton collisions at
√s
=8 TeV, JHEP
1601(2016) 166, arXiv:1509.08141 [hep-ex].
[16] ATLAS Collaboration, Search for direct production of charginos, neutralinos and sleptons in final states with two leptons and missing transverse momentum in pp collisions at
√s
=8 TeV with the
ATLAS detector, JHEP
1405(2014) 071, arXiv:1403.5294 [hep-ex].
[17] ATLAS Collaboration, ATLAS Run 1 searches for direct pair production of third-generation squarks at the Large Hadron Collider, Eur. Phys. J. C
75(2015) 510, arXiv:1506.08616 [hep-ex].
[18] CMS Collaboration, Search for physics beyond the standard model in events with two leptons, jets, and missing transverse momentum in pp collisions at
√s
=8 TeV, JHEP
1504(2015) 124, arXiv:1502.06031 [hep-ex].
[19] CMS Collaboration, Search for direct pair production of scalar top quarks in the single- and dilepton channels in proton–proton collisions at
√s
=8 TeV, arXiv:1602.03169 [hep-ex].
[20] ATLAS Collaboration, Observation and measurement of Higgs boson decays to WW
∗with the ATLAS detector, Phys. Rev. D
92(2015) 012006, arXiv:1412.2641 [hep-ex].
[21] ATLAS Collaboration, Measurements of Higgs boson production and couplings in diboson final states with the ATLAS detector at the LHC, Phys. Lett. B
726(2013) 88, arXiv:1307.1427 [hep-ex].
[22] CMS Collaboration, Measurement of Higgs boson production and properties in the WW decay channel with leptonic final states, JHEP
1401(2014) 096, arXiv:1312.1129 [hep-ex].
[23] CMS Collaboration, Precise determination of the mass of the Higgs boson and tests of
compatibility of its couplings with the standard model predictions using proton collisions at 7 and 8 TeV, Eur. Phys. J. C
75(2015) 212, arXiv:1412.8662 [hep-ex].
[24] ATLAS Collaboration, Evidence for the associated production of a W boson and a top quark in ATLAS at
√s
=7 TeV, Phys. Lett. B
716(2012) 142, arXiv:1205.5764 [hep-ex].
[25] CMS Collaboration, Evidence for associated production of a single top quark and W boson in pp collisions at
√s
=7 TeV, Phys. Rev. Lett.
110(2013) 022003, arXiv:1209.3489 [hep-ex].
[26] CMS Collaboration, Observation of the associated production of a single top quark and a W boson in pp collisions at
√s
=8 TeV, Phys. Rev. Lett.
112(2014) 231802, arXiv:1401.2942 [hep-ex].
[27] ATLAS Collaboration, Measurement of the production cross-section of a single top quark in association with a W boson at 8 TeV with the ATLAS experiment, JHEP
1601(2016) 064, arXiv:1510.03752 [hep-ex].
[28] ATLAS and CMS Collaborations, Combination of cross-section measurements for associated production of a single top-quark and a W boson at
√s
=8 TeV with the ATLAS and CMS experiments, ATLAS-CONF-2014-052, CMS-PAS-TOP-14-009 (2014).
https://cds.cern.ch/record/1951032.
[29] ATLAS Collaboration, Measurement of the cross-section for associated production of a top quark and a W boson at
√s
=8 TeV with the ATLAS detector, ATLAS-CONF-2013-100 (2013).
http://cds.cern.ch/record/1600799.
[30] W. T. Giele, S. Keller, and E. Laenen, QCD corrections to W boson plus heavy quark production at the Tevatron, Phys. Lett. B
372(1996) 141–149, arXiv:hep-ph/9511449 [hep-ph].
[31] S. Zhu, Next-to-leading order QCD corrections to bg
→tW
−at the CERN Large Hadron
Collider, Phys. Lett. B
524(2002) 283, arXiv:hep-ph/00109269 [hep-ph].
[32] J. M. Campbell and F. Tramontano, Next-to-leading order corrections to Wt production and decay, Nucl. Phys. B
726(2005) 109, arXiv:hep-ph/0506289 [hep-ph].
[33] N. Kidonakis, Two-loop soft anomalous dimensions for single top quark associated production with a W
−or H
−, Phys. Rev. D
82(2010) 054018, arXiv:1005.4451 [hep-ph].
[34] N. Kidonakis, NNLL threshold resummation for top-pair and single-top production, Phys. Part.
Nucl.
45(2014) 714, arXiv:1210.7813 [hep-ph].
[35] A. Martin, W. Stirling, R. Thorne, and G. Watt, Uncertainties on
αSin global PDF analyses and implications for predicted hadronic cross sections, Eur. Phys. J. C
64(2009) 653,
arXiv:0905.3531 [hep-ph].
[36] A. Martin, W. Stirling, R. Thorne, and G. Watt, Parton distributions for the LHC, Eur. Phys. J. C
63(2009) 189, arXiv:0901.0002 [hep-ph].
[37] Y. Freund and R. Schapire, A decision-theoretic generalization of on-line learning and an application to Boosting, Journal of Computer and System Science
55(1997) 119.
[38] H. J. Friedman, Recent Advances in Predictive (Machine) Learning, Journal of Classification
23(2006) no. 2, 175. http://dx.doi.org/10.1007/s00357-006-0012-4.
[39] A. Hoecker, P. Speckmayer, J. Stelzer, J. Therhaag, E. von Toerne, and H. Voss, TMVA: Toolkit for Multivariate Data Analysis, PoS
ACAT(2007) 040, arXiv:physics/0703039.
[40] S. Alioli, P. Nason, C. Oleari, and E. Re, A general framework for implementing NLO calculations in shower Monte Carlo programs: the POWHEG BOX, J. High Energy Phys.
1006(2010) 043, arXiv:1002.2581 [hep-ph].
[41] S. Frixione, E. Laenen, P. Motylinski, C. White, and B. Webber, Single-top hadroproduction in association with a W boson, J. High Energy Phys.
07(2008) 029, arXiv:0805.3067 [hep-ph].
[42] J. Alwall, M. Herquet, F. Maltoni, O. Mattelaer, and T. Stelzer, MadGraph 5 : Going Beyond, JHEP
06(2011) 128, arXiv:1106.0522 [hep-ph].
[43] H.-L. Lai et al., New parton distributions for collider physics, Phys. Rev. D
82(2010) 074024, arXiv:1007.2241 [hep-ph].
[44] P. M. Nadolsky, H.-L. Lai, Q.-H. Cao, J. Huston, and Pumplin, Implications of CTEQ global analysis for collider observables, Phys. Rev. D
78(2008) 013004, arXiv:0802.0007 [hep-ph].
[45] S. D. Ellis and D. E. Soper, Successive Combination Jet Algorithm For Hadron Collisions, Phys.
Rev. D
48(1993) 3160, arXiv:hep-ph/9305266.
[46] S. Catani, Y. L. Dokshitzer, M. Seymour, and B. Webber, Longitudinally-invariant k
⊥-clustering algorithms for hadron-hadron collisions, Nucl. Phys. B
406(1993) 187.
[47] K. Cranmer, G. Lewis, L. Moneta, A. Shibata, and W. Verkerke, HistFactory: A tool for creating statistical models for use with RooFit and RooStats, CERN-OPEN-2012-016 (2012) .
https://cds.cern.ch/record/1456844.
[48] L. Moneta, K. Cranmer, G. Schott, and W. Verkerke, The RooStats project, in Proceedings of the 13th International Workshop on Advanced Computing and Analysis Techniques in Physics Research. February 22-27, 2010, Jaipur, India. http:
//acat2010.cern.ch, p. 57. 2010.
arXiv:1009.1003 [physics.data-an].
[49] G. Cowan, K. Cranmer, E. Gross, and O. Vitells, Asymptotic formulae for likelihood-based tests of new physics, Eur. Phys. J. C
71(2011) 1554, arXiv:1007.1727 [physics.data-an].
[Erratum: Eur. Phys. J.C73,2501(2013)].
[50] ATLAS and CMS Collaborations, Combination of single top-quark cross-section measurements in the t-channel at
√s
=8 TeV with the ATLAS and CMS experiments, ATLAS-CONF-2013-098, CMS-PAS-TOP-12-002 (2013). https://cds.cern.ch/record/1601029.
[51] L. Lyons, D. Gibaut, and P. Clifford, How to combine correlated estimates of a single physical quantity, Nucl. Instr. and Meth. A
270(1988) 110.
[52] A. Valassi, Combining correlated measurements of several di
fferent physical quantities, Nucl.
Instr. and Meth. A
500(2003) 391.
[53] L. Lista, The bias of the unbiased estimator: a study of the iterative application of the BLUE method, Nucl. Instr. Meth. A
764(2014) 82, arXiv:1405.3425.
[54] L. Lyons, A. J. Martin, and D. H. Saxon, On the determination of the B lifetime by combining the results of di
fferent experiments, Phys. Rev. D
41(1990) 982.
[55] CMS Collaboration, Measurement of the single-top-quark t-channel cross section in pp collisions at
√s
=7 TeV, JHEP
1212(2012) 035, arXiv:1209.4533 [hep-ex].
[56] ATLAS Collaboration, Improved luminosity determination in pp collisions at
√s
=7 TeV using the ATLAS detector at the LHC, Eur. Phys. J. C
73(2013) 2518, arXiv:1302.4393 [hep-ex].
[57] CMS Collaboration, CMS Luminosity Based on Pixel Cluster Counting - Summer 2013 Update, CMS-PAS-LUM-13-001 (2013). https://cds.cern.ch/record/1598864.
[58] ATLAS Collaboration, Measurement of t¯ t production with a veto on additional central jet activity in pp collisions at
√s
=7 TeV using the ATLAS detector, Eur. Phys. J. C
72(2012) 2043, arXiv:1203.5015 [hep-ex].
[59] ATLAS Collaboration, Comparison of Monte Carlo generator predictions for gap fraction and jet multiplicity observables in top-antitop events, ATL-PHYS-PUB-2014-005 (2014) .
http://cds.cern.ch/record/1703034.
[60] S. Frixione and B. R. Webber, Matching NLO QCD computations and parton shower simulations, JHEP
0206(2002) 029, arXiv:hep-ph/0204244.
[61] P. Z. Skands, Tuning Monte Carlo Generators: The Perugia Tunes, Phys. Rev.
D82(2010) 074018, arXiv:1005.3457.
[62] G. Corcella et al., HERWIG 6.5: an event generator for Hadron Emission Reactions With Interfering Gluons (including supersymmetric processes), J. High Energy Phys.
01(2001) 010, arXiv:hep-ph/0011363.
[63] J. Butterworth, J. R. Forshaw, and M. Seymour, Multiparton interactions in photoproduction at HERA, Z. Phys. C
72(1996) 637, arXiv:hep-ph/9601371.
[64] T. Sjostrand, S. Mrenna, and P. Z. Skands, PYTHIA 6.4 Physics and Manual, J. High Energy Phys.
0605