A TLAS-CONF-2014-054 30 September 2014
TOPLHC NOTE
ATLAS-CONF-2014-054 CMS PAS TOP-14-016
September 28, 2014
Combination of ATLAS and CMS top quark pair cross section measurements in the eµ final state using proton-proton collisions at
√ s = 8 TeV
The ATLAS and CMS Collaborations
1Abstract
A combination of ATLAS and CMS measurements of the top quark pair production cross section (σ
t¯t) using proton-proton collisions at a centre-of-mass energy of 8 TeV is presented.
The measurements make use of top quark pair events in the dilepton decay channel with exactly one electron and one muon in the final state. The integrated luminosities of the two measurements are 20.3 and 5.3 fb
−1for ATLAS and CMS, respectively. The combined cross section is determined to be σ
t¯t= 241.5 ± 1.4 (stat.) ± 5.7 (syst.) ± 6.2 (lumi.) pb = 241.5 ± 8.5 pb for a top quark mass reference value of 172.5 GeV. The total uncertainty of the combined result is 3.5%. An uncertainty on the LHC beam energy of 0.66% translates into an additional uncertainty of 4.2 pb on σ
t¯t. The combined cross section depends on the assumed top quark mass value m
twith a slope of 1/σ
t¯tdσ
t¯t/dm
t= − 0.46%/GeV around the reference value. The result is in good agreement with the standard model prediction calculated in perturbative QCD to next-to-next-to-leading order.
1
Work within the Top Physics LHC working group (TOPLHCWG).
More information at http://twiki.cern.ch/twiki/bin/view/LHCPhysics/TopLHCWG.
c Copyright 2014 CERN for the benefit of the ATLAS and CMS Collaborations. Reproduction of this article or
parts of it is allowed as specified in the CC-BY-3.0 license.
1 Introduction
A precise measurement of the top quark pair production cross section σ
t¯tis an important milestone for the LHC physics programme. It allows for precise tests of the theoretical predictions based on perturbative quantum chromodynamics (QCD). The latest calculations are performed at next-to-next-to leading order (NNLO) in QCD including resummation of next-to-next-to-leading logarithmic (NNLL) soft gluon terms, and are believed to be accurate to approximately 6% [1–6]. Various processes beyond the standard model (SM) may give rise to additional t¯t production mechanisms that can affect the total production cross section. In addition, SM t¯t production is an important background to the study of the properties of the Higgs boson and various searches for physics beyond the SM.
The t¯t cross section for pp collisions at a centre-of-mass energy of √
s = 8 TeV is predicted to be σ
t¯t= 252.9
+6.4−8.6(scale) ± 11.7 (PDF+α
S) pb for a top quark pole mass reference value of 172.5 GeV.
It has been calculated at NNLO in QCD including the resummation of NNLL soft gluon terms with Top++2.0 [7]. The quoted scale uncertainty is derived from the independent variation of the renormal- ization and factorization scales by a factor of two, excluding those variations for which the two scales differ from each other by a factor of 4. The central scale used is the top quark pole mass. The com- bined PDF and α
Suncertainty is obtained by evaluating the individual PDF+α
Suncertainties for the MSTW2008 68% CL NNLO [8, 9], CT10 NNLO [10, 11] and NNPDF2.3 [12] PDF sets and combining them according to the PDF4LHC prescription [13]. The PDF+α
Suncertainty for the individual PDF sets is derived using two different methods. For the MSTW2008 NNLO PDF, the recommendation of the authors [9] is used, which is equivalent to choosing α
S= 0.1171 ± 0.0014 and accounts for correlations between the α
Sand PDF uncertainties. For CT10 and NNPDF, the difference between the central PDF set prediction with α
S= 0.1180 and predictions with variations of ± 0.0020, scaled down by a factor of 1.645 to yield equivalent variations of ± 0.0012, are added in quadrature to the PDF uncertainties from the central α
Ssets. The midpoint of the envelope of the upper and lower error bands for the three PDF sets defines the central PDF4LHC prediction, and the upper and lower edge define the total PDF+α
Suncertainty.
Within the SM, top quarks are predicted to decay to a W boson and a b quark with a branching ratio of nearly 100%, and the final-state topologies are determined by the decays of the W bosons [14]. The eµ channel, with a branching ratio of 2.3%, arises from the decay of one W boson to an electron-neutrino pair and the other to a muon-neutrino pair, giving rise to final states with two leptons, missing transverse momentum, and jets, two of which originate from b quarks. This final state also includes the small contributions from W → τ → e and W → τ → µ decays.
This note presents a combination of the published measurements of the t¯t production cross section in pp collisions at a centre-of-mass energy of √
s= 8 TeV by the ATLAS and CMS collaborations in the dilepton eµ channel [15, 16], which provides the most precise cross section measurements so far.
2 Combination method
The combination is performed using the Best Linear Unbiased Estimator (BLUE) method [17, 18], fol- lowing the same approach as for the previous ATLAS and CMS combination of t¯t cross sections [19] at
√ s = 7 TeV.
The BLUE method determines a set of weights to be used in a weighted sum of the input measure-
ments. The chosen set minimizes the total uncertainty on the combined result. In the algorithm, both
the absolute statistical and systematic uncertainties of the input measurements, as well as the correla-
tions of systematic sources between input measurements, are taken into account under the hypothesis
that all uncertainties are Gaussian distributed. The latter is assumed for the input measurements to the
combination.
An iterative implementation of the BLUE method [20], that uses relative uncertainties instead of ab- solute ones and reduces the potential bias present when the estimated uncertainties depend on measured values, provides the same results as those shown in the present note.
The following sections describe the input measurements and the assignment of systematic uncertain- ties to different categories to properly take into account their correlations, followed by studies of the stability of the combined result with respect to the assumed correlations between the ATLAS and CMS systematic uncertainties.
3 Input measurements
3.1 The ATLAS measurement
The ATLAS measurement [15] is based on 20.3 fb
−1of integrated luminosity in the eµ channel. Events are selected by requiring a single-lepton trigger, one opposite-sign eµ pair with lepton transverse mo- mentum p
T> 25 GeV and pseudorapidity | η | < 2.5 ( | η | < 2.47, excluding the calorimeter transition region 1.37 < | η | < 1.52) for muons (electrons), and at least one b-tagged jet with p
T> 25 GeV and
| η | < 2.5. The cross section is extracted simultaneously with the efficiency to reconstruct and b-tag a jet from a top quark decay by counting events with one (N
1) and two (N
2) b-jets, thereby minimizing the associated systematic uncertainties:
N
1= Lσ
t¯tǫ
eµ2ǫ
b(1 − C
bǫ
b) + N
1bkg(1) N
2= Lσ
t¯tǫ
eµC
bǫ
b2+ N
2bkg. (2) Here L is the integrated luminosity, ǫ
eµis the efficiency for a t¯t event to pass the eµ selection, N
1(N
2) is the number of selected eµ events with exactly one (two) b-tagged jets, N
1bkg(N
2bkg) is the number of the background events with exactly one (two) b-tagged jets, ǫ
bis the combined probability for a b-jet from a top quark decay to fall into the acceptance of the detector, be reconstructed, pass the selection, and be b-tagged. The parameter C
bdenotes a correlation between the probabilities to reconstruct and b-tag each of the two b-jets. The t¯t signal sample is simulated using the NLO matrix element Monte Carlo (MC) generator P [21] with CT10 PDF [10] interfaced with P [22] for the subsequent parton showering and hadronization. The measured cross section is σ
t¯t= 242.4 ± 1.7 (stat.) ± 5.5 (syst.) ± 7.5 (lumi.) pb for a top quark mass reference value of 172.5 GeV, corresponding to a total uncertainty of 3.9%. Additionally, the uncertainty of 4.2 pb coming from the calibration of the LHC beam energy has been evaluated. This uncertainty must be taken into account when comparing the measured cross section with theoretical calculations performed at a certain centre-of-mass energy. The measured cross section has a very weak dependence on the assumed top quark mass value due to the calibration of the jet selection efficiency from the data itself, with a slope of 1/σ
t¯tdσ
t¯t/dm
t= − 0.28%/GeV around the reference value.
3.2 The CMS measurement
The CMS measurement [16] is based on 5.3 fb
−1of integrated luminosity and is performed in the eµ,
ee, and µµ channels. For the purpose of the combination, only the eµ channel is considered, given that
the additional channels do not contribute significantly to the result. Events are selected by requiring a
dilepton trigger, one opposite-sign eµ pair with lepton p
T> 20 GeV and | η | < 2.1 ( | η | < 2.5) for muons
(electrons), and at least two jets with p
T> 30 GeV and | η | < 2.5. The cross section is extracted by count-
ing events with at least one b-tagged jet. The LO multileg MC generator M G [23] with CTEQ6L1
PDF [24] interfaced with P is used to model the t¯t signal sample. The measured cross section for a
top quark mass of 172.5 GeV is σ
t¯t= 239.0 ± 2.6 (stat.) ± 11.9 (syst.) ± 6.2 (lumi.) pb, corresponding to a
total uncertainty of 5.7%. An additional uncertainty of 1.4%, arising from the hadronization model [16]
in t¯t events, is included for the combination in order to equalize the treatment of uncertainties between the two experiments. The measured cross section has a dependence on the assumed top quark mass value of
σ
t¯t(m
t)/σ
t¯t(m
t= 172.5 GeV) = 1.00 − 0.009 × (m
t− 172.5) (3) where m
tshould be expressed in GeV, or 1/σ
t¯tdσ
t¯t/dm
t= − 0.9%/GeV around the reference value.
4 Classification of uncertainties
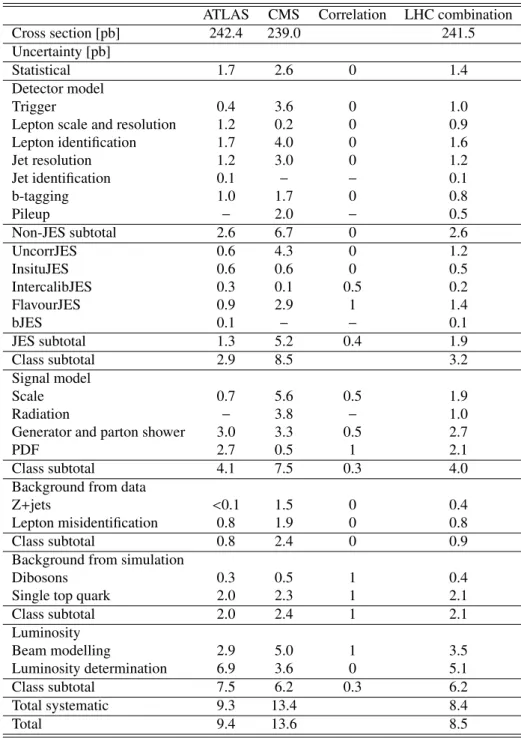
For both ATLAS and CMS measurements, the systematic uncertainties are evaluated by varying each source of uncertainty and repeating the full analysis. The individual contributions are added in quadra- ture to obtain the total uncertainty. The systematic uncertainties evaluated by the ATLAS and CMS measurements and their assignment to classes, categories, and sub-categories used for the combination are described in the following section and summarized in Table 1, together with the assumed correlations between them.
Statistical
This class of uncertainty arises from the data statistics used for the measurements and is treated as uncorrelated between the ATLAS and CMS measurements.
Detector model
This class of uncertainty includes contributions due to uncertainties in the modelling of detector effects in the simulation. All uncertainties in this class are taken as uncorrelated between the ATLAS and CMS measurements, unless stated otherwise.
• Trigger: For ATLAS and CMS this category includes uncertainties in the trigger efficiency mea- surement. The measurement by CMS uses a dilepton trigger, while the measurement by ATLAS requires a single-lepton trigger for which the efficiency can be measured with higher precision than for the dilepton trigger as only one of the leptons is required to fire the trigger.
• Lepton scale and resolution: For ATLAS and CMS this category includes uncertainties in the electron energy scale and resolution, and muon momentum scale and resolution. These are studied using Z → ee/µµ, J/ψ → ee/µµ, and W → eν events in data and simulation both in ATLAS [25,26]
and in CMS [27, 28].
• Lepton identification: For ATLAS and CMS this category includes uncertainties in the electron and muon identification efficiencies and the lepton isolation. The latter is measured by ATLAS using a data-driven technique in t¯t events to reduce sensitivity to extra jet activity [15]. In the CMS measurement, the lepton identification efficiency is measured in data and simulation using a
“tag-and-probe” method in dilepton events enriched in Z boson candidates [29, 30].
• Jet resolution: This category includes contributions due to the uncertainties in the modelling of the jet energy resolution (JER).
• Jet identification: This category includes uncertainties in jet reconstruction and the fraction of
jets coming from the primary vertex. For the CMS measurement, this uncertainty is found to be
negligible.
• b-tagging: This category includes the uncertainty due to uncertainties in the b-, c- and light jet tagging calibration. In the ATLAS analysis it arises only from the background contributions de- rived from simulation, since ǫ
bis measured simultaneously with the t¯t cross section in data, and thus contributes to the statistical uncertainty on the measured cross section. Therefore, this un- certainty is assumed to be uncorrelated between ATLAS and CMS. The stability of the combined cross section under variations of the assumed correlation is studied in Section 6.
• Pileup: This category includes the uncertainty due to the modelling of the number of simultaneous pp interactions per beam crossing (pileup). For the ATLAS measurement, the effect of this uncer- tainty is included in the JES uncertainty and in the uncertainty on lepton isolation determined from data.
• JES: This category includes uncertainties in the jet energy scale (JES) calibration. A more detailed sub-categorization of this uncertainty into its multiple components has been provided by ATLAS and CMS for the purpose of the present cross section combination. This sub-categorization, the assumed input correlation for each sub-category, and the values for the varied correlations (studied in Section 6.3) follow the latest recommendations from ATLAS and CMS [31]:
– UncorrJES: This is the JES uncertainty component which is uncorrelated between experi- ments. It includes the statistical uncertainty of the default jet energy calibrations and detector specific effects.
– InsituJES: This corresponds to the part of the JES uncertainty resulting from modelling un- certainties affecting the absolute JES determination using events from Z/γ
∗boson production with additional jets (referred to as Z+jets), not included in the previous category. This uncer- tainty is assumed to be uncorrelated between ATLAS and CMS measurements.
– IntercalibJES: This is the JES uncertainty component originating from the modelling of the radiation in the calibration of the forward η region with respect to the central one. It is assumed to be 50% correlated between ATLAS and CMS.
– FlavourJES: This includes the part of the JES uncertainty stemming from differences in the jet energy response for various jet flavours (quark- versus gluon-originated jets) and flavour mixture, with respect to those used in the calibration procedures. For this source, no rec- ommendation for the correlation exists. Therefore, the full range of correlations between zero and unity is considered. The combined cross section and the uncertainty are found to be insensitive to the choice of the correlation value (see Section 6). It is chosen to be fully correlated between ATLAS and CMS.
– bJES: This accounts for an additional b-jet specific uncertainty, arising from the uncertainty in the modelling of the response of jets originating from b-quarks. For the CMS analysis, this uncertainty is included in the FlavourJES component.
The smaller uncertainties from JES and JER in the ATLAS measurement are due to the measurement of ǫ
bfrom data, since it includes the probability for a b-jet from a top quark decay to fall into the acceptance of the detector, be reconstructed, and pass the selection.
Signal model
This class of uncertainty stems from the limitations due to the t¯t signal modelling and includes several components:
• Generator and parton shower: This category corresponds to uncertainties arising from the choice
of the MC generator and the parton shower in the ATLAS analysis. It is determined by comparing
the P +P simulation to MC@NLO [32]+H [33], thereby changing both the gen- erator and the parton shower model. Changing only the latter results in smaller uncertainties. In the CMS analysis, this uncertainty includes the effect from the choice of the parton shower model, evaluated by comparing samples of t¯t events generated with P [34] where the hadronization is modelled with P and H . This uncertainty amounts to 1.4% and is not included in the total uncertainty of the CMS measurement but is quoted separately in the paper, following the argument that the difference between the P and H shower is already accounted for in the JES systematic uncertainty. This additional uncertainty is included in the combination. Given that the uncertainty in the ATLAS measurement is evaluated by changing both the generator and the parton shower while only the parton shower is changed in the CMS measurement, the uncertainties are likely not to be 100% correlated. Moreover, in the ATLAS measurement only the lepton ac- ceptance, identification, and reconstruction efficiencies are affected by such variation, while in the CMS measurement the lepton isolation and jet acceptance and efficiency contribute to the uncer- tainty. For these reasons, the correlation between ATLAS and CMS for this category is assumed to be 50%.
• Radiation: This is the part of the modelling uncertainty due to the description of radiation. In the ATLAS measurement, the effect of extra radiation in t¯t events is studied by comparing A -
[35]+P and A MC [36]+P samples with different P tunes whose parame- ters span the variations compatible with ATLAS studies of additional jet activity in t¯t events at
√ s = 7 TeV [37–39]. These samples predict large variations in the lepton isolation efficiencies, which is one of the components of ǫ
eµ. However, in the ATLAS analysis the lepton isolation efficiency is measured from data. The component of ǫ
eµstemming from the lepton reconstruc- tion and identification efficiencies and the correlation C
b, which are determined from simulation, show uncertainties that are much smaller than the differences between the P +P and MC@NLO+H samples. For this reason, no extra uncertainty due to radiation is assigned in the ATLAS measurement. In the CMS analysis, the effect of extra radiation is evaluated by varying parameters related to the matching between the matrix elements and the parton shower in M G +P samples performed using the k
tparton-jet clustering algorithm. Specifically, the minimum k
tmeasure between the partons is varied by a factor of two up and down together with the jet p
Tmatching threshold, which is varied between 0.75 and 1.5 with respect to its default value.
• Scale: This is the part of the modelling uncertainty due to the choice of the scale in the matrix element used to generate t¯t events. In the ATLAS measurement it is determined by varying the factorization and renormalization scales separately in P by a factor of two up and down from the default value of Q
2= m
2t+ p
2T,twhere m
tand p
T,tare the top quark mass and transverse momentum, respectively. The scale uncertainty is obtained by adding linearly the factorization and renormalization scale uncertainties. In the CMS analysis, the factorization and renormalization scales defined as Q
2= m
2t+ P
p
2T, where the sum runs over the transverse momenta of all partons in
the final state, are varied simultaneously by a factor of two up and down in both the matrix element
and the parton shower in the M G +P sample, thus accounting also for effects due to
additional radiation. The smaller size of this uncertainty in the ATLAS measurement is attributed
to the usage of a NLO generator (i.e. P ), as the NLO theoretical calculations are known
to reduce the scale dependence compared to LO. Given that the scale variation at LO and NLO
covers different physical terms and affects only the lepton efficiency in the ATLAS measurement
and both the lepton and the jet efficiencies in the CMS measurement, this uncertainty category is
assumed to be 50% correlated between ATLAS and CMS.
• PDF: This is the uncertainty related to the proton parton distribution functions. For ATLAS, this uncertainty is evaluated using the error sets of CT10 [10], MSTW2008 68% CL NLO [9] and NNPDF 2.3 NLO [12] sets following the PDF4LHC recommendations [13]. For the CMS analysis, the PDF uncertainty is estimated by re-weighting the simulated t¯t signal event sample according to the CT10 error PDF set. This uncertainty is assumed to be fully correlated between ATLAS and CMS.
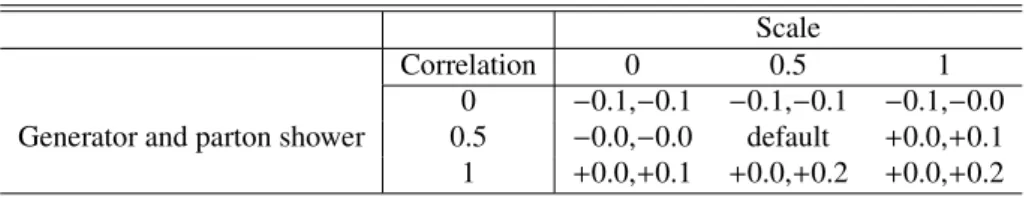
Given the significantly different approach followed by ATLAS and CMS to determine the Signal model uncertainties, the effect of the assumption of the correlations on the combined σ
t¯thas been studied and is discussed in Section 6.
Background from data
This class of uncertainty includes the uncertainties in the modelling of the background determined from data.
• Z + jets: For both ATLAS and CMS measurements, these originate from uncertainties in the data- driven estimate of the background contribution from Z+jets events.
• Lepton misidentification: For both ATLAS and CMS measurements, these originate from uncer- tainties in the misidentified lepton background normalization.
This uncertainty class is taken as uncorrelated between the two collaborations, since the methods to estimate these uncertainties differ between the two experiments and associated uncertainties are data- driven.
Background from simulation
This class of uncertainty represents the uncertainty due to the modelling of the background sources determined from MC simulation and is taken as fully correlated between the two collaborations. The assumption on the correlation is discussed in Section 6.
• Dibosons: For the ATLAS measurement, this uncertainty category is evaluated by comparing the baseline prediction from A +H to that from S [40]. For the CMS measurement, it originates from the uncertainty on the measured diboson cross sections [28, 41–44].
• Single top quark: For the ATLAS measurement, the uncertainty related to the Wt single top quark modelling is dominated by the uncertainty on the theoretical cross section used to normalize the Wt background [45]. An additional contribution arises from the comparison of predictions from different generators that produce a different amount of additional radiation, as well as predictions using different schemes to take into account Wt and t¯t diagrams interference. For the CMS mea- surement, this uncertainty originates from the uncertainty on the measured single top quark (Wt and t-channel) production cross section [46, 47].
Luminosity
This is the uncertainty originating from the uncertainty of the integrated luminosity determination. At the LHC, the luminosity is calibrated based on dedicated van der Meer scans [48]. The associated uncer- tainty has a contribution from the analysis of the scans that provide the absolute luminosity calibration, and from instrumental uncertainties related to the stability of luminosity measurements distributed over several months of high-luminosity physics running. The luminosity uncertainty on σ
t¯tis expected to have a component that is correlated between the two experiments, and one that is uncorrelated.
The luminosity uncertainty for ATLAS is 2.8%, with 1.7% stemming from the van der Meer scan
analysis and 2.2% from the long-term luminosity monitoring. For CMS the uncertainty is 2.6%, of
which 2.2% (1.3%) reflects the van der Meer scan analysis (the luminosity monitoring) uncertainty.
The uncertainty from the long-term luminosity monitoring is experiment specific and thus uncorrelated between CMS and ATLAS. The uncertainty from the van der Meer scan analysis is partially correlated.
The correlated component amounts to 1.1% and 2.1% for ATLAS and CMS, respectively. The largest contribution to the uncertainty arises from the model used to fit the visible interaction rate as a function of the separation between the beams (referred to as beam modelling). It drives the difference between the size of the correlated components of the luminosity uncertainties in the two experiments.
The luminosity uncertainties result in luminosity-induced uncertainties on the cross section of 3.1%
and 2.6% for ATLAS and CMS, respectively. The slightly larger uncertainty value on σ
t¯tfor ATLAS (3.1% compared to 2.8% from the luminosity uncertainty) includes a contribution from the background sources determined from simulation. In the CMS analysis, this contribution is already taken into account in the Background from simulation uncertainty. To account for the partial correlation of the luminosity- induced uncertainty on the cross section, this uncertainty is divided into two components, Beam mod- elling and Luminosity determination, treated as fully correlated and uncorrelated between the experi- ments, respectively. Since the beam modelling analyses differ between ATLAS and CMS, the effect of the breakdown of the luminosity uncertainty into correlated and uncorrelated parts on the combined σ
t¯thas been studied and is discussed in Section 6.
Beam energy
This source is not an uncertainty on the measurement itself but applies to the interpretation of the mea- sured cross section. The LHC beam energy during the 2012 run was calibrated using the revolution frequency difference of protons and lead ions in early 2013 and was found to be 0.30 ± 0.66% smaller than the nominal value of 4 TeV per beam [49]. The same technique was used to measure the beam energy at injection (450 GeV) to a precision of 0.02%. With additional assumptions, this value can be extrapolated to the collision energy using the magnet transfer functions to give a value consistent with the nominal 4 TeV and a relative uncertainty of 0.09% [49]. The possible deviation from the nominal beam energy has to be considered when comparing the measured cross sections to theoretical predictions and it applies to both ATLAS and CMS measurements. According to the NNLO+NNLL calculation (see Section 1), the t¯t production cross section depends on √
s as (dσ
t¯t/σ
t¯t)/(d √ s/ √
s) = 2.61 at √
s = 8 TeV.
Therefore, taking the direct proton-lead calibration at 4 TeV, it is (0.78 ± 1.72)% smaller at the measured LHC energy than at √
s = 8 TeV. Since both determinations of the LHC beam energy are consistent with the nominal value, no correction to the central value of σ
t¯tis applied. Moreover, since the indirect beam energy determination based on the magnet transfer functions shows no evidence of a shift from the nominal value of 4 TeV with high precision, only the uncertainty on the systematics dominated and less precise but direct measurement of the LHC beam energy is conservatively considered to assign a separate systematic uncertainty on the combined cross section; this amounts to 1.72%.
5 LHC combination
The resulting combination of the ATLAS and CMS measurements is summarized in Table 1. Despite the fact that ATLAS and CMS have different approaches to the evaluation of various components of the signal modelling uncertainty, reflected in the different partitioning among the different categories, the total signal modelling uncertainty is approximately the same between the two collaborations.
The combination yields σ
t¯t= 241.5 ± 1.4 (stat.) ± 5.7 (syst.) ± 6.2 (lumi.) pb = 241.5 ± 8.5 pb assuming
a top quark mass of 172.5 GeV. The resulting weights for ATLAS and CMS in the combined result are
73% and 27%, respectively. The two measurements are consistent with each other with a χ
2probability
of 82%; the correlation between the measurements is 24%. The combined t¯t production cross section
has an uncertainty of 3.5%, thus improving by 11% the precision of the σ
t¯tmeasurement with respect
to the more precise ATLAS result. The uncertainty is dominated by the uncertainty on the luminosity determination, followed by the signal and detector modelling. The uncertainty due to the calibration of the LHC beam energy is estimated to be 4.2 pb.
Using the cross section dependence on the top quark mass provided by the experiments, and assum- ing that the relative uncertainties on the cross sections measured by ATLAS and CMS do not depend on the assumed top quark mass within the range between 170 and 175 GeV, the input cross sections are evaluated assuming these two top quark mass values and the corresponding combinations are per- formed. The dependence of the combined cross section on the assumed top quark mass value is deter- mined by fitting the combined cross sections evaluated at m
t= 170 and 175 GeV, resulting in a slope of 1/σ
t¯tdσ
t¯t/dm
t= − 0.46%/GeV around the reference value of 172.5 GeV. This yields a 0.9 pb lower value of σ
t¯tfor the world average top quark mass of 173.34 GeV [50].
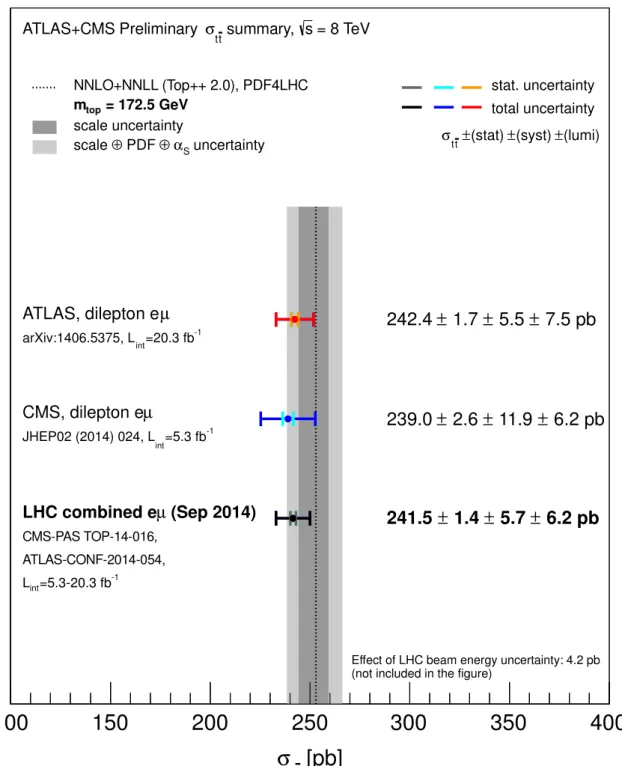
Figure 1 shows a summary of the CMS and ATLAS measurements used as inputs to the LHC com- bination, together with the LHC combined σ
t¯t. The measurements are compared to the NNLO+NNLL theoretical calculation for a top quark mass of 172.5 GeV (see Section 1). Although both the measured cross sections and the theoretical calculation are affected by the scale and PDF uncertainties, it is reason- able to assume that the effects are uncorrelated. The theoretical prediction and the corresponding scale uncertainties are based on a calculation at NNLO in QCD, while the experimental scale uncertainties cor- respond to the NLO (for ATLAS) and LO (for CMS) matrix elements in the simulation. Therefore, the physical terms covered by the NLO and LO scale uncertainty (e.g. those that come from higher orders) are most likely dominated by terms that are not included in the NNLO scale uncertainty. In addition, the variation in the theoretical calculation addresses the change in the total number of produced top quark pairs in contrast to the relative effect on the acceptance for the measurements. Similar considerations are applicable to the PDF uncertainties. There is no straightforward way to correlate the LO, NLO, and NNLO PDF set uncertainties used in the measurements and in the prediction, respectively. However, given that the PDF uncertainty for the measurements is numerically much smaller than for the theoretical calculation, the assumed value of the correlation is not important.
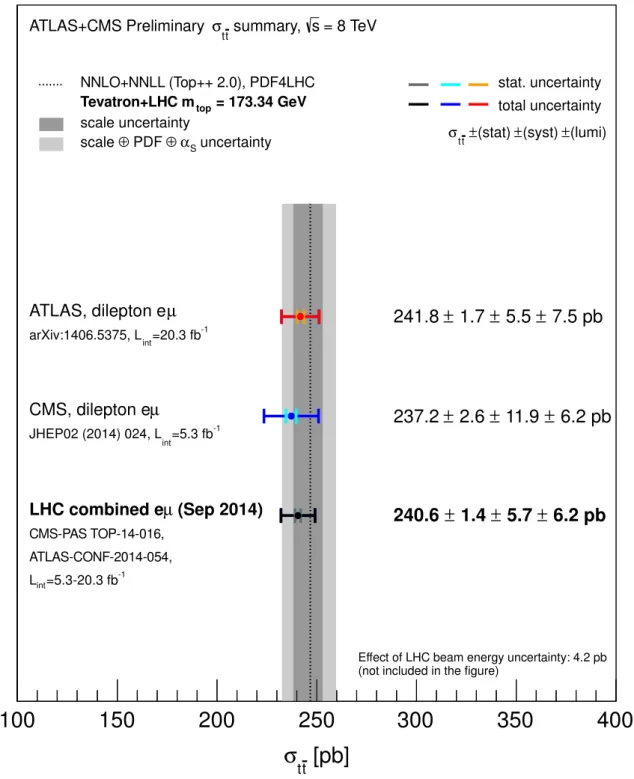
The experimental results and the theoretical prediction are also shown in Fig. 2 evaluated at the world average top quark mass of 173.34 GeV [50], using the dependence of the measured and predicted t¯t cross sections on the top quark mass. The small resulting shift improves the agreement between the measurements and the prediction.
6 Stability checks
The correlation assumptions summarized in Table 1 reflect the present understanding and the limitations due to the different choices made by the two experiments when evaluating the individual uncertainty sources. In order to evaluate the stability of the combined result with respect to the assumed correlations, variations of some of the input assumptions are performed, and the resulting central values and total uncertainties are compared to the nominal values. These are described in order of importance in the following. All performed tests show that the combined σ
t¯tresult is very stable against variations of the correlations between the systematic uncertainties with respect to the input assumptions.
6.1 Luminosity
Given the different approaches followed by the two experiments in the analysis of the van der Meer scans
and the assignment of uncertainties, the breakdown of the luminosity uncertainty into the correlated and
uncorrelated components is not unambiguously defined. For the default combined σ
t¯t, the correlated
part of both CMS and ATLAS measurements is set to the maximum estimated by the LHC luminosity
experts. To check the sensitivity of the combined cross section to this choice, the correlation between
ATLAS CMS Correlation LHC combination
Cross section [pb] 242.4 239.0 241.5
Uncertainty [pb]
Statistical 1.7 2.6 0 1.4
Detector model
Trigger 0.4 3.6 0 1.0
Lepton scale and resolution 1.2 0.2 0 0.9
Lepton identification 1.7 4.0 0 1.6
Jet resolution 1.2 3.0 0 1.2
Jet identification 0.1 − − 0.1
b-tagging 1.0 1.7 0 0.8
Pileup − 2.0 − 0.5
Non-JES subtotal 2.6 6.7 0 2.6
UncorrJES 0.6 4.3 0 1.2
InsituJES 0.6 0.6 0 0.5
IntercalibJES 0.3 0.1 0.5 0.2
FlavourJES 0.9 2.9 1 1.4
bJES 0.1 − − 0.1
JES subtotal 1.3 5.2 0.4 1.9
Class subtotal 2.9 8.5 3.2
Signal model
Scale 0.7 5.6 0.5 1.9
Radiation − 3.8 − 1.0
Generator and parton shower 3.0 3.3 0.5 2.7
PDF 2.7 0.5 1 2.1
Class subtotal 4.1 7.5 0.3 4.0
Background from data
Z+jets <0.1 1.5 0 0.4
Lepton misidentification 0.8 1.9 0 0.8
Class subtotal 0.8 2.4 0 0.9
Background from simulation
Dibosons 0.3 0.5 1 0.4
Single top quark 2.0 2.3 1 2.1
Class subtotal 2.0 2.4 1 2.1
Luminosity
Beam modelling 2.9 5.0 1 3.5
Luminosity determination 6.9 3.6 0 5.1
Class subtotal 7.5 6.2 0.3 6.2
Total systematic 9.3 13.4 8.4
Total 9.4 13.6 8.5
Table 1: Table of uncertainties in the t¯t cross section used in the BLUE combination. Cross sections and uncertainties are in pb. For the ATLAS measurement, the contribution from pileup effects is already included in the JES and in the Lepton identification uncertainties. The contribution from Radiation is also included in the latter. For the CMS measurement, the contribution from Jet identification is negligible.
The contribution from bJES is already included in the FlavourJES uncertainty.
[pb]
t
σ t
100 150 200 250 300 350 400
NNLO+NNLL (Top++ 2.0), PDF4LHC = 172.5 GeV
m
topscale uncertainty
uncertainty α
SPDF ⊕ scale ⊕
stat. uncertainty total uncertainty (lumi) (syst) ± (stat) ±
t
± σ
tEffect of LHC beam energy uncertainty: 4.2 pb (not included in the figure)
ATLAS, dilepton e µ
=20.3 fb
-1arXiv:1406.5375, L
int7.5 pb 5.5 ±
1.7 ± 242.4 ±
CMS, dilepton e µ
=5.3 fb
-1JHEP02 (2014) 024, L
int6.2 pb 11.9 ±
2.6 ± 239.0 ±
(Sep 2014) LHC combined e µ
CMS-PAS TOP-14-016, ATLAS-CONF-2014-054,
=5.3-20.3 fb
-1L
int6.2 pb 5.7 ±
1.4 ± 241.5 ±
= 8 TeV s
summary,
t
σ
tATLAS+CMS Preliminary
Figure 1: Input σ
t¯tmeasurements by the ATLAS and CMS collaborations and the result of the LHC
combination. The band corresponds to the NNLO+NNLL QCD calculation with Top++2.0 [7] of σ
t¯t=
252.9
+6.4−8.6(scale) ± 11.7 (PDF+α
S) pb for a top quark mass of 172.5 GeV. The uncertainty due to the
LHC beam energy is 4.2 pb and it is not included in the total uncertainty on the measurements or the
combination. This uncertainty has to be added in quadrature to the total uncertainty for the comparison
of the measurements with theoretical predictions.
[pb]
t
σ t
100 150 200 250 300 350 400
NNLO+NNLL (Top++ 2.0), PDF4LHC = 173.34 GeV Tevatron+LHC m
topscale uncertainty
uncertainty α
SPDF ⊕ scale ⊕
stat. uncertainty total uncertainty (lumi) (syst) ± (stat) ±
t
± σ
tEffect of LHC beam energy uncertainty: 4.2 pb (not included in the figure)
ATLAS, dilepton e µ
=20.3 fb
-1arXiv:1406.5375, L
int7.5 pb 5.5 ±
1.7 ± 241.8 ±
CMS, dilepton e µ
=5.3 fb
-1JHEP02 (2014) 024, L
int6.2 pb 11.9 ±
2.6 ± 237.2 ±
(Sep 2014) LHC combined e µ
CMS-PAS TOP-14-016, ATLAS-CONF-2014-054,
=5.3-20.3 fb
-1L
int6.2 pb 5.7 ±
1.4 ± 240.6 ±
= 8 TeV s
summary,
t