ATLAS-CONF-2014-012 24March2014
TOPLHC NOTE
ATLAS-CONF-2014-012 CMS PAS TOP-14-006
March 22, 2014
Combination of ATLAS and CMS t¯t charge asymmetry measurements using LHC proton-proton collisions at √
s = 7 TeV
The ATLAS and CMS Collaborations
1Abstract
A combination of measurements of the charge asymmetry in t¯t events performed by the ATLAS and CMS collaborations is presented. The analyzed datasets of LHC proton collisions at a centre-of-mass energy of 7 TeV correspond to an integrated luminosity of 4.7 fb
−1for ATLAS and 5.0 fb
−1for CMS. In both analyses events with a lepton
+jets sig- nature, i.e. one electron or muon and at least four jets, are analyzed. The resulting com- bined LHC measurement of the charge asymmetry in t¯t events at
√s =
7 TeV is
AC =0.005
±0.007(stat.)
±0.006(syst.), which is consistent with the prediction from the Standard Model.
1Work within the Top Physics LHC (TOP-LHC-WG) working group.
More information at http://twiki.cern.ch/twiki/bin/view/LHCPhysics/TopLHCWG.
c
Copyright 2014 CERN for the benefit of the ATLAS and CMS Collaborations.
Reproduction of this article or parts of it is allowed as specified in the CC-BY-3.0 license.
1 Introduction
At the Large Hadron Collider (LHC), most of the top quark-antiquark (t¯t) pairs are produced through gluon fusion (gg) and only a small fraction is produced via quark-antiquark annihilation (q¯q). The production of t¯t pairs via gluon fusion is symmetric with respect to the exchange of the top quark and antiquark. The same is true for the q¯q
→t¯t process at leading order (LO) in Quantum Chromodynamics (QCD). An asymmetry in differential distributions of top quarks and antiquarks is introduced by QCD higher order effects for events produced by quark-antiquark annihilation. Interference effects connect the direction of motion of the top quark to that of the incoming quark and the direction of motion of the top antiquark to that of the incoming antiquark. In pp collisions, as measured at the LHC, this connection leads to a measurable difference in angular distributions of top quark and antiquark since the initial quark and antiquark momenta in the protons are somewhat di
fferent. On average, quarks (valence and sea quarks) carry more momentum than the antiquarks (sea quarks), causing the rapidity distribution of top quarks to be broader than that of top antiquarks.
The charge asymmetry A
Cis defined as:
A
C =N
+−N
−N
++N
−,where N
+and N
−represent the number of events with
∆|y|=|yt| − |y¯t|>0 and
∆|y|<0, respectively.
The predicted value from QCD calculations within the Standard Model (SM) at the parton level (i.e.
before the top-quark decay) is A
SMC =0.0115
±0.0006 computed at next-to-leading order (NLO) in QCD including electroweak corrections [1]. The ATLAS and CMS Collaborations have performed measure- ments of A
Cin di
fferent decay channels using data collected during the 7 TeV runs of the LHC [2–5].
All measurements are consistent with the SM prediction.
This note reports on the combination of the ATLAS and CMS measurements of the t¯t charge asym- metry in the channel that yields the most precise values for the asymmetry, the lepton
+jets channel. In Section 2 the combination method is outlined, followed by a brief description of the two analyses and their results in Section 3. Section 4 summarizes the different sources of systematic uncertainties and their correlations. In Section 5 the results of the combination are presented, followed by a study on the stability of these results and on the dependence on the assumed correlations in Section 6.
2 Combination method
The two results are combined finding the Best Linear Unbiased Estimate (BLUE) [6, 7]. This method is well established and frequently used in the field of high-energy physics for the combination of corre- lated measurements. The BLUE method finds the coefficients to be used in a linear combination of the input measurements by minimizing the total uncertainty of the combined result taking into account both statistical and systematic uncertainties as well as their correlations.
3 Input measurements
The two analyses that are the inputs to this combination follow similar approaches to measure the t¯t charge asymmetry. In both cases events with exactly one isolated electron or muon and at least four jets are examined (“lepton+jets” channel). At least one of those jets has to be identified as originating from the hadronization of a b quark by dedicated tagging algorithms.
In both analyses each event is fully reconstructed under the assumption of being a t¯t event. The re-
constructed distribution of the sensitive variable,
∆|y|, is distorted by effects resulting from ambiguities in
the event reconstruction, finite detector resolution, and selection efficiencies. To allow for a comparison
of the measured asymmetry with theory prediction, the reconstructed
∆|y|distributions are corrected for the aforementioned e
ffects using unfolding techniques.
3.1 The ATLAS measurement
The ATLAS result used in the combination corresponds to the measurement at a centre-of-mass energy of 7 TeV with an integrated luminosity of 4.7 fb
−1in the lepton+jets channel [2]. Simulated t¯t events are modelled using the LO multi-parton matrix-element Monte Carlo generator A
lpgen[8] with the LO CTEQ6L1 [9] parton distribution function (PDF) for the proton. Parton showering and the underlying event are modelled using Herwig [10] and Jimmy [11]. The t¯t sample is generated assuming a top- quark mass of 172.5 GeV. Events are required to have missing transverse momentum larger than 30 GeV (20 GeV) in the electron
+jets (muon
+jets) channel and the transverse mass for the hadronically decaying W boson candidate has to be larger than 30 GeV in the electron+jets channel while in the muon+jets channel the sum of missing transverse momentum and transverse W boson mass has to be larger than 60 GeV. Jets originating from b quarks are identified by combining the information from three b-tagging algorithms, based on the topology of b and c-hadron weak decays inside jets and on the transverse and longitudinal impact parameter significance of each track within the jet. The chosen operating point corresponds to 70% tagging e
fficiency for b quarks and a rejection factor of about 150 for light-quark jets (corresponding to a 0.7% mistag rate) . These numbers are evaluated with simulated t¯t events.
After selection, the main background a
ffecting the measurement comes from W bosons produced in association with jets. Its normalization is evaluated using data, based on the fact that the production rate of W
++jets events is larger than that of W−+jets events, while the SM t¯t production has charge symmetricyields. The relative fraction of W bosons produced with jets coming from heavy flavour quarks is also estimated in data using events with exactly two jets in the final state. The other backgrounds are estimated using Monte Carlo (MC) simulation except for the contamination from multijet production. The multijet background is estimated using the ‘Matrix Method’ [12]. The method relies on defining ‘loose’ and
‘tight’ lepton samples and measuring the ‘tight’ selection e
fficiencies for real and background ‘loose’
leptons. After selection, the sample purity is around 80%.
A kinematic fit is used to determine the likelihood for candidates to be t¯t events [13] and to determine the four-vectors of the top quark and antiquark in order to compute
∆|y|. This likelihood takes as inputsthe measured energies, pseudorapidities and azimuthal angles of four jets, of the lepton, and the missing transverse momentum. For events with more than four jets, the combination leading to the highest likelihood is kept. The likelihood includes transfer functions associating the reconstructed quantities to the kinematic features of the quarks and leptons produced in the hard scattering as well as b-tagging information.
To correct for acceptance, detector and radiation e
ffects that distort the reconstructed
∆|y|distribu-
tions an unfolding technique is applied. ATLAS uses a Fully Bayesian Unfolding technique [14]. This
method relies on applying Bayes’ theorem to extract the parton-level asymmetry from the measured
spectrum. Regularization is applied through the choice of a non-flat prior and systematic uncertain-
ties are taken into account with a marginalization procedure. The likelihood used in the unfolding is
marginalized by integrating out its dependence on nuisance parameters. The resulting charge asymmetry
is found to be: A
C =0.006
±0.010. Estimating the systematic uncertainties using the likelihood directly
is di
fferent from the method used in CMS. As the marginalisation procedure does not allow to define a
unique error decomposition into uncorrelated sources of systematic uncertainty, the marginalised result
is not used in this analysis. Instead the result obtained with a simple error propagation strategy is used
for combination purposes: A
C =0.006
±0.010(stat.)
±0.005(syst.)
=0.006
±0.011 [2] (see Table 1).
3.2 The CMS measurement
The CMS result used for this combination is based on data taken with the CMS detector at a centre- of-mass energy of 7 TeV, corresponding to an integrated luminosity of 5 fb
−1[4]. For the simulation of t¯t signal events the NLO event generator P
owH
eg[15] is used with the NLO CTEQ6M PDF for the proton, interfaced with P
ythia[16] for the simulation of the showering. All background processes except for multijet production are simulated using MadGraph [17] interfaced with Pythia. The samples of generated t¯t and single top quark events are generated assuming a top-quark mass of 172.5 GeV. In order to model the multijet contribution, data events from a QCD enriched sideband region, defined by relaxing the criteria on the lepton isolation, are used.
As for the ATLAS measurement, events with a lepton+jets signature are investigated. At least one of the jets has to be identified as originating from the hadronization of a b quark by an algorithm that makes use of the track with the second highest impact parameter significance. The tagging efficiency of this algorithm is about 60% and the rejection factor is 100 (corresponding to a 1% mistag rate). In contrast to the ATLAS analysis, no requirement on the value of the missing transverse energy (MET) in the event is applied. Instead the discriminating power of the MET distribution is used together with that of the invariant mass of the three-jet combination that yields the highest vectorially summed transverse momentum (M3) to distinguish between background and signal events. With this method a signal fraction of about 80% is estimated. The largest background contribution comes from the production of W bosons in association with jets.
Each event is reconstructed under the assumption of being a t¯t event, assuming leading order top- quark decays. The leptonically decaying W boson is reconstructed from the measured charged lepton and the missing transverse energy, and the measured jets in the event are associated with the quarks in the t¯t decay. The ambiguities that arise in the reconstruction of the neutrino momentum and the jet- parton assignment are solved by choosing for each event the reconstruction hypothesis with the largest probability of being the best representation of the true t¯t event. Inputs to the calculation of this probability are the masses of the two reconstructed top quarks and of the reconstructed hadronically decaying W boson and the b-tagging information of the jets assigned to the final state quarks. The reconstructed masses enter the calculation via likelihood ratios, and the b tagger outputs are directly translated into probabilities. More details on the reconstruction procedure can be found in [18].
The resulting reconstructed
∆|y|distribution is corrected for background contributions and migration and efficiency effects by applying a regularized unfolding procedure [19] through a generalized matrix inversion method. The background processes are subtracted from the data, taking correlations among the individual contributions into account. The background-subtracted distribution is then transformed to the parton-level distribution before event selection. The distorting effects from selection efficiency and reconstruction resolution are described with a smearing matrix. The unfolded
∆|y|distribution is used to obtain the charge asymmetry: A
C =0.004
±0.010(stat.)
±0.011(syst.) (see Table 1).
4 Classification of uncertainties
In this section, the mapping of the ATLAS and CMS uncertainty categories and their assumed corre- lations used for the combination are described. The values for the different uncertainties are listed in Table 1. The stability of the combination under the assumed correlations is discussed in Section 6.
• Detector response modelling
(Correlation: 0)
The experimental sources of systematic uncertainties evaluated in the two measurements that are related to the modelling of the detectors are grouped together and are assumed to be uncorrelated.
The size of the di
fferent systematic uncertainties can be found in [2, 4]. Some small components
of these uncertainties on the jet energy scale and the b-tagging efficiency are known to be cor- related between the two experiments. These parts are negligible compared to the uncorrelated components. This category contains the uncertainties described below.
–
Jet energy scale (JES) and jet energy resolution (JER):
This category contains all sources of uncertainty coming from the jet energy calibration as well as from the jet energy resolution measured in data.
–
b-tagging efficiencies:
Scale factors are applied to the simulation to correct for small di
fferences between the e
ffi- ciencies for b jet identification in simulation and data. The uncertainty on these scale factors is propagated to the asymmetry measurement. In both analyses the impact on the measure- ment is found to be negligible.
–
Lepton e
fficiencies and momentum scale:
In ATLAS, the uncertainty on the lepton reconstruction and identification includes the uncer- tainty on the scale factors to correct the mismodelling of the lepton momentum, resolution and isolation in the simulation. In CMS, it includes the uncertainty on the scale factor to correct the lepton selection efficiency in simulation. This contribution is found to be neg- ligible in ATLAS. This category also includes the uncertainty coming from lepton charge mis-identification.
• Signal modelling
(Correlation: 1)
Several aspects of modelling the t¯t signal are examined to estimate a systematic uncertainty related to signal modelling. In both analyses the impact of using a di
fferent Monte Carlo event genera- tor (PowHeg instead of Alpgen in ATLAS and MadGraph instead of PowHeg in CMS) has been studied. Also the difference between the model of hadronization and parton shower implemented in P
ythiaand H
erwiginterfaced with the generators described above is taken as systematic un- certainty. In addition, variations by a factor 0.5 and 2.0 of the factorization and renormalization scales are also included. The impact of these uncertainties on the ATLAS measurement is neg- ligble. Since this source of uncertainty is zero for ATLAS, the assumed correlation here does not influence the combined result.
• Modelling of W+jets
(Correlation: 0.5)
In ATLAS the Alpgen factorization and renormalization scales are varied in the W+jets simula- tion with the same factors as for the signal model uncertainty. In CMS a different approach is pursued: the templates for W
+jets events with negatively charged leptons are interchanged with the templates for W+jets events with positively charged leptons. Further studies on collision data in a control region enriched in W+jets events without the b-tagging requirement are performed, to prove that possible di
fferences between real W
+jets events and simulation are well captured by the applied method. A 50% correlation is assumed between these two systematic uncertainties because the methods of the two experiments are different. Another assumption would not affect the result (see Section 6).
• Modelling of multijet production
(Correlation: 0)
In ATLAS, both the shape and normalization uncertainties on the multijet background are esti-
mated through the ‘Matrix Method’. The impact of this uncertainty on the asymmetry measure-
ment is found to be negligible. In the CMS analysis effects of shape variations on the
∆|y|-templatefrom the data-driven QCD model are examined by inverting for each event the sign of the
∆|y|value
to get an alternative shape.
• Pileup and MET
(Correlation: 0)
Pileup events are overlaid on the simulated signal and background events. In CMS the impact of a potential mismodelling of this component is estimated by varying the amount of pileup events.
The impact of this source of uncertainty on the CMS analysis is negligible. In ATLAS the MET calculation takes into account uncertainties in pileup modelling, in addition to propagated uncer- tainties on lepton and jet momenta. Since this source of uncertainty is zero for CMS, the assumed correlation here does not influence the combined result.
(Correlation: 1)
The systematic uncertainties arising from the choice of PDF for the colliding protons used in the simulation are estimated in CMS using the CTEQ6.6 [20] PDF set. ATLAS follows the same procedure as CMS, but takes two additional sets of PDFs into account (MSTW08 [22] and NNPDF2.0 [23]) in the estimation of the PDF uncertainty spread, as described in [21]. In both analyses the uncertainty is evaluated for the signal events as well as for the main background source, W+jets events.
• MC statistics of the migration matrix
(Correlation: 0)
In both analyses the impact of the statistical uncertainty in the response matrix, which is used in the unfolding procedure, is estimated by independently varying the individual elements of the response matrix within their statistical uncertainties.
• Model dependence
(Correlation: 0)
CMS estimates in addition the influence of possible dependences of the asymmetry on three kine- matic variables describing the t¯t system, namely its transverse momentum, rapidity and invari- ant mass. This study is done using pseudoexperiments from simulated signal events that are reweighted to produce asymmetries with a functional dependence of the mentioned kinematic variables. For several reweighting scenarios the differences between the true and measured asym- metries is evaluated and the average of the absolute values of the observed deviations is assigned as systematic uncertainty. Using MC samples with various axigluon models, ATLAS checked that the changes in t¯t kinematics induced by the presence of this type of new physics do not influence the measurement.
5 LHC combination
Assuming the uncertainties and their correlations as described in Section 4, the BLUE method is used to combine the two measurements from ATLAS and CMS. The combined value for the charge asymmetry in t¯t events at a centre-of-mass energy of 7 TeV is A
C =0.005
±0.007(stat.)
±0.006(syst.). Table 1 presents a breakdown of the uncertainties of the individual input measurements and of the combined measurement, along with the assumed uncertainty correlations between experiments. The
χ2for the combination is 0.012 per degree of freedom, corresponding to a probability of 91%. The ATLAS and CMS measurements have a 6% correlation as a result of the assumed correlations described in section 4.
The resulting BLUE coe
fficients or “central value weights” (CVW) of the two inputs can be found in Table 2 along with the pull values. The pull for a given input measurement i with an asymmetry A
iand a total error
σiis defined as:
A
i−A
cqσ2i −σ2Ac
where A
cand
σAcare the combination and its uncertainty. Following the proposal in [24] other quanti-
ties that characterize the impact of the single inputs and their interplay are also shown. The impact of
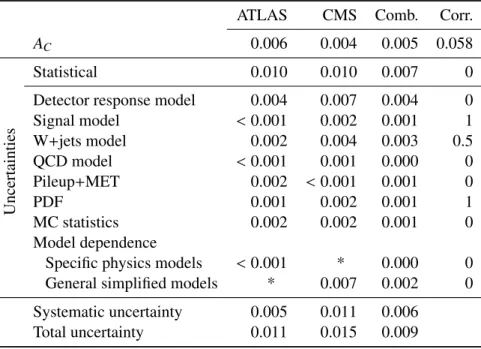
Table 1: Results and uncertainties of the single measurements and the combination along with the as- sumed correlations. The negligible systematic uncertainties (< 0.001) are set to zero in the actual com- bination. Uncertainties that are evaluated only in one analysis are marked (*) in the table and are set to zero in the combination for the experiment that did not evaluate them.
ATLAS CMS Comb. Corr.
A
C0.006 0.004 0.005 0.058
Uncertainties
Statistical 0.010 0.010 0.007 0
Detector response model 0.004 0.007 0.004 0
Signal model
<0.001 0.002 0.001 1
W
+jets model 0.002 0.004 0.003 0.5
QCD model
<0.001 0.001 0.000 0
Pileup+MET 0.002
<0.001 0.001 0
PDF 0.001 0.002 0.001 1
MC statistics 0.002 0.002 0.001 0
Model dependence
Specific physics models
<0.001 * 0.000 0 General simplified models * 0.007 0.002 0 Systematic uncertainty 0.005 0.011 0.006
Total uncertainty 0.011 0.015 0.009
the input measurements is estimated using the Fisher information concept. The “intrinsic information weight” (IIW) for a given input measurement i with total error
σiis the ratio of the information that this measurement carries when taken alone to the total available information of the combination:
IIW
i =1/σ
2i1/σ
2Acand the “marginal information weight” (MIW) is defined as the additional information brought by a measurement when adding this measurement to the combination that includes the other inputs:
MIW
i =1/σ
2n.meas−1/σ
2n−1 meas.: all buti1/σ
2n.meas .Table 2: Weights and pulls of the two correlated estimates. Listed are the central value weight (CVW), the intrinsic information weight (IIW), and the marginal information weight (MIW).
Estimate CVW [%] IIW [%] MIW [%] Pull
ATLAS 64.6 67.3 61.7 0.109
CMS 35.4 38.3 32.7 -0.109
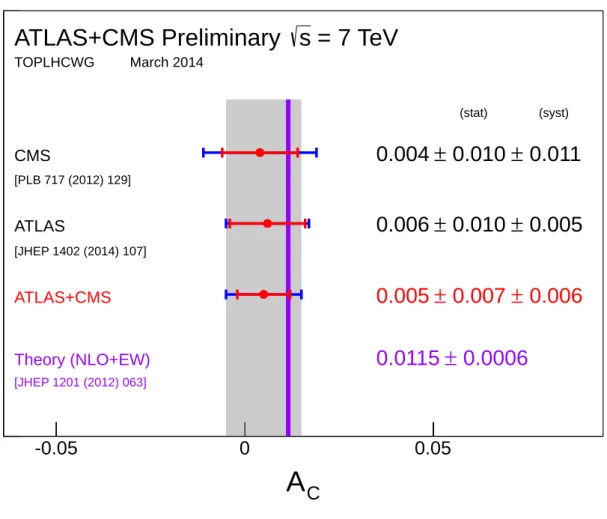
The individual results and the combined result are summarized and compared to the prediction from
SM calculations in Fig. 1.
A C
-0.05 0 0.05
-2 4
ATLAS+CMS
0.005 ± 0.007 ± 0.006
ATLAS
0.006 ± 0.010 ± 0.005
CMS
0.004 ± 0.010 ± 0.011
[PLB 717 (2012) 129]
[JHEP 1402 (2014) 107]
0.0006
± 0.0115
Theory (NLO+EW)
[JHEP 1201 (2012) 063]
(stat) (syst)
= 7 TeV s
ATLAS+CMS Preliminary
TOPLHCWG March 2014