ATLAS-CONF-2020-057 05November2020
ATLAS CONF Note
ATLAS-CONF-2020-057
27th October 2020
Determination of the parton distribution functions of the proton from ATLAS measurements of
differential 𝑾
±and 𝒁 boson production in association with jets
The ATLAS Collaboration
This article presents a new set of proton parton distribution functions, ATLASepWZVjet20, produced in an analysis at next-to-next-to-leading-order in QCD. The new datasets considered are the ATLAS measurements of𝑊+,𝑊−and𝑍 boson production in association with jets in 𝑝 𝑝collisions at
√
𝑠 =8 TeV at the LHC with integrated luminosities of 20.2 fb−1and 19.9 fb−1, respectively. The analysis also considers the ATLAS measurements of differential𝑊±and𝑍 boson production at
√
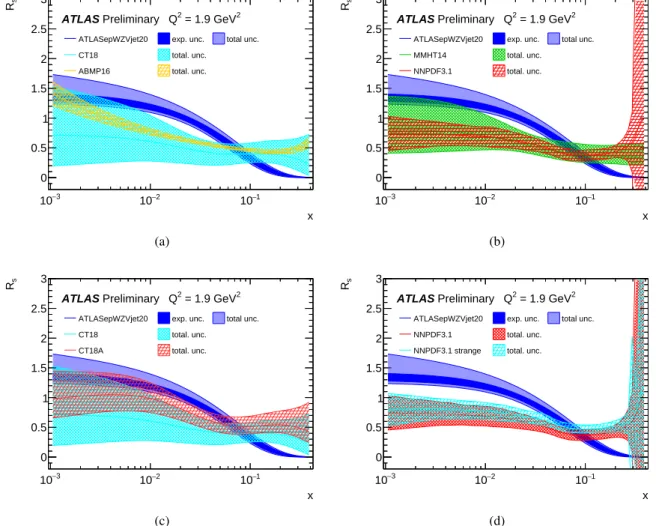
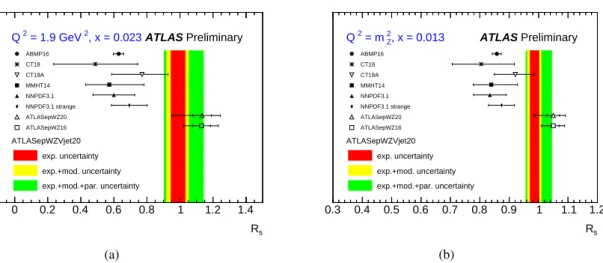
𝑠 =7 TeV with an integrated luminosity of 4.6 fb−1and deep-inelastic scattering data from𝑒±𝑝collisions at the HERA accelerator. An improved determination of the sea-quark densities at high Bjorken𝑥is shown, while confirming a strange-quark density of similar size as the up-and down-sea quark densities in the range𝑥 .0.02 found by previous ATLAS analyses.
© 2020 CERN for the benefit of the ATLAS Collaboration.
Reproduction of this article or parts of it is allowed as specified in the CC-BY-4.0 license.
1 Introduction
Precise knowledge of the content of colliding protons, the parton distribution functions (PDFs), is a necessary ingredient for accurate predictions of both Standard Model (SM) and Beyond Standard Model (BSM) cross sections at the Large Hadron Collider (LHC). In order to determine the PDFs to the required precision, data covering a wide range of negative four-momentum transfer,𝑄2, and Bjorken𝑥, the fraction of the proton’s longitudinal momentum carried by the parton initiating the interaction, is required. This is facilitated by combining data from multiple experiments and measurements of various processes to better constrain the𝑥-dependence and flavour decomposition of the PDFs. While deep inelastic scattering (DIS) data from lepton-hadron collisions typically deliver the best constraints by utilising the lepton as a direct probe of the substructure of the hadron, a hadron-hadron experiment can provide valuable additional insight by introducing new processes which further distinguish contributions from different partons and span kinematic regions at higher𝑄2.
Precision measurements by the HERA collaborations [1] of neutral (NC) and charged current (CC) cross sections in𝑒±𝑝scattering constrain PDFs such that the HERA DIS data alone provide sufficient information to give the PDF set referred to as HERAPDF2.0. However, they do have limitations. For example, they cannot distinguish quark flavour between the down-type sea quarks, ¯𝑑and ¯𝑠. Global PDF analyses [2–5]
use a range of data from other experiments together with the HERA data for further constraining power. For example, additional information about quarks and antiquarks from mid to high-𝑥comes from fixed-target DIS experiments, as well as𝑊±and𝑍data from the Tevatron and LHC experiments.
More information about high-𝑥quarks would be advantageous since a large fraction of the fixed target DIS data is in a kinematic region where non-perturbative effects, such as those from higher twist, are important and must be computed from phenomenological models [6,7]. In many PDF analyses, tight cuts are applied to these data to avoid those effects. Furthermore, the interpretation of DIS data using deuteron or heavier nuclei as targets is subject to uncertain nuclear corrections. The𝑊±asymmetry measurements performed using𝑝𝑝¯collisions at Tevatron are free from these uncertainties, but there have historically been tensions between the results of the CDF [8] and DØ [9] collaborations, discussed in further detail by the MSTW group in Ref. [10].
Precision measurements from the ATLAS detector at the LHC, together with data from the HERA experiments, have been interpreted previously in a next-to-next-to-leading-order (NNLO) QCD analysis, resulting in the ATLASepWZ16 PDF set [11]. Differential𝑊and𝑍/𝛾∗boson cross sections at
√
𝑠= 7 TeV were used, thereby allowing the strange content of the sea to be fitted, rather than assumed to be a fixed fraction of the light sea as is required when fitting HERA inclusive data alone. It was found that these additional data were significantly better described by a strange sea unsuppresed with respect to the up- and down-quark sea at𝑥 . 0.05, in contradiction to previous assumptions based on data of dimuon production from muon-neutrino CC DIS with associated charm-quark production [12]. This observation is supported by the ATLAS measurement of𝑊-boson production in association with a charm quark (𝑊+𝑐) at 7 TeV [13], however a recent analysis of CMS𝑊+𝑐7 and 13 TeV data [14] has found a suppressed strange-quark density relative to the light sea, which is potentially in tension with these ATLAS findings.
Data on the production of a vector boson in association with jets at the LHC provides a novel source of input to PDF determination that is sensitive to partons at higher𝑥than can be accessed by𝑊and𝑍data alone [15]. The tree-level production modes of the production of a vector boson in association with jets, referred to as𝑉+ jets, are either quark–antiquark initial states with gluon radiation, or quark–gluon initial states. The process is therefore already sensitive to the gluon density of the proton at leading order in
quantum chromodynamics (QCD), while providing constraints on the quark distributions in a similar way to inclusive production of a vector boson. Both production modes require a higher𝑥and𝑄2in comparison to inclusive production, thereby yielding a complementary data set to the inclusive𝑊 , 𝑍measurements.
This paper presents a PDF analysis including data on𝑊±+ jets and𝑍+ jets production collected in 𝑝 𝑝 collisions at
√
𝑠=8 TeV by the ATLAS collaboration [16,17] in combination with the previous inclusive 𝑊 , 𝑍 measurement at
√
𝑠 =7 TeV [11] and the combination of inclusive combined HERA data [1]. The PDF fit is performed at NNLO in perturbative QCD, made possible by recent theoretical developments for vector boson production in association with one jet [18,19], and accounts for the systematic correlations between data sets. The resulting PDF set is calledATLASepWZVjet20.
2 Input data sets
The final combined𝑒±𝑝cross section measurements at HERA [1] cover the kinematic range of𝑄2from 0.045 GeV2to 50 000 GeV2and of Bjorken𝑥 from 0.65 down to 6×10⁻⁷. Data below𝑥 =10−5are not used in this analysis by requiring𝑄2>10 GeV2, motivated by the previously-observed worse fit quality in the removed kinematic region compared to the rest of the HERA data [1]. This was recently explained by the need for resummation corrections at low𝑥[20], and further motivated by the impact of higher-twist corrections. For the final HERA data set, there are 169 correlated sources of uncertainty. Total uncertainties are below 1.5% over the𝑄2range of 10< 𝑄2<500 GeV2and below 3% up to𝑄2=3 000 GeV2. The ATLAS√ 𝑊 , 𝑍 differential cross sections are based on data recorded during 𝑝 𝑝 collisions with
𝑠=7 TeV, and a total integrated luminosity of 4.6 fb−1, in the electron and muon boson decay channels [11]. The𝑊±differential cross sections are measured as functions of the𝑊decay lepton pseudorapidity, 𝜂ℓ, split into𝑊+and𝑊−cross sections. The experimental precision is between 0.6% and 1.0%. Double- differential distributions of the dilepton rapidity,𝑦
ℓ ℓ, in𝑍/𝛾∗boson decays are measured in three mass ranges: 46< 𝑚
ℓ ℓ < 66 GeV, 66< 𝑚
ℓ ℓ < 116 GeV and 116 < 𝑚
ℓ ℓ < 150 GeV in central (|𝑦
ℓ ℓ| < 2.4) and forward (1.2< |𝑦
ℓ ℓ|< 3.6) rapidity ranges, with an experimental precision of up to 0.4% for central rapidity and 2.3% for forward rapidity. The luminosity of the data set used for the 7 TeV𝑊 , 𝑍cross-section measurement is known to within 1.8%. There are a total of 131 sources of correlated systematic uncertainty across the𝑊and𝑍 data sets [11]. These data were used for the ATLASepWZ16 fit in a format in which the measurements of the electron and muon decay channels were combined, whereas the current analysis uses the data before this combination. This choice was made as the uncombined data retain the physical origin of the sources of correlated uncertainties, thereby allowing to correlate sources to other data sets.
The ATLAS√ 𝑊±+ jets differential cross sections are based on data recorded during 𝑝 𝑝collisions with 𝑠=8 TeV and a total integrated luminosity of 20.2 fb−1, in the electron decay channel only [16]. Each event contains at least one jet with transverse momentum𝑝
T >30 GeV and rapidity|𝑦|< 4.4, where jets are defined using the anti-𝑘
𝑡 algorithm [21,22] with a radius parameter𝑅=0.4. The spectrum used is the transverse momentum of the𝑊boson (𝑝𝑊
T ), in the range 25< 𝑝𝑊
T <800 GeV, chosen as it provides the most constraining power. This is split into𝑊+and𝑊−cross sections, which have large correlations that are fully considered. The experimental uncertainty ranges from 8.2% to 22.1% [16]. There are 50 sources of correlated systematic uncertainty common between the𝑊+and𝑊−spectra, as well as three sources of uncorrelated uncertainties related to data statistics, background Monte Carlo (MC) simulation statistics and the statistical uncertainty of the data-driven multijet background estimation. Full information on the statistical bin-to-bin correlations in data is available for each𝑊+ jets spectrum.
The ATLAS𝑍+ jets double-differential cross sections are also based on data recorded during𝑝 𝑝collisions with
√
𝑠=8 TeV and a total integrated luminosity of 19.9 fb−1, in the𝑍 →𝑒+𝑒−decay channel [17]. The measurement is performed as a function of the absolute rapidity of inclusive anti-𝑘
𝑡 𝑅=0.4 jets,|𝑦jet|, for several bins of the transverse momentum within 25 GeV< 𝑝jet
T
< 1050 GeV. The experimental precision ranges from 4.7% to 37.1%. There are 42 sources of correlated systematic uncertainty and two sources of uncorrelated uncertainty relating to the data and background MC simulation statistics.
The luminosity of the data set used for the𝑊+ jets and𝑍 + jets cross section measurements is known to within 1.9%. Systematic uncertainties which contribute significantly, such as the jet energy scale, are treated as correlated across data sets if they correspond to the same physical source. More details of the correlation model used in this analysis are given in AppendixA.
3 Fit framework
This determination of proton PDFs uses the xFitter framework, v2.0.1 [1,23,24]. This program interfaces to theoretical calculations directly or uses fast interpolation grids to make theoretical predictions for the considered processes. The program MINUIT [25] is used for the minimisation of the PDF fit. The results are cross-checked with an independent fit framework [26].
For the DIS processes, coefficient functions with massless quarks are calculated at NNLO as implemented in QCDNUM v17-01-13 [27]. The contributions of heavy quarks are calculated in the general-mass variable-flavour-number scheme of Refs. [28–30]. The renormalisation and factorisation scales for the DIS processes are taken as𝜇
𝑟 =𝜇
𝑓 = q
𝑄2.
For the differential𝑊 and𝑍/𝛾∗boson cross sections, the theoretical framework is the same as that used in the ATLASepWZ16 analysis of Ref. [11]. The xFitter package uses outputs from the APPLGRID code [31]
interfaced to the MCFM program [32,33] for fast calculation of the differential cross sections at NLO in QCD and LO in electroweak (EW) couplings. Corrections to higher orders are implemented using a 𝐾-factor technique, correcting on a bin-by-bin basis from NLO to NNLO in QCD and from LO to NLO for the EW contribution [34,35].
Predictions for𝑊+ jets and𝑍 + jets production are obtained similarly to the𝑊 , 𝑍predictions to NLO in QCD and LO in EW by using the APPLGRID code interfaced to the MCFM program. Higher-order corrections are implemented as𝐾-factors. For the𝑊+ jets data, the𝑁
jettiprogram [18] is used to calculate and implement corrections to NNLO in QCD, while the non-perturbative hadronisation and underlying event QCD corrections are computed using the Sherpa v. 2.2.1 MC simulation, as discussed in the publication of the ATLAS measurement [16]. The bin-by-bin𝐾-factors are derived as the ratio of the NNLO to the NLO calculation from𝑁
jettiwith the same fiducial selection as the𝑊+ jets data, multiplied by the non-perturbative correction. The renormalisation and factorisation scales are set to𝜇
R/F= q
𝑚2
𝑊 +Σ(𝑝
𝑗 T)2, where the second term in the square root is the scalar sum of the transverse momenta of the jets. More details about the predictions are given in the respective ATLAS publication [16]. In addition to these predictions, NLO EW corrections inclusive of QED radiation effects are computed using Sherpa by the authors of Refs. [36–38] and applied as additional bin-by-bin multiplicative𝐾-factors.
Predictions for𝑍 + jets production to NNLO in QCD and LO in EW are calculated by the authors of Ref. [19], and the𝐾-factor is calculated as the ratio of the NNLO and NLO predictions. The renormalisation
and factorisation scales are set to𝜇
𝑅 =𝜇
𝐹 = 1
2( q
𝑚2
ℓ ℓ+𝑝2
T,ℓ ℓ+Σ𝑝
T,partons)where𝑚
ℓ ℓis the electron pair invariant mass, 𝑝
T,ℓ ℓ is the transverse momentum of the electron pair andΣ𝑝
T,partons is the sum of the transverse momenta of the outgoing partons. Corrections for QED radiation effects and non-perturbative QCD corrections are each calculated using the Sherpa v.1.4.5 MC simulation, as discussed in the publication of the ATLAS measurement [17], and each provided as a set of bin-by-bin multiplicative 𝐾-factors. Corrections for NLO EW effects excluding QED radiation are computed using Sherpa v2.2.10 and applied as additional bin-by-bin𝐾-factors. The𝐾-factors for both𝑊+ jets and𝑍+ jets production are typically within 10% of unity, except for the NLO EW corrections for the𝑊+ jets predictions which are up to 20% at high𝑝
𝑊 T .
The DGLAP evolution equations of QCD yield the proton PDFs at any value of𝑄2given that they are parameterised as functions of𝑥 at an initial scale𝑄2
0. In this analysis, the initial scale is chosen to be 𝑄2
0=1.9 GeV2such that it is below the charm-mass matching scale,𝜇2
𝑐, which is set equal to the charm mass,𝜇
𝑐 =𝑚
𝑐. The heavy quark masses are set to their pole masses as determined by a combined analysis of HERA data on inclusive and heavy-flavour DIS processes [1,39],𝑚
𝑐 =1.43 GeV and𝑚
𝑏 =4.5 GeV, and the strong coupling constant is fixed to𝛼
𝑆(𝑚
𝑍) =0.118. These choices follow those of the HERAPDF2.0 fit [1].
The quark distributions at the initial scale are assumed to behave according to the following parameterisation also used by the HERAPDF2.0 and ATLASepWZ16 fits [1,11]
𝑥 𝑞𝑖(𝑥) = 𝐴
𝑖𝑥
𝐵
𝑖(1−𝑥)𝐶𝑖𝑃
𝑖(𝑥), (1)
where𝑃
𝑖(𝑥) = (1+𝐷
𝑖𝑥+𝐸
𝑖𝑥2)𝑒
𝐹 𝑖𝑥
. The parameterised quark distributions,𝑥 𝑞
𝑖, are chosen to be the valence quark distributions (𝑥 𝑢
𝑣, 𝑥 𝑑
𝑣) and the light antiquark distributions (𝑥𝑢,¯ 𝑥𝑑 ,¯ 𝑥𝑠¯). The gluon distribution is parameterised with the more flexible form
𝑥 𝑔(𝑥)= 𝐴
𝑔𝑥𝐵𝑔(1−𝑥)𝐶𝑔𝑃
𝑔(𝑥) −𝐴0
𝑔𝑥𝐵
0
𝑔(1−𝑥)𝐶𝑔0, (2)
where𝐶0
𝑔is fixed to a value of 25 to suppress negative contributions of the primed term at high𝑥, as in Ref. [10]. The parameters 𝐴
𝑢𝑣 and𝐴
𝑑𝑣 are constrained using the quark counting rules, and𝐴
𝑔using the momentum sum rule. The normalisation and slope parameters,𝐴and𝐵, of the ¯𝑢and ¯𝑑PDFs are set equal such that𝑥𝑢¯ =𝑥𝑑¯as𝑥 →0. The strange PDF𝑥𝑠¯is parameterised as in Eq. (1), with𝑃
¯
𝑠 =1 and𝐵
¯ 𝑠 =𝐵
¯ 𝑑, leaving two free strangeness parameters,𝐴
¯ 𝑠and𝐶
¯
𝑠. It is assumed that𝑥 𝑠=𝑥𝑠¯as the data used are not sufficient to distinguish between the two.
The𝐷 , 𝐸 and𝐹terms in the expression𝑃
𝑖(𝑥)are used only if required by the data, following the procedure described in Ref. [1]. For the ATLASepWZVjet20 fit, this results in the usage of two additional parameters:
𝐸𝑢
𝑣 and𝐷
𝑔. There are 16 free parameters used in total in the central fit.
The agreement of the data with the predictions from a PDF parameterisation is quantified with a 𝜒2. The definition of the𝜒2without statistical correlations between data points is as follows [1,11]
𝜒2=Õ
𝑖
[𝐷
𝑖−𝑇
𝑖(1−Í
𝑗
𝛾𝑖 𝑗𝑏
𝑗)]2 𝛿2
𝑖 ,uncor𝑇2
𝑖 +𝛿2
𝑖 ,stat𝐷
𝑖𝑇
𝑖
+Õ
𝑗
𝑏2
𝑗+Õ
𝑖
log 𝛿2
𝑖 ,uncor𝑇2
𝑖 +𝛿2
𝑖 ,stat𝐷
𝑖𝑇
𝑖
𝛿2
𝑖 ,uncor𝐷2
𝑖 +𝛿2
𝑖 ,stat𝐷2
𝑖
, (3)
where𝐷
𝑖represent the measured data,𝑇
𝑖the corresponding theoretical prediction,𝛿
𝑖 ,uncorand𝛿
𝑖 ,statare the uncorrelated systematic and statistical uncertainties on𝐷
𝑖, and correlated systematics, described by
𝛾𝑖 𝑗, are accounted for using the nuisance parameters𝑏
𝑗. The summation over𝑖runs over all data points and the summation over 𝑗 runs over all sources of correlated systematics. For each data set, the first term gives thepartial𝜒2and the second term gives thecorrelated 𝜒2. The third term is a bias correction term arising from the transition of the likelihood to𝜒2when the scaling of errors is applied, referred to as the log penalty. For the𝑊+ jets data, the bin-to-bin statistical correlations are significant in contrast to the other data sets and incorporated into the𝜒2definition as follows [40]
𝜒2=Õ
𝑖 𝑘
𝐷𝑖−𝑇
𝑖(1−Õ
𝑗
𝛾𝑖 𝑗𝑏
𝑗)
! 𝐶−1
stat,𝑖 𝑘(𝐷
𝑖, 𝐷
𝑘) 𝐷
𝑘−𝑇
𝑘(1−Õ
𝑗
𝛾𝑘 𝑗𝑏
𝑗)
!
+Õ
𝑗
𝑏2
𝑗
+Õ
𝑖
log 𝛿2
𝑖 ,uncor𝑇2
𝑖 +𝛿2
𝑖 ,stat𝐷
𝑖𝑇
𝑖
𝛿2
𝑖 ,uncor𝐷2
𝑖 +𝛿2
𝑖 ,stat𝐷2
𝑖
,
(4)
in which the first term has been replaced with one which takes into account the diagonal and off-diagonal elements of the data statistical covariance matrix between bins𝑖and𝑘,𝐶
stat,𝑖 𝑘.
4 Results
Throughout this section, the presented ATLASepWZVjet20 PDFs are compared to a equivalent fit without the𝑉+ jets data, labelled ATLASepWZ20. Although these PDFs differ from the ATLASepWZ16 analysis by an additional parameter,𝐷
𝑔, a tighter selection criteria of𝑄2>10 GeV2and the use of ATLAS 7 TeV 𝑊 , 𝑍 data in which the electron and muon channels have not been combined, the result is very similar except for a larger total uncertainty resulting from the use of more parameterisation variations. It was verified that the use of 7 TeV𝑊 , 𝑍 data with the combination of electron and muon channels provides a fit with very similar central values and uncertainties.
4.1 Goodness of fit and parton distributions
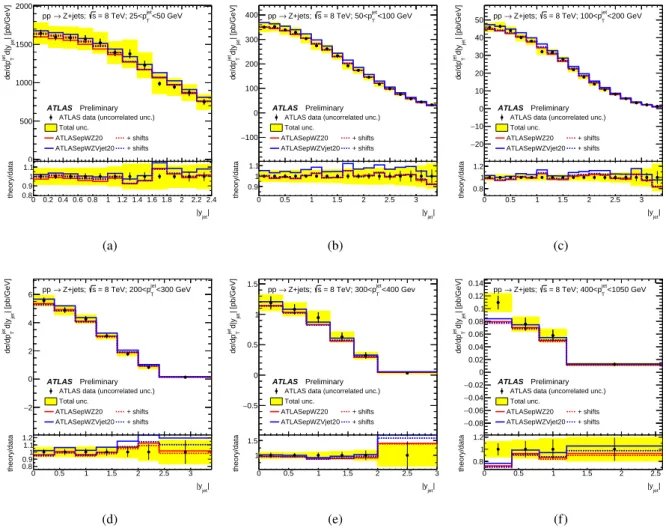
Figures1and2display a comparison of the𝑊+ jets and 𝑍+ jets differential cross section measurements with the predictions for each of the ATLASepWZ20 and ATLASepWZVjet20 fits. Adding the𝑉+ jets data to the fit, giving the ATLASepWZVjet20 PDFs, improves the𝑊+ jets description significantly, particularly in the𝑊+spectrum where the agreement improves by approximately 20% at high𝑝
𝑊
T . The difference in partial𝜒2between the predictions of the ATLASepWZ20 and ATLASepWZVjet20 PDF sets for the𝑊 + jets and the𝑍+ jets data is 32 and 7 units, respectively.
The total 𝜒2per degree of freedom (NDF) for the ATLASepWZVjet20 fit, along with the partial𝜒2per data point (NDP) and correlated𝜒2for each data set entering the fit, is given in Table1. The partial𝜒2 for the HERA and ATLAS inclusive𝑊 , 𝑍data in fits including the additional data are similar to those obtained in fits without these additional data, demonstrating that there is no tension between these sets. The partial𝜒2of the𝑊+ jets and𝑍 + jets data is reasonable, and neither the HERA nor ATLAS correlated𝜒2 is observed to increase significantly with the inclusion of this data.
Additional uncertainties in the PDFs are estimated and classified as model and parameterisation uncertainties.
Model uncertainties comprise variations of the charm-quark mass (𝑚
𝑐) and bottom-quark mass (𝑚
𝑏),
[GeV]
W
pT
W+
30 40 50 102 2×10²
[fb/GeV] W T/dpσ d
−1
10 1 10 102
103
104
= 8 TeV s +jets;
W+
→ pp
ATLAS Preliminary
ATLAS data (uncorrelated unc.) Total unc.
ATLASepWZ20 + shifts ATLASepWZVjet20 + shifts
[GeV]
W
pT
W+
30 40 50 102 2×10² theory/data 0.6
0.8 1 1.2
(a)
[GeV]
W
pT
W −
30 40 50 102 2×10²
[fb/GeV] W T/dpσ d
−2
10
−1
10 1 10 102
103
104 pp → W −+jets; s = 8 TeV
ATLAS Preliminary
ATLAS data (uncorrelated unc.) Total unc.
ATLASepWZ20 + shifts ATLASepWZVjet20 + shifts
[GeV]
W
pT
W −
30 40 50 102 2×10²
theory/data
0.8 1 1.2
(b)
Figure 1: The differential cross sections of (a)𝑊++ jets and (b)𝑊−+ jets of Ref. [16] (black points) as a function of the transverse momentum of the𝑊 boson, 𝑝
𝑊
T . The bin-to-bin uncorrelated part of the data uncertainties is shown as black error bars, while the total uncertainties are shown as a yellow band. The cross sections are compared to the predictions computed with the predetermined PDFs resulting from the fits ATLASepWZ20 (red lines) and ATLASepWZVjet20 (blue lines). The solid lines show the predictions without shifts of the systematic uncertainties, while for the dashed lines the𝑏
𝑗parameters associated with the experimental systematic uncertainties as shown in Eq. (4) are allowed to vary to minimise the𝜒2.
Table 1:𝜒2values split by partial, correlated and log penalty for each data set entering the ATLASepWZVjet20 fit.
The partial component of the 𝜒2for each data set is shown compared to the number of data points of that data set (NDP).
Fit ATLASepWZVjet20
Total𝜒2/NDF 1460 / 1198
HERA partial𝜒2/NDP 1132 / 1016
HERA correlated 𝜒2 50
HERA log penalty𝜒2 -12
ATLAS𝑊 , 𝑍 partial𝜒2/NDP 113/105 ATLAS𝑊 + jets partial𝜒2/NDP 25/30 ATLAS𝑍+ jets partial 𝜒2/NDP 82/63
ATLAS correlated𝜒2 65
ATLAS log penalty 𝜒2 6
variations of the minimum𝑄2cut,𝑄2
min, and the starting scale at which the PDFs are parameterised,𝑄2
0. The variation in charm-quark mass and starting scale are performed simultaneously to fulfill the condition 𝑄2
0 < 𝑚2
𝑐such that the charm PDF is calculated perturbatively. Each of these variations follow that of the
jet| |y 0 0.2 0.4 0.6 0.8 1 1.2 1.4 1.6 1.8 2 2.2 2.4
| [pb/GeV]jetd|yjet T/dpσ d
0 500 1000 1500 2000
<50 GeV jet = 8 TeV; 25<pT s
Z+jets;
→ pp
ATLAS Preliminary ATLAS data (uncorrelated unc.) Total unc.
ATLASepWZ20 + shifts ATLASepWZVjet20 + shifts
jet| |y 0 0.2 0.4 0.6 0.8 1 1.2 1.4 1.6 1.8 2 2.2 2.4 theory/data 0.8
0.9 1 1.1
(a)
jet| |y
0 0.5 1 1.5 2 2.5 3
| [pb/GeV]jetd|yjet T/dpσ d
−100 0 100 200 300
400 pp → Z+jets; s = 8 TeV; 50<pjetT<100 GeV
ATLAS Preliminary ATLAS data (uncorrelated unc.) Total unc.
ATLASepWZ20 + shifts ATLASepWZVjet20 + shifts
jet| |y
0 0.5 1 1.5 2 2.5 3
theory/data
0.9 1 1.1
(b)
jet| |y
0 0.5 1 1.5 2 2.5 3
| [pb/GeV]jetd|yjet T/dpσ d
−20
−10 0 10 20 30 40
50 pp → Z+jets; s = 8 TeV; 100<pjetT<200 GeV
ATLAS Preliminary ATLAS data (uncorrelated unc.) Total unc.
ATLASepWZ20 + shifts ATLASepWZVjet20 + shifts
jet| |y
0 0.5 1 1.5 2 2.5 3
theory/data 0.8 1 1.2
(c)
jet| |y
0 0.5 1 1.5 2 2.5 3
| [pb/GeV]jetd|yjet T/dpσ d
−2 0 2 4
6 jet<300 GeV
= 8 TeV; 200<pT s
Z+jets;
→ pp
ATLAS Preliminary ATLAS data (uncorrelated unc.) Total unc.
ATLASepWZ20 + shifts ATLASepWZVjet20 + shifts
jet| |y
0 0.5 1 1.5 2 2.5 3
theory/data 0.80.911.1 1.2
(d)
jet| |y
0 0.5 1 1.5 2 2.5 3
| [pb/GeV]jetd|yjet T/dpσ d
−0.5 0 0.5 1
1.5 jet<400 Gev
= 8 TeV; 300<pT s
Z+jets;
→ pp
ATLAS Preliminary ATLAS data (uncorrelated unc.) Total unc.
ATLASepWZ20 + shifts ATLASepWZVjet20 + shifts
jet| |y
0 0.5 1 1.5 2 2.5 3
theory/data
1 1.5
(e)
jet| |y
0 0.5 1 1.5 2 2.5
| [pb/GeV]jetd|yjet T/dpσ d
−0.08
−0.06
−0.04
−0.02 0 0.02 0.04 0.06 0.08 0.1 0.12 0.14
<1050 GeV jet = 8 TeV; 400<pT s
Z+jets;
→ pp
ATLAS Preliminary ATLAS data (uncorrelated unc.) Total unc.
ATLASepWZ20 + shifts ATLASepWZVjet20 + shifts
jet| |y
0 0.5 1 1.5 2 2.5
theory/data
0.8 1 1.2
(f)
Figure 2: The differential cross sections of𝑍+ jets as a function of the absolute rapidity of inclusive jets,|𝑦jet|, in bins of (a) 25< 𝑝jet
T <50 GeV, (b) 50< 𝑝jet
T <100 GeV, (c) 100< 𝑝jet
T <200 GeV, (d) 200< 𝑝jet
T <300 GeV, (e) 300< 𝑝jet
T <400 GeV and (f) 400< 𝑝jet
T <1050 GeV, respectively, where the transverse momentum of inclusive jets is labelled𝑝jet
T. The bin-to-bin uncorrelated part of the data uncertainties is shown as black error bars, while the total uncertainties are shown as a yellow band. The cross sections are compared to the predictions computed with the PDFs resulting from the fits ATLASepWZ20 (red lines) and ATLASepWZVjet20 (blue lines). The solid lines show the predictions without shifts of the systematic uncertainties, while for the dashed lines the shifts with fitted𝑏𝑗 parameters as shown in Eq. (4) are applied.
ATLASepWZ16 analysis [11]. The parameterisation uncertainties are estimated through variations which include a single further parameter in the polynomial𝑃
𝑖(𝑥) or relaxed constraints of the low-𝑥 sea quarks.
In each variation, listed with its respective total𝜒2per degree of freedom in Table2, the uncertainty is calculated as the difference between the alternative extracted PDF and the nominal PDF at each value of𝑥 and𝑄2. Whereas the model variations are treated independently and the model uncertainty is calculated as the sum in quadrature of the variations, the parameterisation uncertainty is taken as the envelope of the parameterisation variations. The total uncertainty is calculated as the sum in quadrature of the experimental, model and parameterisation uncertainties. While the total uncertainty does give a measure of the total variability of the fit, only the experimental uncertainty is interpretable as a statistical standard deviation.
The effect of theoretical uncertainties in the 𝑉 + jets predictions on the fit results is cross-checked.
Variations of the NNLO QCD calculations are defined from the envelope of variations of factorisation and renormalisation scales by factors of two up and down and taking the envelope of these predictions. In the fit, the corresponding𝐾-factors are varied for the𝑊+ jets and𝑍+ jets prediction upward and downward both simultaneously and individually. Each of these variations result in PDFs well within the experimental uncertainties of the nominal ATLASepWZVjet20 set.
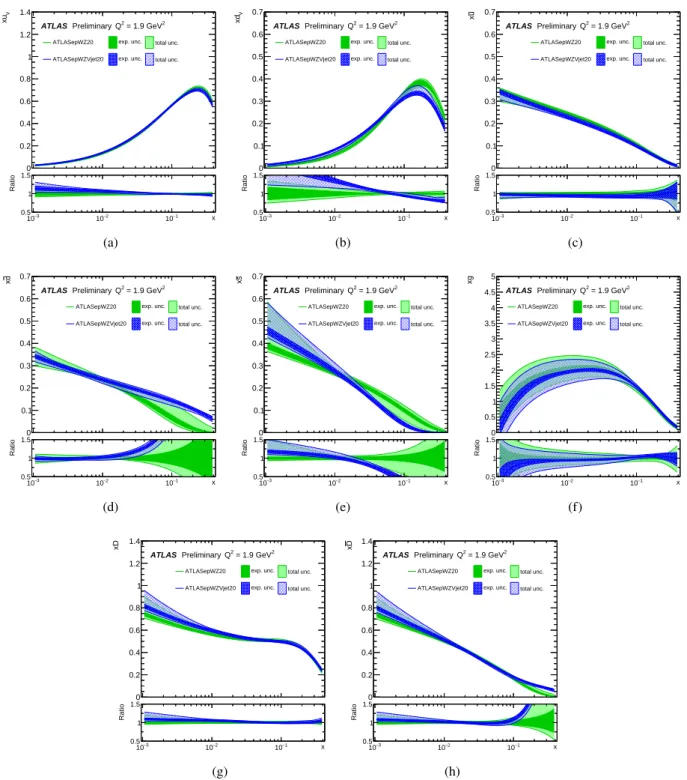
Figure3show the ATLASepWZVjet20 PDFs overlaid with the ATLASepWZ20 PDFs, each evaluated at the starting scale𝑄2
0, for comparison. The experimental and total uncertainties are displayed separately in each case, where the total uncertainty is calculated as the sum in quadrature of the experimental, model and parameterisation uncertainties.
The ATLASepWZVjet20 𝑥𝑑¯ distribution is notably higher in the range 𝑥 & 0.02 compared to the ATLASepWZ20 fit. Similarly, the𝑥𝑠¯distribution of the ATLASepWZVjet20 fit in the same region is lower. Together, these changes allow for an increase in the𝑊+cross-section, as depicted in Fig.1, while maintaining a highly consistent𝑥𝐷¯ =𝑥𝑑¯+𝑥𝑠¯distribution up to𝑥 ∼0.1. Additionally, the𝑑
𝑣distribution is reduced at high𝑥and increased at low𝑥, compensating for the changes in the other PDFs and maintaining the𝑥 𝐷 = 𝑥 𝑑
𝑣 +𝑥𝑑¯+𝑥𝑠¯ distribution consistent on the overall𝑥 range. The up-type quark and gluon distributions are similar between the two fits.
4.2 The high-𝒙sea quark distributions
The difference between the𝑥𝑑¯and𝑥𝑢¯PDFs at high𝑥has been a topic of debate over the recent decades. A measurement by the E866 collaboration of the ratio of Drell-Yan yields from an 800 GeV proton beam incident on liquid hydrogen and deuterium target found the proton𝑥(𝑑¯−𝑢¯) distribution to be positive at high𝑥, peaking at𝑥(𝑑¯−𝑢¯) ∼0.04 at𝑥 ∼0.1 [12]. In contrast, the ATLASepWZ16 PDF set gives a negative central distribution with its lowest value at𝑥(𝑑¯−𝑢¯) ∼ −0.035 for𝑥 ∼0.1, though the uncertainties are such that it is compatible with zero within two standard deviations.
The𝑥(𝑑¯−𝑢¯)distribution as function of𝑥at𝑄2=1.9 GeV2is shown in Fig.4, with a comparison between ATLASepWZVjet20 and ATLASepWZ20 displaying the direct effect of the𝑉+ jets data, and with the experimental, model and parameterisation uncertainties plotted separately. The effect of the𝑉+ jets data is to provide significant constraints to the total uncertainty at high-𝑥, with an overall positive distribution of central values driven by the increase in the high-𝑥𝑑¯distribution, as discussed in Section4.1.
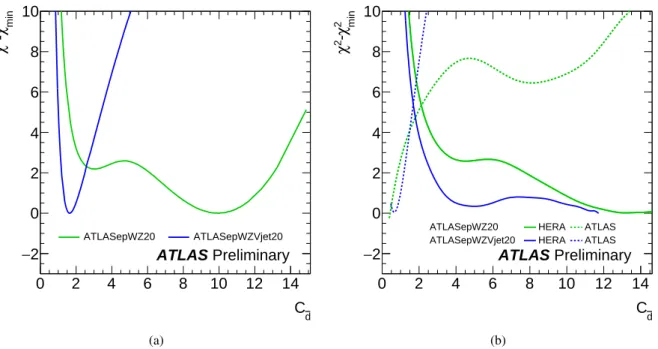
To understand the effect of the different data sets on the high-𝑥 𝑥𝑑¯distribution, a scan of𝜒2is performed
x
Vxu
0 0.2 0.4 0.6 0.8 1 1.2 1.4
ATLAS PreliminaryQ2 = 1.9 GeV2 ATLASepWZ20 exp. unc. total unc.
ATLASepWZVjet20 exp. unc. total unc.
3 x
10− 10−2 10−1
Ratio
0.5 1 1.5
(a)
x
Vxd
0 0.1 0.2 0.3 0.4 0.5 0.6 0.7
ATLAS PreliminaryQ2 = 1.9 GeV2 ATLASepWZ20 exp. unc. total unc.
ATLASepWZVjet20 exp. unc. total unc.
3 x
10− 10−2 10−1
Ratio
0.5 1 1.5
(b)
x
ux
0 0.1 0.2 0.3 0.4 0.5 0.6 0.7
ATLAS PreliminaryQ2 = 1.9 GeV2 ATLASepWZ20 exp. unc. total unc.
ATLASepWZVjet20 exp. unc. total unc.
3 x
10− 10−2 10−1
Ratio
0.5 1 1.5
(c)
x
dx
0 0.1 0.2 0.3 0.4 0.5 0.6 0.7
ATLAS PreliminaryQ2 = 1.9 GeV2 ATLASepWZ20 exp. unc. total unc.
ATLASepWZVjet20 exp. unc. total unc.
3 x
10− 10−2 10−1
Ratio
0.5 1 1.5
(d)
x
sx
0 0.1 0.2 0.3 0.4 0.5 0.6 0.7
ATLAS PreliminaryQ2 = 1.9 GeV2 ATLASepWZ20 exp. unc. total unc.
ATLASepWZVjet20 exp. unc. total unc.
3 x
10− 10−2 10−1
Ratio
0.5 1 1.5
(e)
x
xg
0 0.5 1 1.5 2 2.5 3 3.5 4 4.5 5
ATLAS PreliminaryQ2 = 1.9 GeV2 ATLASepWZ20 exp. unc. total unc.
ATLASepWZVjet20 exp. unc. total unc.
3 x
10− 10−2 10−1
Ratio
0.5 1 1.5
(f)
x
xD
0 0.2 0.4 0.6 0.8 1 1.2 1.4
ATLAS PreliminaryQ2 = 1.9 GeV2 ATLASepWZ20 exp. unc. total unc.
ATLASepWZVjet20 exp. unc. total unc.
3 x
10− 10−2 10−1
Ratio
0.5 1 1.5
(g)
x
Dx
0 0.2 0.4 0.6 0.8 1 1.2 1.4
ATLAS PreliminaryQ2 = 1.9 GeV2 ATLASepWZ20 exp. unc. total unc.
ATLASepWZVjet20 exp. unc. total unc.
3 x
10− 10−2 10−1
Ratio
0.5 1 1.5
(h)
Figure 3: PDFs at the scale𝑄2=1.9 GeV2as a function of Bjorken𝑥obtained for the (a)-(b) valence quarks, (c)-(d) up and down sea quarks, (e) strange sea quark, (f) gluon, (g)𝑥 𝐷and (h)𝑥𝐷¯ distributions when fitting𝑊+ jets,𝑍+ jets, inclusive𝑊 , 𝑍and HERA data (ATLASepWZVjet20, blue bands), compared to a similar fit without𝑊 + jets or 𝑍 + jets data (ATLASepWZ20, green bands). Inner error bands indicate the experimental uncertainty, while outer error bands indicate the total uncertainty, including parameterisation and model uncertainties. The ratio of each to the ATLASepWZ20 PDF set is displayed in the bottom panel in each case.