ATLAS-CONF-2018-021 05June2018
ATLAS CONF Note
ATLAS-CONF-2018-021
Cross-section measurements of the Higgs boson decaying to a pair of tau leptons in proton–proton collisions at √
s = 13 TeV with the ATLAS detector
The ATLAS Collaboration
5th June 2018
A measurement of total production cross sections of the Higgs boson in proton–proton collisions is presented in the H → ττ decay channel. The analysis is performed using 36.1 fb−1of data recorded by the ATLAS experiment at the Large Hadron Collider at a center- of-mass energy of
√s = 13 TeV. All combinations of leptonic (τ →`νν with` = e, µ) and hadronic (τ→hadronsν) tau decays are considered. TheH →ττsignal over the expected background from other Standard Model processes is established with an observed (expected) significance of 4.4 (4.1) standard deviations. Combined with results using data taken at 7 and 8 TeV center-of-mass energies, the observed (expected) significance amounts to 6.4 (5.4) standard deviations and constitutes an observation ofH →ττdecays. Using the data taken at
√s = 13 TeV, the total cross section in the H → ττ decay channel is measured to be 3.71±0.59 (stat.)+0−0..8774(syst.) pb, for a Higgs boson of mass 125 GeV assuming the relative contributions of its production modes as predicted by the Standard Model. Total cross sections in theH →ττdecay channel are determined separately for vector boson fusion production and gluon–gluon fusion production to be σVBFH→ττ = 0.28± 0.09 (stat.)+0−0..1109(syst.) pb and σggF
H→ττ = 3.0±1.0 (stat.)+1−1..62(syst.) pb, respectively. All measurements are in agreement with Standard Model expectations.
© 2018 CERN for the benefit of the ATLAS Collaboration.
Reproduction of this article or parts of it is allowed as specified in the CC-BY-4.0 license.
1 Introduction
The ATLAS and CMS collaborations discovered in 2012 [1, 2] a particle consistent with the Standard Model (SM) [3–5] Higgs boson [6–10]. Several properties of this particle, such as its coupling strengths, spin and charge-parity (CP) quantum numbers, were studied with 7 and 8 TeV center-of-mass energy (
√s) proton–proton collision data delivered by the Large Hadron Collider (LHC) in 2011 and 2012, respectively, denoted as ‘Run 1’. These results rely predominantly on studies of the bosonic decay modes [11–14] and have not shown any significant deviations from the SM expectations.
The coupling of the Higgs boson to the fermionic sector has been established with the observation of theH → ττ decay mode with a signal significance of 5.5σ from a combination of ATLAS and CMS results [15–17] using LHC Run 1 data. A measurement performed by the CMS collaboration with Run 2 data at
√s = 13 TeV reached a significance of 4.9σ using 35.9 fb−1 of integrated luminosity and 5.9σ combined with data from Run 1 [18]. While the Higgs boson coupling to other fermions such as top quarks has been observed [19,20] and there is evidence of its coupling to bottom quarks [21,22], only upper limits exist on its coupling to muons [23,24] and theH →ττdecay mode has been the only accessible leptonic decay mode. It was also used to constrain CP violation in the production via vector-boson fusion (VBF) [25] and is unique in that it provides sensitivity to CP violation in the Higgs boson coupling to leptons [26].
This note presents cross-section measurements of Higgs bosons that decay to a pair of tau leptons in proton–proton (pp) collisions at
√s=13 TeV using data collected by the ATLAS experiment in 2015 and 2016, corresponding to an integrated luminosity of 36.1 fb−1. All combinations of leptonic (τ→`ννwith
` = e, µ) and hadronic (τ → hadronsν) tau decays are considered.1 The corresponding three analysis channels are denoted byτlepτlep,τlepτhadandτhadτhadand are composed of different dominant backgrounds.
WhileZ→ττis a dominant background in all channels, the relative contributions from other backgrounds from top-quark and vector-boson decays, as well as from misidentified leptonic or hadronic tau decays, vary considerably. Two analysis categories are defined that are predominantly sensitive to Higgs bosons produced via VBF and gluon–gluon fusion (ggF). A maximum likelihood fit is performed on data using distributions of the reconstructed di-tau mass in signal regions (SRs), simultaneously with event yields from control regions (CRs) that are included to constrain normalizations of major backgrounds estimated from simulation. The dominant and irreducibleZ →ττbackground is estimated from simulation. This is different from the search forH→ττdecays in Run 1 [15], which used the embedding technique [27].
A reliable modeling of this background is therefore of critical importance for this analysis. Validation regions (VRs) based onZ → ``events are studied, but not included in the fit, to verify as precisely as possible the modeling of theZ →ττbackground.
The article is organized as follows. Section2describes the ATLAS detector. This is followed in Section3 by a description of the dataset and Monte Carlo (MC) simulated samples employed by this measurement.
Section 4 details the reconstruction of particles and jets. The event selection for each channel and event category as well as signal, control and validation regions are discussed in Section5. Background estimation techniques and the systematic uncertainties for the analysis are described in Sections6and7, respectively. The signal extraction procedure and the results of the Higgs cross-section measurement in theH→ττdecay mode are presented in Section8.
1Throughout this article the inclusion of charge-conjugate decay modes is implied. The symbol`is used to denote electrons and muons, also referred to as ‘light leptons’.
2 The ATLAS detector
The ATLAS experiment [28] at the LHC is a multi-purpose particle detector with a forward–backward symmetric cylindrical geometry and a near 4πcoverage in solid angle2. It consists of an inner tracking detector surrounded by a thin superconducting solenoid, electromagnetic and hadron calorimeters, and a muon spectrometer. The inner tracking detector covers the pseudorapidity range |η| < 2.5. It consists of a silicon pixel detector, which has an additional innermost layer (positioned at a radial distance of 3.3 cm from the beam line) that has been installed since the end of Run 1 (IBL) [29], and a silicon microstrip detector surrounding the pixel detector, both covering |η| < 2.5, followed by a transition radiation straw-tube tracker covering|η| < 2. This is surrounded by a 2 T axial magnetic field provided by the solenoid. Lead/liquid-argon sampling calorimeters provide electromagnetic energy measurements with high granularity. A hadron iron/scintillator-tile calorimeter covers the central pseudorapidity range (|η|< 1.7). The end-cap and forward regions are instrumented with liquid-argon calorimeters for both the electromagnetic and hadronic energy measurements up to|η| = 4.9. The muon spectrometer surrounds the calorimeters and is based on three large air-core toroid superconducting magnets with eight coils each.
Its bending power is in the range from 2.0 T m to 6.0 T m.
Events are selected using a two-level trigger system. The first-level trigger is implemented in hardware and uses a subset of the detector information to filter events that are then processed by a software-based high-level trigger. This further reduces the average recorded collision rate to approximately 1 kHz.
3 Data and simulated samples
The data used in this analysis are taken from proton–proton collisions at the LHC where proton bunches are collided every 25 ns. A combination of several triggers for single light leptons, two light leptons and two hadronically-decaying tau leptons are used to record the data for the analysis, depending on the analysis channel (see Section5.1). After data quality requirements, the samples used for this measurement consist of 3.2 fb−1 of data recorded in 2015, with an average of 14 interactions per bunch crossing, and 32.9 fb−1recorded in 2016, with an average of 25 interactions per bunch crossing.
Samples of signal and background processes are simulated using various Monte Carlo generators as summarized in Table1. The signal contributions considered include the following three processes for Higgs boson production at the LHC:ggF, VBF and associated production of a Higgs boson with a vector boson (VH) where all decay modes for the H → ττ process are included. Other Higgs production processes like associated production with a top–antitop quark pair, bottom–antibottom quark pair and with a single top quark are found to be negligible. Higgs decays to W W are considered background and simulated likewise for these production processes. The mass of the Higgs boson is assumed to be 125 GeV [30].
Higgs production byggF is simulated with the Powheg v2 [31–34] NNLOPS program [35] at next-to- leading order (NLO) accuracy in quantum chromodynamics (QCD) using the MiNLO approach [36],
2 The ATLAS Collaboration uses a right-handed coordinate system with its origin at the nominal interaction point (IP) in the center of the detector and thez-axis along the beam pipe. Thex-axis points from the IP to the centre of the LHC ring, and the y-axis points upwards. Cylindrical coordinates(r, φ)are used in the transverse plane,φbeing the azimuthal angle around the beam pipe. The pseudorapidity is defined in terms of the polar angleθasη=−ln tan(θ/2). Angular distance is measured in units of∆R≡
q
(∆η)2+(∆φ)2.
3
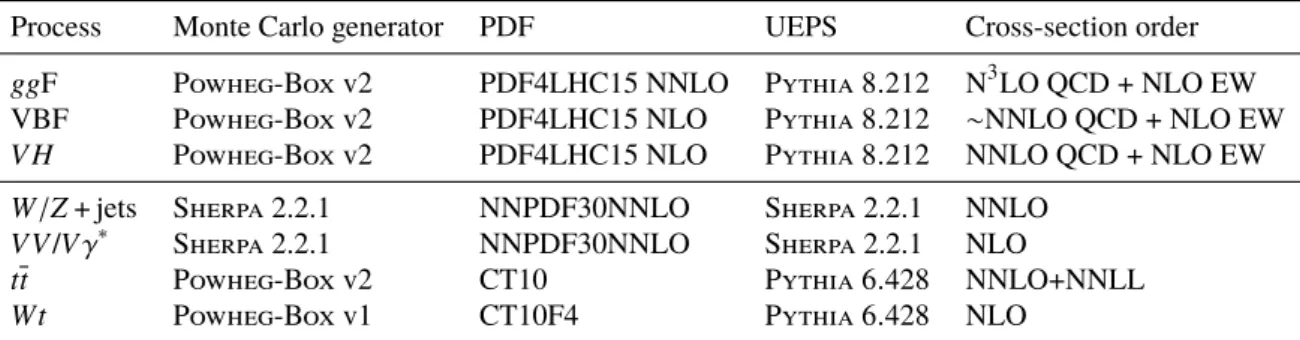
Table 1: Monte Carlo generators used to describe all signal and background processes together with the corresponding PDF set and the model of parton shower, hadronization and underlying event (UEPS). In addition, the order of the total cross-section calculation is given. The total cross section for VBF production is calculated at approximate-NNLO QCD. More details are given in the text.
Process Monte Carlo generator PDF UEPS Cross-section order
ggF Powheg-Box v2 PDF4LHC15 NNLO Pythia 8.212 N3LO QCD + NLO EW
VBF Powheg-Box v2 PDF4LHC15 NLO Pythia 8.212 ∼NNLO QCD + NLO EW
VH Powheg-Box v2 PDF4LHC15 NLO Pythia 8.212 NNLO QCD + NLO EW
W/Z+ jets Sherpa 2.2.1 NNPDF30NNLO Sherpa 2.2.1 NNLO
V V/Vγ∗ Sherpa 2.2.1 NNPDF30NNLO Sherpa 2.2.1 NLO
tt Powheg-Box v2 CT10 Pythia 6.428 NNLO+NNLL
W t Powheg-Box v1 CT10F4 Pythia 6.428 NLO
and reweighted to next-to-next-to-leading order (NNLO) in QCD in the Higgs rapidity. The VBF and VH production processes are simulated at NLO accuracy in QCD using Powheg-Box with the MiNLO approach. For these signal samples, the simulation is interfaced to the Pythia 8.212 [37] model of parton shower, hadronization and underlying event (UEPS). To estimate the impact of UEPS uncertainties, theggF, VBF andVH samples are also simulated with the Herwig 7.0.3 [38, 39] UEPS model. The PDF4LHC15 [40] parameterization of the parton distribution functions (PDFs) is used for these production processes. The AZNLO [41] set of tuned parameters is used, with the CTEQ6L1 [42] PDF set, for the modeling of non-perturbative effects. Photos++ version 3.52 [43] is used for QED emissions from electroweak (EW) vertices and charged leptons.
The overall normalization of theggF process is taken from a next-to-next-to-next-to-leading-order (N3LO) QCD calculation with NLO EW corrections applied [44–47]. Production by VBF is normalized to an approximate-NNLO QCD cross section with NLO EW corrections applied [48–50]. TheVHsamples are normalized to cross sections calculated at NNLO in QCD, with NLO EW radiative corrections applied [51–
53].
Background samples of EW production ofW/Zbosons from VBF,W/Zboson production with associated jets and di-boson production processes are simulated with the Sherpa 2.2.1 [54] generator. Matrix elements are calculated using the Comix [55] and OpenLoops [56] matrix-element generators and merged with the Sherpa UEPS model [57] using the ME+PS@NLO prescription [58]. ForWandZ production with associated jets the matrix elements are calculated for up to two partons at NLO and four partons at LO precision. Their inclusive cross sections are normalized to NNLO calculations from Fewz [59,60].
For di-boson production, the matrix elements are calculated for up to one additional parton at NLO and up to three additional partons at LO precision. For all samples the NNPDF30NNLO [61] PDF set is used together with the Sherpa UEPS model. In particular, the dominant Z → ττ background is estimated using these simulations ofZ-boson production.
The impact of UEPS uncertainties, and other modeling uncertainties such as LO/NLO precision compar- ison for leading jets, on the main background fromZ → ττis studied in an alternative sample which is simulated using Madgraph5_aMC@NLO 2.2.2 [62] at leading order interfaced to the Pythia 8.186 UEPS model. The A14 set of tuned parameters [63] is used together with the NNPDF23LO PDF set [64].
For the generation oftt production, the Powheg-Box v2 [31–33,65] generator with the CT10 PDF sets in the matrix element calculations is used. The predictedttcross section is calculated with the Top++2.0
program to NNLO in perturbative QCD, including soft-gluon resummation to next-to-next-to-leading-log order [66]. Single top-quark production ofW tis simulated using the Powheg-Box v1 [67,68] generator.
This generator uses the four-flavor scheme for the NLO matrix -element calculations together with the fixed four-flavor PDF set CT10F4. For all top-quark production processes, top-quark spin correlations are preserved (for the t-channel, top quarks are decayed using MadSpin [69]). The parton shower, hadronization, and the underlying event are simulated using Pythia 6.428 [70] with the CTEQ6L1 PDF set and the corresponding Perugia 2012 set of tuned parameters [71]. The top mass is assumed to be 172.5 GeV. The EvtGen v.1.2.0 program [72] is used for the properties ofb- andc-hadron decays.
For all samples, a full simulation of the ATLAS detector response [73] using the Geant4 program [74] was performed. The effect of multipleppinteractions in the same and neighbouring bunch crossings (pile-up) is included by overlaying minimum-bias events simulated with Pythia 8.186 using the MSTW2008LO PDF [75] and the A2 [76] set of tuned parameters on each generated signal and background event. The number of overlaid events is chosen such that the distribution of the average number of interactions per ppbunch crossing in the simulation matches that observed in data.
4 Object reconstruction
Electron candidates are reconstructed from energy deposits in the electromagnetic calorimeter associated with a charged-particle track measured in the inner detector. The electron candidates are required to pass the ‘loose’ likelihood-based identification selection of Ref. [77,78], to have transverse momentum pT > 15 GeV and to be in the fiducial volume of the inner detector, |η| < 2.47. The transition region between the barrel and end-cap calorimeters (1.37 < |η| < 1.52) is excluded. The trigger efficiency for single electrons selected in the analysis ranges between 90–95% [79]. Electron candidates are ignored if they share their reconstructed track with a muon candidate defined below or if their angular distance to a jet is within 0.2<∆R<0.4.
Muon candidates are constructed by matching an inner detector track with a track reconstructed in the muon spectrometer [80]. The muon candidates are required to havep
T >10 GeV and|η| <2.5 and to pass the ‘loose’ muon identification requirements of Ref. [80]. The trigger efficiency for single muons selected in the analysis is close to 80% (70%) in the barrel in the 2016 (2015) dataset and 90% in the end-caps [79].
Muon candidates are ignored if their angular distance to a jet is∆R <0.4 with the following exceptions:
If∆R < 0.2 or the muon track is associated to the jet, and if the jet has either less than three tracks or less than twice the transverse momentum of the muon candidate, the jet is removed instead. This recovers efficiency for muons which radiate a hard bremsstrahlung photon in the calorimeter.
In theτlepτlepandτlepτhadsignal regions events are only selected if the selected electron and muon candidates pass their respective ‘medium’ identification criteria. The reconstruction and identification efficiency for muons with the ‘medium’ identification requirement has been measured inZ → µµevents [80]. It is well above 98% over the full phase space, except for |η| < 0.1 where the reconstruction efficiency is about 70%. The combined identification and reconstruction efficiency for ‘medium’ electrons ranges from 80–90% in thep
T range from 10 GeV to 80 GeV as measured inZ →eeevents [78]. In addition, the electrons and muons are required to fulfill the ‘gradient’ isolation criterion, which requires that there are no additional high-p
T tracks in a cone around the track and no significant energy deposits in a cone around the calorimeter clusters of the object after correcting for pile-up. The size of the respective cones depends on thepT of the light lepton. This isolation requirement rejects about 10% of light leptons for low-p
Tand less than 1% forp
T >60 GeV [78,80].
5
Jets are reconstructed from topological clusters in the calorimeter using the anti-kt algorithm [81, 82], with a radius parameter value R = 0.4. To reject jets from pile-up a ‘Jet Vertex Tagger’ (JVT) [83]
algorithm is used for jets withp
T <50 GeV and|η| <2.4. It employs a multivariate technique that relies on jet-tracking and calorimeter-cluster-shape variables to determine the likelihood that the jet originates from pile-up. Similarly, pile-up jets in the forward region are suppressed with a ‘forward JVT’ [84]
algorithm, relying in this case only on calorimeter-cluster-shape variables, which is applied to all jets with pT <50 GeV and|η|> 2.5. In the pseudorapidity range|η| <2.5,b-jets are selected using a multivariate algorithm [85,86]. A working point is chosen that corresponds to an efficiency of approximately 85%
forb-jets and rejection factors of 2.8 and 28 forc-jets and light-flavor jets, respectively, in simulatedtt events. A jet is ignored if it is within∆R< 0.2 with respect to an electron or hadronically-decaying tau candidate.
Leptonic tau decays are reconstructed as electrons and muons. The reconstruction of the visible decay products of hadronic tau decays (τhad-vis) [87] starts with a reconstructed jet that has pT > 10 GeV and
|η| < 2.5. As in the case of electron reconstruction the transition region between the barrel and end- cap calorimeters is excluded. To discriminate τhad-vis from jets initiated by light-quarks or gluons, an identification algorithm using multivariate techniques is applied toτhad-vis candidates. They have to pass the ‘loose’ identification requirement of Ref. [87]. In addition, the τ
had-vis candidates are required to havep
T > 20 GeV, to have one or three associated tracks and an absolute electric charge of one. Their energy is reconstructed by multivariate regression techniques using information of the associated tracks and calorimeter clusters as well as the average number of collisions recorded. The trigger efficiency per τhad-vis selected in the analysis is 95% and 85% for 1-prong and 3-prong taus, respectively [88]. τhad-vis candidates are ignored if they are within∆R < 0.2 of a muon or electron candidate. In addition, if the candidate overlaps within∆R < 0.4 with an electron candidate, it is required to have a low electron identification likelihood score [78]. The requirement on the likelihood score corresponds to a τhad-vis efficiency measured inZ→ττdecays of 95% [87].
In the τ
lepτ
had signal regions, events are only selected if the τ
had-vis candidate passes the ‘medium’
identification requirement, corresponding to an efficiency of 55% and 40% for real 1-prong and 3-prong τhad-vis, respectively [87]. In addition, if a 1-prongτhad-viscandidate and an electron candidate are selected, a dedicated multivariate algorithm to reject electrons misidentified asτ
had-visis applied to suppressZ →ee events. In theτhadτhadsignal regions both selectedτhad-viscandidates have to fulfill the ‘tight’ identification requirement, which corresponds to a selection efficiency of 45% for real 1-prongτhad-visand 30% for real 3-prongτ
had-vis[87].
The missing transverse momentum vector is calculated as the negative vectorial sum of thep
Tof the fully calibrated and reconstructed physics objects [89]. This procedure includes a soft term, which is calculated based on the inner detector tracks originating from the vertex associated to the hard-scattering process that are not associated with any of the reconstructed objects. The missing transverse momentum (Emiss
T )
is defined as the modulus of this vector.
The Higgs boson candidate is reconstructed from the visible decay products of the tau leptons and from theETmisswhich is assumed to originate from the final state neutrinos. The di-tau invariant mass (mMMCττ ) is determined using the missing mass calculator (MMC) [90]. The standard deviation of the reconstructed di-tau mass is 17.0 GeV, 15.3 GeV and 14.7 GeV for signal events selected in the τlepτlep, τlepτhad and τhadτ
hadchannels, respectively. Thep
Tof the Higgs boson candidate (pττ
T ) is computed as the vector sum of the transverse momenta of the visible decay products of the tau leptons and the missing transverse momentum vector.
Table 2: Summary of the triggers used to select events for the three analysis channels during 2015 and 2016 data- taking and the correspondingpTrequirements applied in the analysis. For the electron+muon trigger the first number corresponds to the electronpTrequirement, the second to the muonpTrequirement. For theτhadτhadchannel, at least one high-pTjet in addition to the twoτhad-viscandidates is required for the 2016 dataset (see text).
Analysis Trigger AnalysispTrequirement [GeV]
channel 2015 2016
τlepτlep&τlepτhad Single electron 25 27
Single muon 21 27
τlepτ
lep
Di-electron 15 / 15 18 / 18
Di-muon 19 / 10 24 / 10
Electron+muon 18 / 15 18 / 15
τhadτhad Di-τhad-vis 40 / 30 40 / 30
5 Event selection and categorization
In addition to data quality criteria which ensure that the detector was functioning properly, events are rejected if they contain reconstructed jets not associated to real energy deposits that can arise from hardware problems, beam conditions or cosmic showers. To further increase the purity and quality of the data sample by rejecting non-collision events originating from cosmic rays and beam-halo events, at least one reconstructed primary vertex is required with at least two associated tracks withp
T >0.5 GeV.
The primary vertex is chosen as thepp vertex candidate with the highest sum of the squared transverse momenta of all associated tracks.
The triggers and event selection for the three analysis channels are described in Section5.1. Selected events are categorized into exclusive signal regions, with enhanced signal-to-background ratios. In addition, control regions (CRs) are defined where a specific background is dominant and thereby allow the adjustment of simulated predictions for the background contribution to the observed data. Signal and control regions, which are included in the fit described in Section8, are described in Section5.2together with validation regions (VRs) used to validate the simulation ofZ+ jets.
5.1 Event selection
Depending on the trigger, transverse momentum requirements are applied to selected electron, muon, and τhad-viscandidates. They are summarised in Table2and their per-object efficiencies are given in Section4.
Due to the increasing luminosity and the different pile-up conditions, the p
T thresholds of the triggers have increased during data-taking in 2016, which is taken into account in thep
Trequirements of the event selection. In theτlepτlepchannel, the triggers for multiple light leptons are only used if the highest-pTlight lepton does not pass the corresponding single light-lepton triggerp
T requirement. This ensures that each trigger selects an exclusive set of events.
All channels require the exact number of identified ‘loose’ leptons, i.e. electrons, muons andτhad-vis, as defined in Section4, corresponding to their respective final state. Events with additional ‘loose’ leptons are rejected. Both leptons are required to be of opposite charge and they have to fulfill thep
Trequirements
7
of the respective trigger shown in Table2. The selectedτhad-visin theτlepτhad channel is required to have pT >30 GeV.
Only events withEmiss
T > 20 GeV are selected to reject events without neutrinos. In theτlepτlepchannel with two same-flavor (SF) light leptons this requirement is further tightened to suppress the largeZ→``
background. For the same reason, requirements are introduced on the invariant mass of two light leptons (m``) and on the Emiss
T calculated only from the physics objects without the soft track term (Emiss, hard
T ).
Requirements on the angular distance between the visible decay products of the two selected tau lepton decays (∆Rττ) and the projected angular distance inη(|∆ηττ|) are applied in all channels to reject non- resonant background events. Requirements are applied to the fractions of the tau-lepton momenta carried by each visible decay productxi = pvisi /
pvisi +pmissi
, where pivisand pimissare the visible and missing momenta of theith tau lepton, ordered in descendingp
T, calculated in the collinear approximation [91], to suppress events with Emiss
T that is incompatible with a di-tau decay. Low transverse mass (m
T), calculated fromETmissand the momenta of the selected light lepton andτhad-vis, is required in theτlepτhad channel to reject events with leptonicW decays. A requirement on the di-tau mass calculated in the collinear approximation (mcollττ ) ofmcollττ > mZ−25 GeV is introduced in theτlepτlepchannel to suppress events from Z → `` and to ensure orthogonality between this measurement and the measurement of H→W W∗→`ν`ν[92], which has a similar final state.
All channels require at least one jet (j
1) withpj1
T > 40 GeV as the analysis targets either boosted Higgs bosons or those produced by VBF. Since 2016 the di-τhad-vis first-level trigger requires a jet with pT >
25 GeV calibrated at trigger level with|η| <3.2 in addition to the twoτhad-viscandidates. In theτhadτhad channel the jet pT requirement is thus raised to pj1
T > 70 GeV to achieve uniform trigger selection efficiency as a function ofpj1
T. The trigger efficiency for the additional jet ranges from 95–100% for these requirements. In theτlepτlep andτlepτhad channels, the top-quark background is suppressed by requiring that no jet withpT > 25 GeV is tagged as ab-jet. The event selection for the three analysis channels is summarized in Table3.
5.2 Signal, control and validation regions
To exploit signal-sensitive event topologies, a ‘VBF ’ and a ‘boosted’ analysis category are defined without any overlap in phase space. The VBF category targets events with a Higgs boson produced by VBF and is characterized by the presence of a second high-p
Tjet (pj2
T > 30 GeV). In addition, the two jets are required to be in opposite hemispheres of the detector with a large pseudorapidity separation of|∆ηj j| > 3 and their invariant mass (mj j) is required to be larger than 400 GeV. The selected leptons are required to have η-values that lie between those of the two jets (‘central leptons’). Although this category is dominated by VBF production, it also includes significant contributions fromggF production, amounting to up to 30%
of the total expected Higgs-boson signal.
The boosted category targets events with Higgs bosons produced throughggF with an additional recoiling jet, which is motivated by an on average higher pT of the boson for H → ττ compared to the largest background fromZ→ττ. It contains all events with pττ
T > 100 GeV that do not pass the VBF selection.
In addition to events fromggF, the boosted categories contain sizeable contributions from VBF andVH production of 10–20% of the expected signal. Events that pass the event selection, detailed in Table3, but do not fall into the VBF or boosted categories are not used in the analysis.
Table 3: Summary of the event selection requirements for the three analysis channels that are applied in addition to the respective leptonpTrequirements listed in Table2. Emiss, hard
T is an alternativeETmisscalculated only from the physics objects without the soft-track term.
τlepτlep τlepτhad τhadτhad
ee/µµ eµ
Ne/µloose=2,Nτloose
had-vis =0 Ne/µloose=1,Nτloose
had-vis =1 Ne/µloose=0,Nτloose
had-vis =2 e/µ: Medium, gradient iso. e/µ: Medium, gradient iso.
τhad-vis: Medium τhad-vis: Tight
Opposite charge Opposite charge Opposite charge
mcollττ >mZ−25 GeV mT<70 GeV 30<m`` <75 GeV 30<m`` <100 GeV
ETmiss>55 GeV ETmiss>20 GeV ETmiss>20 GeV ETmiss>20 GeV Emiss, hard
T >55 GeV
∆Rττ <2.0 ∆Rττ <2.5 0.8<∆Rττ <2.5
|∆ηττ|<1.5 |∆ηττ|<1.5 |∆ηττ|<1.5 0.1<x1 <1.0 0.1<x1<1.4 0.1<x1<1.4 0.1<x2 <1.0 0.1<x2<1.2 0.1<x2<1.4
pj1
T >40 GeV pj1
T >40 GeV pj1
T >70 GeV,|ηj
1
|<3.2
Nb-jets=0 Nb-jets=0
Using pττ
T , ∆Rττ and mj j, both inclusive categories are split further into 13 exclusive signal regions with different signal-to-background ratios to improve the sensitivity. Table 4 summarizes the analysis categories and signal region definitions. Figure1illustrates the signal and background composition in the signal and control regions.
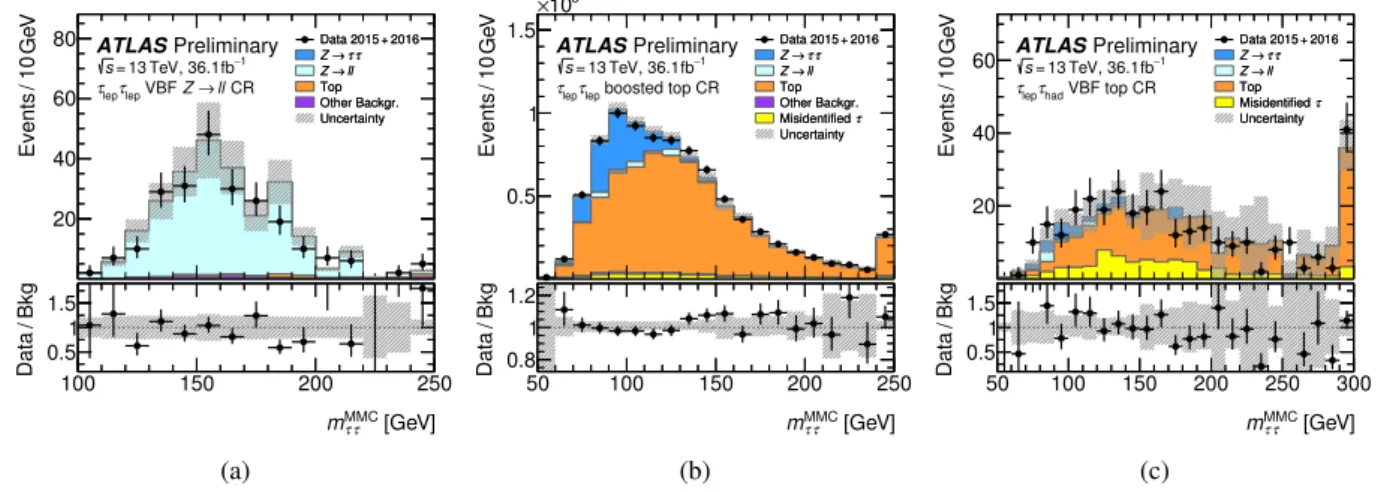
Six control regions are defined to constrain the normalization of the dominant backgrounds in regions of phase space where their purity is high. Their definitions are summarized in Table5. TwoZ →``CRs, which both consist of more than 90% ofZ→``events, are defined by applying the same selection as for the SFτlepτlepVBF and boosted inclusive regions, respectively, but with them`` requirement modified to 80<m`` <100 GeV. The top quark background is characterized by the presence ofb-jets. Four separate top CRs are defined by inverting theb-jet veto in the inclusive VBF and boosted categories for each of the τlepτlepandτlepτhadchannels. The top CRs in theτlepτlepchannel consist of about 80% of top-quark events.
For the top CRs in theτ
lepτ
hadchannel, the requirement onm
T < 70 GeV is replaced bym
T > 40 GeV to further enhance the purity to about 70% in the VBF top CR and about 60% in the boosted top CR. No such control regions are defined for theτhadτhadchannel since the top andZ →``backgrounds are negligible in this case.
One validation region is defined for each signal region (‘Z → ττVRs’) to validate the event yields and kinematic distributions of simulatedZ →ττevents. TheZ →ττVRs are composed ofZ →`` events with similar kinematics as theZ → ττbackground in the respective signal regions. This is achieved by starting with an event selection that is based on the SF τlepτlep channel preselection with the following differences that account for the selection of light leptons instead of decay products from tau leptons: The mcollττ ,Emiss
T andEmiss, hard
T requirements are dropped and them``requirement is inverted tom`` >80 GeV.
The other requirements on tau-lepton decays are replaced with requirements on the two light leptons. In particular, the requirements onpττ
T are substituted by thepTof theZboson computed from thepT of the light leptons (p``
T ). Requirements on jets are unchanged since they define the shape of most kinematic
9
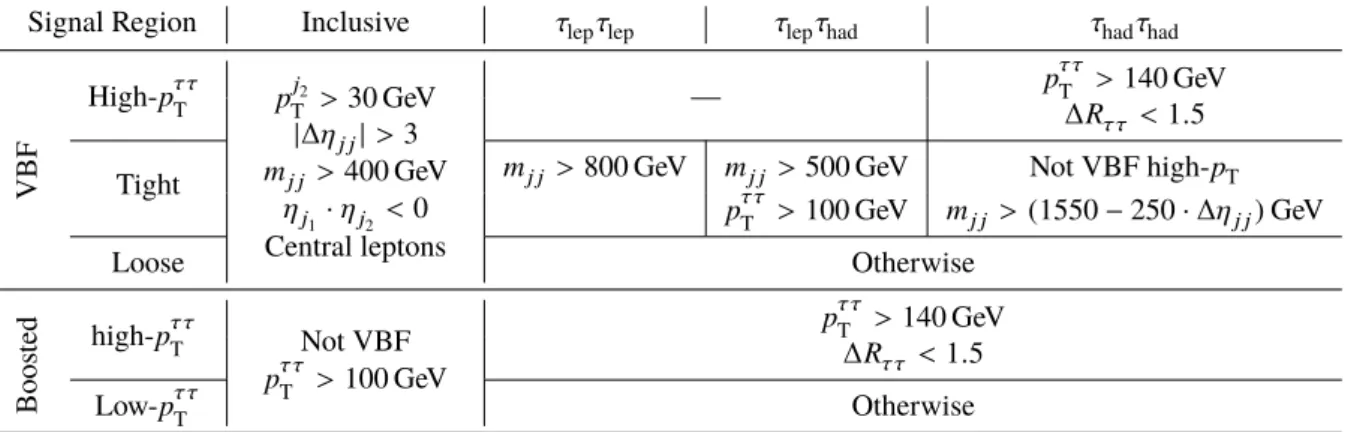
Table 4: Definition of the VBF and boosted analysis categories and of their respective signal regions (SRs). The selection criteria, which are applied in addition to those described in Table3, are listed for each channel. The VBF high-pTSR is only defined for theτhadτhadchannel, resulting in a total of seven VBF SRs and six boosted SRs.
All signal regions are exclusive and their yields add up to those of the corresponding VBF and boosted inclusive regions. In particular, the SRs marked with ‘otherwise’ contain all events that pass the corresponding inclusive event selection for an analysis channel but do not pass any of the other SR selections.
Signal Region Inclusive τlepτlep τlepτhad τhadτhad
VBF
High-pττ
T pj2
T >30 GeV
|∆ηj j|>3 mj j >400 GeV
ηj
1
·ηj
2 <0 Central leptons
— pττ
T >140 GeV
∆Rττ <1.5 Tight mj j >800 GeV mj j >500 GeV Not VBF high-pT
pττ
T >100 GeV mj j >(1550−250·∆ηj j)GeV
Loose Otherwise
Boosted high-pττ
T Not VBF
pττ
T >100 GeV
pττ
T >140 GeV
∆Rττ <1.5 Low-pττ
T Otherwise
Table 5: Definitions of the six control regions (CRs) used to constrain theZ →``and top backgrounds to the event yield in data in theτlepτlepandτlepτhadchannels. ‘SF’ denotes a selection of same-flavor light leptons.
Region Selection
τlepτlepVBFZ→``CR τlepτlepVBF incl. selection, 80< m`` <100 GeV (SF) τlepτlepboostedZ →``CR τlepτlepboosted incl. selection, 80< m`` <100 GeV (SF) τlepτlepVBF top CR τlepτlepVBF incl. selection, invertedb-jet veto
τlepτlepboosted top CR τlepτlepboosted incl. selection, invertedb-jet veto
τlepτhadVBF top CR τlepτhadVBF incl. selection, invertedb-jet veto,mT >40 GeV τlepτhadboosted top CR τlepτhadboosted incl. selection, invertedb-jet veto,mT >40 GeV
distributions forZ-boson production similarly in the SRs and theZ → ττ VRs. More than 99% of the selected events are fromZ →``in allZ →ττVRs.
6 Background estimation
The final-state topologies of the three analysis channels have different background compositions which necessitates different strategies for the background estimation. In each SR, the number of expected background events and the associated kinematic distributions are derived from a mixture of data-driven methods and simulation.
Background contributions with prompt, light leptons andτ
had-vis are estimated from simulation. If their contribution is significant, their normalization is constrained by the observed event yields in CRs. For smaller contributions of this type, their normalisation is entirely taken from the theoretical cross sections with the precision in QCD listed in Table1. This includes di-boson processes and a small contribution
lep VBF
lepτ τ
CR ll Z→
boosted τlep
τlep
CR ll
Z→ ATLAS Preliminary
1
fb−
, 36.1 V e T 13
= s
τ τ H→
τ τ Z→
ll Z→ Top
Other backgrounds Misidentified τ
had VBF
hadτ τ
loose SR
had VBF
hadτ τ
tight SR
lep VBF
lepτ τ
top CR
boosted τlep
τlep
top CR
had VBF
lepτ τ
top CR
boosted τhad
τlep
top CR
had VBF
hadτ τ
T SR
τ
pτ
high-
lep VBF
lepτ τ
loose SR
boosted τlep
τlep
T SR
τ
pτ
low-
had VBF
lepτ τ
loose SR
boosted τhad
τlep
T SR
τ
pτ
low-
boosted τhad
τhad T SR
τ
pτ
low-
lep VBF
lepτ τ
tight SR
boosted τlep
τlep
T SR
τ
pτ
high-
had VBF
lepτ τ
tight SR
boosted τhad
τlep
T SR
τ
pτ
high-
boosted τhad
τhad
T SR
τ
pτ
high-
Figure 1: Expected signal and background composition in six control regions (CRs) and the 13 signal regions (SRs) used in the analysis.
from EW production of W/Z bosons from VBF. Contributions from light- and heavy-flavor jets that are misidentified as prompt, light leptons orτ
had-vis(labeled as ‘fake-` ’ and ‘fake-τ
had-vis’ backgrounds, respectively, and collectively as ‘misidentifiedτ’, throughout this paper) are estimated using data-driven methods. The contamination fromH →W W∗decays is treated as a background in theτlepτlepchannel, while it is negligible in other channels.
For the background sources that have their normalization constrained using data, Table6shows the nor- malization factors and their uncertainties obtained from the fit (see Section8). For simulated backgrounds, the factors compare the background normalizations to values determined from their theoretical cross sec- tions. The normalization factor for the data-driven fake-τhad-visbackground scales the event yield of the template of events that fail the opposite-charge requirement (see Section6.4). TheZ →ττnormalization is constrained by data in themMMCττ distributions of the signal regions. Systematic uncertainties are the dominant contribution to the normalization factor uncertainties.
11
Table 6: Normalization factors for backgrounds that have their normalization constrained using data in the fit including all statistical and systematic uncertainties described in Section 7, but without uncertainties in total simulated cross sections extrapolated to the selected phase space. Systematic uncertainties are the dominant contribution to the normalization factor uncertainties. Also shown are the analysis channels the factors are applied to.
Background Channel Normalization factors
VBF Boosted
Z→``(CR) τlepτlep 0.87+0−0..3430 1.25+0−0..2924
Top (CR) τlepτlep 1.19±0.09 1.06±0.05 Top (CR) τlepτhad 1.53+0−0..3027 1.12±0.07 Fake-τhad-vis(data-driven) τhadτhad 0.88±0.12 Z→ττ(fit in each SR) τlepτlep,τlepτhad,τhadτhad 1.04+0−0..1009 1.11±0.05
6.1 Z → ττ background validation
The Drell-Yan processpp →Z/γ∗→ττis a dominant irreducible background in all analysis categories and contributes between 50–90% of the total background depending on the signal region. The separation between the Drell-Yan and theH→ττsignal processes is limited by themττMMCresolution.
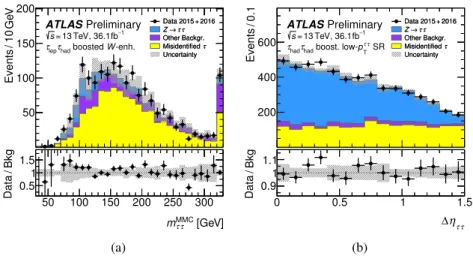
The modeling of this important background is validated using Z → ττ VRs that consist of Z → ``
events. In Fig.2, the observed distributions of several variables are compared to simulation normalized to the event yield in data. The selected observables correspond to either variables correlated withmττMMC (p`1
T andp`2
T), or to major variables used for categorization (p``
T ,∆R``,∆ηj j andmj j), or to variables to which different requirements are applied in each decay channel (pj1
T). Generally, the Sherpa simulation describes the shape of data within the experimental and theoretical uncertainties (see Section 7), with the exception of a slight trend in the ratio of data to simulation as a function of∆ηj j andmj j shown in Fig.2. These trends have no impact on the modelling of mMMCττ . Reweighting the simulation with the observedmj j distribution, which is an important variable for VBF categorization, has negligible impact on the measurement. In the fit, the normalization of theZ→ττbackground is correlated across the decay channels and constrained by data in themMMCττ distributions of the signal regions associated to the boosted and VBF categories, independently. As shown in Table6, it is constrained to±5% in the boosted and to
±9% in the VBF categories. The relative acceptance of events among the signal regions within a category is validated by applying the corresponding event selection criteria to theZ → ττVRs. The expected relative acceptance from simulation agrees with data within uncertainties for all regions. Figures7and8 show the good modeling of theZ →ττmMMCττ distribution in all signal regions. Additional uncertainties in the relative acceptances and on the shape of themττMMCdistributions in the signal regions are evaluated from theoretical and experimental uncertainties described in Section7.
6.2 Z → `` background
Z-boson decays into light leptons are a significant background for theτlepτlepandτlepτhadchannels where mismeasuredEmiss
T can bias themττMMCof light-lepton pairs to be of similar values as the expected signal.
The observed event yields in theZ →``CRs constrain the normalization of simulatedZ→``events in the