ATLAS-CONF-2013-021 08March2013
ATLAS NOTE
ATLAS-CONF-2013-021
March 7, 2013
A Measurement of W
±Z Production in Proton-Proton Collisions at
√ s = 8 TeV with the ATLAS Detector
The ATLAS Collaboration
Abstract
This note presents measurements of W
±Z production in pp collisions at a center-of-mass energy of 8 TeV at the LHC using data collected by the ATLAS experiment in 2012 with an integrated luminosity of 13 fb
−1. A total of 1094 candidates with a background expectation of 277 events is observed for purely leptonically decaying bosons with electrons and / or muons in the final state. The total cross section is determined to be σ
totWZ= 20.3
+−0.70.8(stat.)
+1.2−1.1
(syst.)
+0.7−0.6(lumi.) pb, in agreement with the Standard Model expectation of 20.3 pb.
c
Copyright 2013 CERN for the benefit of the ATLAS Collaboration.
Reproduction of this article or parts of it is allowed as specified in the CC-BY-3.0 license.
1 Introduction
The underlying structure of the electroweak Standard Model (SM) is based on the non-Abelian S U(2)
L× U(1)
Ygauge group. This model has been very successful in describing currently available experimental data. Features like vector boson masses and their coupling to fermions have been precisely tested at LEP, the Tevatron and SLD [1, 2]. However triple gauge boson couplings (TGC) predicted by this theory have not yet been determined with the same precision.
In the SM the TGC vertex is completely fixed by the electroweak gauge structure and so a precise measurement of this vertex, through the analysis of diboson production at the LHC, is essential to test the high energy behavior of electroweak interactions and to probe for possible new physics in the bosonic sector. Any deviation from gauge constraints can cause a significant enhancement of the production cross section at high diboson invariant mass due to anomalous gauge boson couplings. Furthermore supersymmetric models with an extended Higgs sector (charged Higgs) as well as models with extra vector bosons (e.g. W
0) can contribute to W
±Z pair production [3].
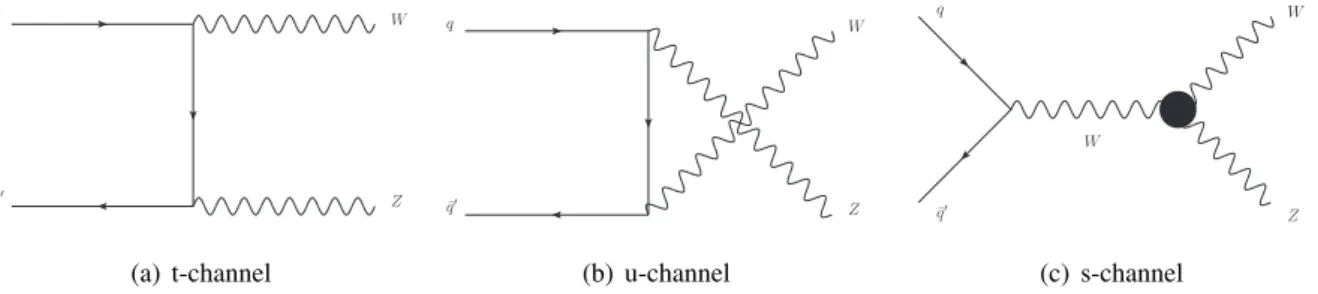
At the LHC, the dominant W
±Z production mechanism is from quark-antiquark initial states. Figure 1 shows the leading-order Feynman diagrams for W
±Z production from q q ¯
0initial states.
W
Z q
¯ q!
(a) t-channel
W
Z q
¯ q!
(b) u-channel
q
W
W
¯ Z q!
(c) s-channel
Figure 1: The SM tree-level Feynman diagrams for W
±Z production through the q q ¯
0initial state in hadron colliders. The s-channel diagram, on the right, contains the WWZ TGC vertex.
This note presents a measurement of the W
±Z → `ν`` production cross section by the ATLAS detector in LHC proton-proton collisions at √
s = 8 TeV. The cross section has previously been measured in proton-proton collisions at √
s = 7 TeV using a total integrated luminosity of 4.64 fb
−1[4]. The present measurement is based on an integrated luminosity of 13 fb
−1collected by ATLAS in 2012 with a fully operational detector and stable beam conditions. The theoretical prediction for the W
±Z production cross section, for a Z boson in the mass range between 66 GeV and 116 GeV, calculated at next-to-leading order in QCD (NLO) using MCFM [5] with the CT10 [6] NLO parton density function (PDF) set, is found to be 20.3 ± 0.8 pb. The uncertainty includes contributions from the choice of PDF which are evaluated by determining the variation with the 52 CT10 error sets (at 68%CL), and uncertainties from the choice of factorization and renormalization scales which are evaluated by moving each scale up and down by a factor of two from their default value of the dynamic mass of the WZ system (m
WZ).
The experimental signature of the `ν`` final state is analyzed in all four possible channels: eνee, µνee, eνµµ or µνµµ. The signal selection consists of three high transverse momentum (p
T), isolated leptons plus significant missing transverse momentum (E
Tmiss). With this selection the signal has relatively little background from SM processes. For this analysis of W
±Z production a cut-based approach with a simple set of cuts is chosen.
The main background contributions are: ZZ, W/Z + γ, W /Z +jets and top-quark production (t¯ t and single top). The background that arises from Z +jets and top-quark events is estimated using data driven methods and cross-checked with Monte Carlo (MC) predictions, while the background from ZZ and W/Z + γ is estimated using simulations.
This note is organized as follows. Section 2 briefly describes the data sample used in the analysis
and the Monte Carlo simulation used to estimate the signal expectation and certain background sources.
The event selection and signal e ffi ciency are discussed in Section 3 and the background estimation is presented in Section 4. The cross section results are presented in Section 5 and the conclusions are shown in Section 6.
2 Dataset and Monte Carlo Simulation
This study uses a data sample of proton-proton collisions collected between April and September 2012 at
√ s = 8 TeV. After data quality cuts, the total integrated luminosity used in the analysis is 13 fb
−1. The uncertainty on the integrated luminosity is 2.8%. It is derived following the same methodology as that detailed in Ref. [7], from a preliminary calibration of the luminosity scale derived from beam-separation scans performed in November 2012.
Events are selected with single-lepton triggers, requiring an isolated lepton with a p
Tgreater than 24 GeV or an electron (muon) with p
Tgreater than 60 (36) GeV with no isolation requirement.
The W
±Z production processes and subsequent pure leptonic decays are modeled by the P owheg [8]
MC generator with PDF set CT10, which incorporates the next-to-leading-order (NLO) QCD matrix elements into the parton shower by interfacing to Pythia [9] programs. The gauge-boson decays into τ leptons are included in dedicated MC samples in which the τ leptons decay to all known final states. The background processes that contribute to the selected W
±Z sample come from jets associated with W or Z gauge bosons (V +jets) and top-quark events (t¯ t, t¯ t + V and single top). We use MC@NLO [10] to model the t¯ t and single-top-quark events and A lpgen/J immy [11] to model the V +jets background. The diboson processes WW and ZZ are modeled with MC@NLO and P owheg , respectively, while W /Z + γ is modeled with Alpgen and Sherpa [12].
The ATLAS detector is described in detail elsewhere [13]. The detector response is simulated [14]
with a program based on GEANT4 [15]. The mean number of pp collisions per bunch crossing (referred to as pile-up) is between 5 and 40 for the 2012 data considered in this analysis. Additional inelastic pp events are included in the simulation, and the generated events are re-weighted to reproduce the observed distribution of the average number of collisions per bunch-crossing in the data. An additional contribution to the pile-up comes from the ongoing detector response to interactions in the preceding bunch crossings; this is also modeled in the simulation.
3 Event Selection
Signal events are characterized by three high p
Tisolated electrons or muons and large E
missT. All final states with electrons and muons for W
±Z events are considered : µ
+µ
−µ
±, µ
+µ
−e
±, e
+e
−µ
±, e
+e
−e
±.
In order to ensure that the selected leptons in the event originate from the primary vertex, the absolute distance in the z × sin(θ)-direction with respect to the primary vertex, |z × sin(θ) | , should be within 0.5 mm. Furthermore, the lepton candidates are required to have an impact parameter (IP) significance (the transverse impact parameter, d
0, divided by its error) less than 3 for muons while electrons must have an impact parameter significance less than 6 (the vertex whose constituent tracks have the largest sum of p
2Tis selected as the primary vertex).
Muons are identified by tracks (or track segments) reconstructed in the muon spectrometer matched to tracks reconstructed in the inner detector, and are required to have p
T> 15 GeV and |η| < 2.5
1. Their momenta are calculated by combining the information from the two subsystems and correcting for the
1ATLAS uses a right-handed coordinate system with its origin at the nominal interaction point. The z-axis is along the beam pipe, the x-axis points to the centre of the LHC ring and the y-axis points upward. Cylindrical coordinates (r,φ) are used in the transverse plane,φbeing the azimuthal angle around the beam pipe. The pseudorapidityηis defined asη=−ln[tan(θ/2)], whereθis the polar angle.
energy lost in the calorimeter. In order to reject muons from the decay of heavy quarks, the muons are required to be isolated by demanding that the scalar sum of the transverse momenta ( Σ p
T) of other tracks inside a cone of ∆ R = 0.2 around the muon is less than 15% of the muon p
T. Electrons are reconstructed from energy deposits in the electromagnetic calorimeter matched to a track in the inner detector. For the 2012 LHC data taking, the electron reconstruction algorithm has been improved with respect to 2011. The track pattern recognition and global χ
2fit were modified to account for energy losses due to bremsstrahlung, and the track-to-electromagnetic cluster matching algorithm was improved by applying a Gaussian-sum filter in order to be less sensitive to bremsstrahlung losses [16]. Electron candidates are required to have p
T> 15 GeV and |η| < 2.47. They must be isolated, using the same criterion as for muons. Furthermore, they are required to fulfill energy isolation criteria in a cone of
∆ R = 0.2 around the electron candidate: the sum of the calorimeter transverse energy in the cone, not including the energy of the candidate itself, after correction for pile-up, must be less than 14% of the electron p
T. Electron candidates within ∆ R = 0.1 of any selected muon are rejected, and if two electron candidates overlap within ∆ R = 0.1 the electron with the lower p
Tis rejected. Jets in the vicinity (
∆ R < 0.3) of any selected muon or electron are also removed. Events are required to have exactly three leptons selected as above (in order to decrease background from ZZ) and to have passed the single-muon or single-electron trigger requirement. In the trigger, an isolation cut is applied which requires the sum of the p
Tof tracks in a cone of size ∆ R < 0.2 around the lepton track to be less that 12% (10%) of the lepton p
Tfor electrons (muons), except for leptons passing the very high threshold triggers. To ensure that we select events for which the trigger e ffi ciency is well measured, a lepton that matches to an electron or muon reconstructed by the trigger algorithm (within ∆ R < 0.1 for the muons and ∆ R < 0.15 for the electrons) with p
T> 25 GeV is also required. The efficiency for triggering an event passing all other selection requirements is 99.5 ± 0.1%.
The E
missTis calculated using energy deposits in the calorimeters and muons reconstructed in the muon spectrometer. Calorimeter cells associated with a high-p
Telectron, photon, hadronically-decaying τ lepton, jet or muon are calibrated in accordance with that object. Cells not associated with any such high-p
Tobject are also taken into account.
Same flavor and opposite charge leptons are combined to form a Z candidate. The event is kept if the invariant mass is consistent with the Z mass : |m
ll− 91.1876| < 10 GeV. If more than one pair of leptons form a Z candidate, the candidate with invariant mass closest to the PDG mass is taken. The lepton that is not associated to the Z boson candidate must satisfy the combined (tight++) [17] quality definition for muons (electrons). The third lepton must have p
T> 20 GeV and satisfy the same relative isolation requirement but in a cone of ∆ R = 0.3. Missing transverse momentum in the event must be greater than 25 GeV and the transverse mass (m
WT) of the system composed of the lepton identified as coming from the W
±and E
missTmust be greater than 20 GeV, where m
WTis defined as (m
WT)
2= 2E
T`E
Tν− 2p
`Tp
νT.
4 Background Estimation
There are several major sources of background in W
±Z trilepton events. Background with three real
leptons, coming from ZZ events, and background from W/Z + γ events, in which the photon produces
an electron via conversion, is estimated using MC simulation. Contributions from background channels
including at least one “fake” lepton are estimated using data-driven methods. Fake leptons include pion,
kaon and heavy-quark decays to real leptons, in addition to jets misidentified as leptons. The main contri-
bution to this category arises from Z + X, WW , t¯ t and single-top-quark final states, with two hard leptons
and a third fake lepton. There are also events with one prompt lepton and two fake leptons. The main
contributor here is W
±events, but single top and semi-leptonic t¯ t events also contribute. The contribution
from the latter is found to be small.
4.1 Estimation of the background in the Z + µ final states
A sideband fit is used to estimate the top (t¯ t and single top) and Z + jets background in the Z + µ final states. The number of top and Z + jets background events in the signal region is estimated using a control region with an enhanced hadronic jet contribution. In this region the cut on the Z invariant mass is relaxed. Thus the invariant mass of the opposite charge and same flavor di-leptons has a peak at the Z-mass due to Z + jets along with a flat distribution of top events. The estimated number of Z + jets events in the control region can then be extrapolated to the signal region using a transfer factor obtained from MC which has been verified with data. This method is extensively discussed in Ref. [18].
The control region is defined by applying all the W
±Z analysis selection cuts except that, for the muon coming from the W, no isolation requirement is applied and the impact parameter significance cut is reversed to remove the ZZ contributions. In this control region, the side-band regions are dominated by top and the peak at the Z-mass is dominated by Z + jets background. This allows the simultaneous estimation of the top and Z + jets background contributions.
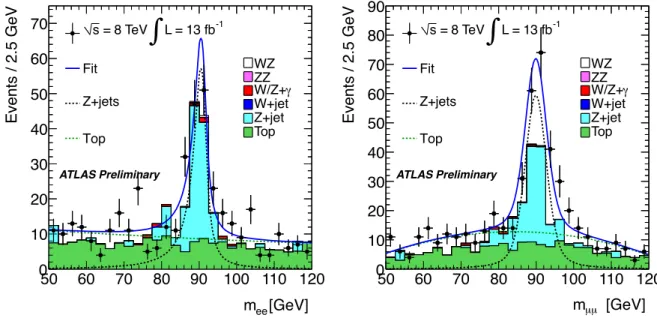
The distribution of opposite charge and same flavor di-lepton invariant mass in the control region of the data is shown in Fig. 2. It is fitted in the eeµ and µµµ channels separately using a second order Chebychev polynomial for the top component, and a Breit-Wigner line-shape convoluted with a Crystal- Ball resolution function for the Z + jets component. The initial parameters of the functions are obtained from a fit to the MC, and are allowed to fluctuate within 10% of their initial values. The results of the fit to the data are also presented in Fig. 2.
[GeV]
mee
50 60 70 80 90 100 110 120
Events / 2.5 GeV
0 10 20 30 40 50 60 70
WZ ZZ W/Z+a W+jet Z+jet Top L = 13 fb-1
0
= 8 TeV s
Fit Z+jets
ATLAS Preliminary Top
[GeV]
µ
mµ
50 60 70 80 90 100 110 120
Events / 2.5 GeV
0 10 20 30 40 50 60 70 80 90
WZ ZZ W/Z+a W+jet Z+jet Top L = 13 fb-1
0
= 8 TeV s
Fit Z+jets
ATLAS Preliminary Top
Figure 2: Distribution of the invariant mass of opposite-charge same-flavor di-lepton pairs in the back- ground control region for (left) the eeµ channel and (right) the µµµ channel. In this control region, the isolation requirement is not applied to the muon assigned to the W
±candidate and the impact significance requirement is reversed. The solid curve shows the result of the fit used to to obtain the top (t¯ t and single top) and Z + jets yields, while the dashed lines show the separate components.
In order to calculate the expected background in the signal region, a transfer factor obtained from the MC is used. The transfer factor is calculated as the ratio of the MC expectation in the signal region to the control region: f
transfer=
NNS RCR.
It is important to verify that the MC describes well the isolation and impact parameter significance
(IP) requirements on muons. To this end t¯ t and Z +jets control regions are built to study the data/MC
agreement. The isolation and IP significance efficiencies calculated in these control regions are in good agreement with those obtained from MC. There is a second method to calculate the transfer factor, based on the p
T-dependent efficiencies of the muon coming from the W
±to satisfy the IP significance and the isolation selection criteria as : f
transfer=
(1iso−×dd00)
where
d0and
isoare the p
T-dependent efficiencies.
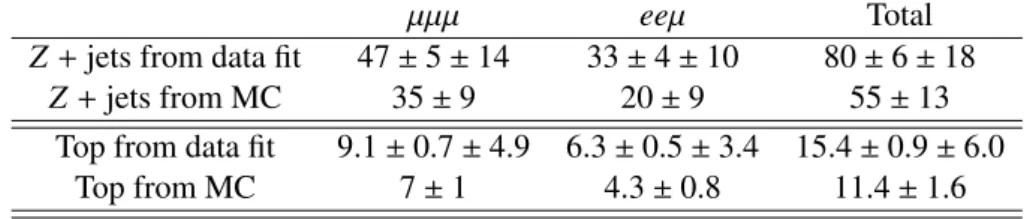
The final estimated numbers of top and Z + jets events in the signal region are given in Table 1. The systematic uncertainties are calculated taking into account the statistical error on the transfer factor and the discrepancies between two methods for the transfer factor calculation.
Table 1: Estimated numbers of top (t¯ t and single top) and Z +jets events in the signal region using the sideband method. The first error is statistical and the second one is systematic.
µµµ eeµ Total
Z + jets from data fit 47 ± 5 ± 14 33 ± 4 ± 10 80 ± 6 ± 18
Z + jets from MC 35 ± 9 20 ± 9 55 ± 13
Top from data fit 9.1 ± 0.7 ± 4.9 6.3 ± 0.5 ± 3.4 15.4 ± 0.9 ± 6.0
Top from MC 7 ± 1 4.3 ± 0.8 11.4 ± 1.6
4.2 Estimation of the background in the Z + e final states
The matrix method is used in the Z + e channels to perform a data-driven estimation of the background contribution from events with a genuine leptonic Z boson decay accompanied by a misidentified jet.
This background arises primarily from mis-reconstructed Z + jets and top (t¯ t and single top) events.
The matrix method is based on the number of leptons which pass or fail a set of requirements. These requirements then define two groups of events: loose and tight, where tight events are a subset of loose events that also pass the additional requirements. Two samples are defined :
• Tight-cut sample : events passing all signal extraction cuts
• Loose-cut sample : events passing all selection cuts, except for the isolation cuts and the electron identification requirement on the W daughter leptons.
Since the tight selection is chosen to be a subset of the loose selection, the number of N
looseand N
tightleptons is given by
N
loose= N
realloose+ N
loosefakeN
tight=
realN
realloose+
fakeN
fakeloose(1) where
real(
fake) is the probability for a real (fake) event that satisfies the loose criteria to also satisfy the tight ones. Therefore, these efficiencies are defined as:
real= N
realtightN
realloose(2)
fake= N
faketightN
fakeloose. (3)
The system of equations in Equation (1) can be solved to yield the number of fake events, N
faketightin the tight sample as:
N
faketight=
fake real−
fake(N
loosereal− N
tight). (4)
The tag and probe method is applied to independent samples of data using Z(→ e
+e
−) events and W + jets enriched samples to determine
realand
fakefor electrons. In order to define a control region dominated by W + jets, events with a lepton (serving as a tag) which satisfies the identification and isola- tion criteria required on W lepton candidates are selected. In addition the cuts E
missT> 20 GeV, m
WT> 40 GeV, and exactly one additional lepton candidate with opposite flavor and same charge are applied. The latter cut is used to reject Z, WW, and t¯ t processes.
The final background yields are derived from Equation (4) and the measured
realand
fake; they are shown in Table 2. For the systematic uncertainty on the fake electron estimation, we consider the fol- lowing sources: the statistical errors on
realand
fake, the bias due to the E
missTand m
WTrequirement when selecting the W + jets control region, the background contamination subtraction and the difference between data and MC for the e ffi ciency measurement
real.
Table 2: Estimated number of Z + jets and top (t¯ t and single top) events in the signal region in the eee and µµe channels. The first error is statistical and the second one is systematic.
µµe eee Total
Z + jets and top from data 57 ± 4 ± 11 37 ± 3 ± 11 93 ± 5 ± 16 Z + jets and top from MC 32 ± 9 29 ± 8 61 ± 12
5 Cross Section Measurement
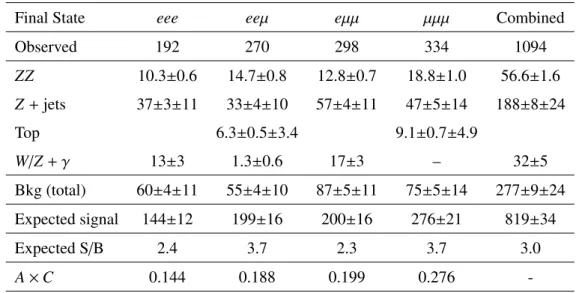
The numbers of expected and observed events after applying all selection cuts are shown in Table 3, with both statistical and systematic uncertainties. The W /Z + jets and top background contribution are estimated from data-driven methods and all other predictions come from MC simulation. We observe 1094 W
±Z candidates in data compared to an expectation of 819 ± 34 , signal and 277 ± 9 ± 24 back- ground events. In the same table, the product of correction factors for acceptance and efficiency losses (A × C) is also given for each of the 4 channels. The efficiency correction (C) is used to correct from the observed number of events to the number of events produced in a fiducial phase space (defined below).
The acceptance correction (A) is used to extrapolate from the fiducial phase space to the full phase space.
Both factors are estimated from MC.
5.1 Kinematic Distributions
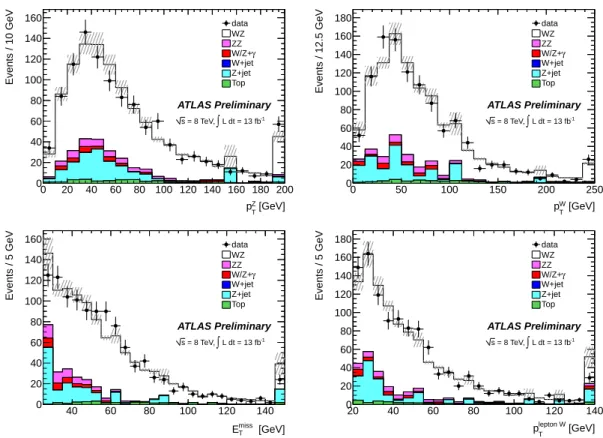
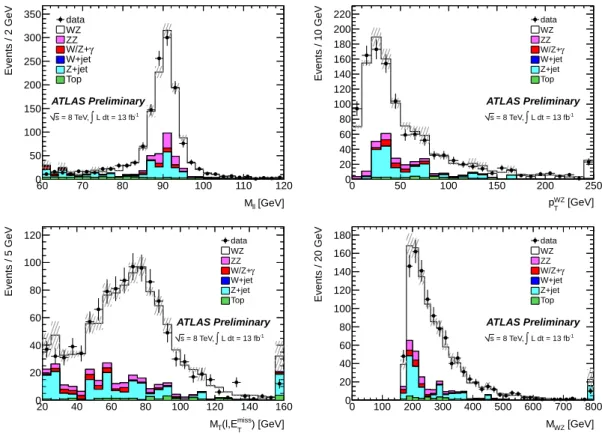
Figure 3 shows kinematic distributions after applying the full WZ analysis selection in the four channels:
the transverse momentum of the Z candidate, the W transverse momentum, the E
missTof the event as well as the W daughter lepton transverse momentum. Figure 4 shows the invariant mass of the Z candidate, the WZ system transverse momentum, the W transverse mass and the WZ invariant mass. All these distributions are shown after applying all of the WZ selection criteria, except for the Z candidate mass, where the Z mass window cut is not applied.
In the computation of the W
±Z mass, a two-fold ambiguity in the value of p
zcoming from the incomplete reconstruction of the neutrino four-momentum must be resolved. When both solutions for p
zare real, the one with a smaller magnitude is chosen. When no real solution is found, the real part of the
solution with the smaller magnitude is chosen. In all these distributions the top (t¯ t and single top) and
Z + jets backgrounds are normalized to the data-driven estimate. Overall the data are in good agreement
with MC expectations.
[GeV]
Z
pT
0 20 40 60 80 100 120 140 160 180 200
Events / 10 GeV
0 20 40 60 80 100 120 140
160 data
WZ ZZ γ W/Z+
W+jet Z+jet Top
ATLAS Preliminary
L dt = 13 fb-1
∫
= 8 TeV, s
[GeV]
W
pT
0 50 100 150 200 250
Events / 12.5 GeV
0 20 40 60 80 100 120 140 160
180 data
WZ ZZ γ W/Z+
W+jet Z+jet Top
ATLAS Preliminary
L dt = 13 fb-1
∫
= 8 TeV, s
[GeV]
miss
ET
40 60 80 100 120 140
Events / 5 GeV
0 20 40 60 80 100 120 140
160 data
WZ ZZ
γ W/Z+
W+jet Z+jet Top
ATLAS Preliminary
L dt = 13 fb-1
∫
= 8 TeV, s
[GeV]
lepton W
pT
20 40 60 80 100 120 140
Events / 5 GeV
0 20 40 60 80 100 120 140 160
180 data
WZ ZZ
γ W/Z+
W+jet Z+jet Top
ATLAS Preliminary
L dt = 13 fb-1
∫
= 8 TeV, s
Figure 3:
Kinematic distributions after applying all of theWZselection criteria in the four channels: the transverse momentum of theZ candidate (top left), theW transverse momentum (top right), the ETmissof the event (bottom left), as well as theWdaughter lepton transverse momentum (bottom right). The statistical uncertainty is shown by shaded bands. For top (tt¯and single top) and Z+jets, the expected shape is taken from simulation but the normalization is taken from the data-driven estimates. The rightmost bins include overflow.[GeV]
Mll
60 70 80 90 100 110 120
Events / 2 GeV
0 50 100 150 200 250 300 350 data
WZ ZZ γ W/Z+
W+jet Z+jet Top
ATLAS Preliminary
L dt = 13 fb-1
∫
= 8 TeV, s
[GeV]
WZ
pT
0 50 100 150 200 250
Events / 10 GeV
0 20 40 60 80 100 120 140 160 180 200
220 data
WZ ZZ γ W/Z+
W+jet Z+jet Top
ATLAS Preliminary
L dt = 13 fb-1
∫
= 8 TeV, s
) [GeV]
miss
(l,ET
MT
20 40 60 80 100 120 140 160
Events / 5 GeV
0 20 40 60 80 100
120 data
WZ ZZ γ W/Z+
W+jet Z+jet Top
ATLAS Preliminary
L dt = 13 fb-1
∫
= 8 TeV, s
[GeV]
MWZ
0 100 200 300 400 500 600 700 800
Events / 20 GeV
0 20 40 60 80 100 120 140 160
180 data
WZ ZZ γ W/Z+
W+jet Z+jet Top
ATLAS Preliminary
L dt = 13 fb-1
∫
= 8 TeV, s
Figure 4:
Distributions of: the invariant mass of theZcandidate (top left), theWZsystem transverse momentum (top right), theW transverse mass (bottom left) and theWZinvariant mass (bottom right). All these distributions are shown after applying all of theWZselection criteria in the four channels except theZ candidate mass. The statistical uncertainty is shown by shaded bands. For top (tt¯and single top) andZ+jets, the expected shape is taken from simulation but the normalization is taken from the data-driven estimates. The rightmost bins include overflow.Final State eee eeµ eµµ µµµ Combined
Observed 192 270 298 334 1094
ZZ 10.3±0.6 14.7±0.8 12.8±0.7 18.8±1.0 56.6±1.6
Z + jets 37±3±11 33±4±10 57±4±11 47±5±14 188±8±24
Top 6.3 ± 0.5 ± 3.4 9.1 ± 0.7 ± 4.9
W /Z + γ 13±3 1.3±0.6 17±3 – 32±5
Bkg (total) 60±4±11 55±4±10 87±5±11 75±5±14 277±9±24
Expected signal 144±12 199±16 200±16 276±21 819±34
Expected S / B 2.4 3.7 2.3 3.7 3.0
A × C 0.144 0.188 0.199 0.276 -
Table 3: Summary of observed events and expected signal and background contributions in the four tri- lepton channels and combined. The first error is statistical while the second is systematic. The expected signal includes the τ contribution. The top (t¯ t and single top) and Z + jets numbers are the data-driven estimate. The background from top in the eee and µµe channels is included in the corresponding Z + jets background, since they are estimated together with the matrix method. The acceptance times efficiency correction factor is also given for each channel.
5.2 Cross section extraction
In order to combine the di ff erent channels, a common phase space region which approximates the event selection is defined in which a fiducial cross section is extracted. The common phase space is defined as p
µ,eT> 15 GeV for the leptons from the decay of the Z bosons, p
µ,eT> 20 GeV for the leptons from the decay of the W
±bosons, |η
µ,e| < 2.5, p
νT> 25 GeV, |m
``− m
Z| < 10 GeV, and M
TW> 20 GeV. In simulated events, the momenta of photons that are within ∆ R = 0.1 of one of the three leptons are added to the lepton momentum. In addition, a separation of ∆ R > 0.2 between the two leptons of the Z boson decay and ∆ R > 0.3 between the lepton from the W boson and each lepton from the Z boson is required.
This requirement emulates the isolation criteria applied to the leptons, which tend to reduce the signal acceptance for events with very large Z boson tranverse momenta.
The total and fiducial cross sections are determined using a likelihood fit with the systematic uncer- tainties included as nuisance parameters. Note that the fiducial cross section result does not include the contribution from taus decaying to leptons. The tau contribution from the WZ decays as predicted by the MC simulation is taken into account in the fiducial cross section fit.
The total cross section is determined by extrapolating the W
±Z fiducial cross section to the full
phase-space, correcting for the Z → l
+l
−and the W → l
±ν branching ratios and the acceptance of the
fiducial cuts. The total cross section measured here requires the Z boson to have a mass between 66 GeV
and 116 GeV. The acceptance of the fiducial cuts, calculated at NLO using MCFM version 6.2 with
CT10 PDF set, is 0.336 ± 0.002 ± 0.006, where the second error is due to the theoretical uncertainties,
including uncertainties because of the choice of PDF, evaluated by determining the variation with the
52 CT10 error sets and adding in quadrature the difference between the central value calculated using
MSTW2008 with that calculated using CT10, and uncertainties in the factorization and renormalization
scales, evaluated by moving each up and down by a factor of two from their default value of dynamic
m
WZ. The MCFM calculation is performed at parton level, before parton showering. In order to account
for the effect of showering, we compute the acceptance with P owheg after showering and compare to
MCFM. The difference of 1% is included as systematic uncertainty in the acceptance.
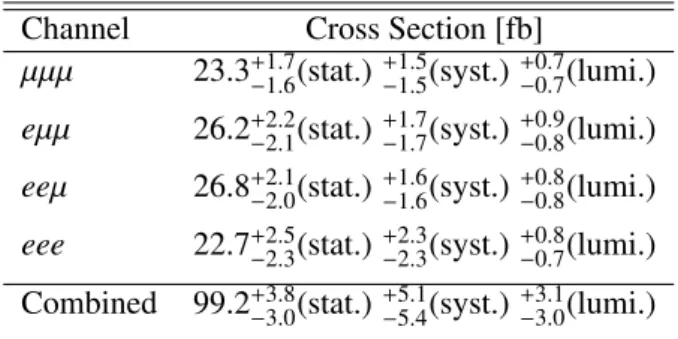
The final results for the fiducial and total cross section measurements in each channel and for the combined measurement are shown in Tables 4 and 5. The systematic uncertainties include all sources except luminosity, which is listed separately.
The measurement uncertainty is dominated by systematic uncertainties coming from the reconstruc- tion acceptance factor, the background estimate and the luminosity. The systematic uncertainty on the reconstruction acceptance factor is dominated by uncertainties on reconstruction efficiencies for electrons and muons, p
Tscale and resolution, and e ffi ciencies for the isolation and impact-parameter requirements which are studied using W
±, Z, and J/ψ decays. Differences between data and simulated samples are accounted for, and the uncertainties in the correction factors are used to evaluate the systematic uncer- tainties. The uncertainties related to E
missTcome mainly from the calibration of cluster and jet energies.
The systematic uncertainty from the background is dominant, amounting to ± 5% and originates from the data-driven method estimate of the background contributions dominated by the one for Z + jets production. Finally the systematic uncertainty on luminosity is 2.8%.
The expected cross section from MCFM assuming re-normalization and factorization scales µ
r= µ
f= m
WZand the CT10 NLO PDF is 20.3 ± 0.8 pb. The theoretical fiducial cross section for one single channel is 24.8 ± 0.9 fb.
Channel Cross Section [fb]
µµµ 23.3
+−1.61.7(stat.)
+−1.51.5(syst.)
+−0.70.7(lumi.) eµµ 26.2
+−2.12.2(stat.)
+−1.71.7(syst.)
+−0.80.9(lumi.) eeµ 26.8
+−2.02.1(stat.)
+−1.61.6(syst.)
+−0.80.8(lumi.) eee 22.7
+−2.32.5(stat.)
+−2.32.3(syst.)
+−0.70.8(lumi.) Combined 99.2
+−3.03.8(stat.)
+−5.45.1(syst.)
+−3.03.1(lumi.)
Table 4: Measured fiducial cross sections for each channel and their sum.
Channel Cross Section [pb]
µµµ 19.1
+−1.31.4(stat.)
+−1.31.3(syst.)
+−0.60.6(lumi.) eµµ 21.4
+−1.71.9(stat.)
+−1.51.5(syst.)
+−0.70.7(lumi.) eeµ 21.9
+−1.61.8(stat.)
+−1.41.4(syst.)
+−0.60.7(lumi.) eee 18.6
+−1.92.1(stat.)
+1.9−1.9(syst.)
+−0.60.6(lumi.) Combined 20.3
+−0.70.8(stat.)
+−1.11.2(syst.)
+−0.60.7(lumi.)
Table 5: Measured total cross sections for each channel and combined.
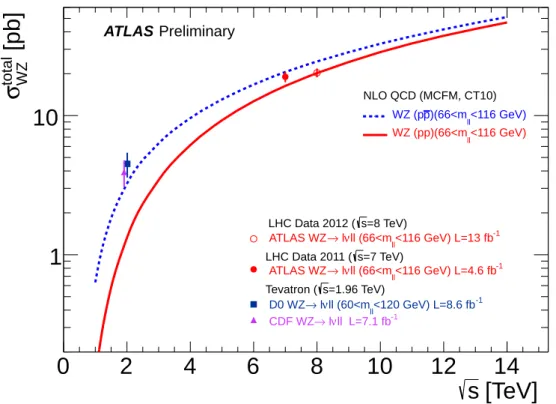
Figure 5 shows measurements of the total W
±Z production cross section as a function of center-of- mass energy, from the ATLAS experiment at the LHC, and from the CDF [19] and D0 [20] experiments at the Tevatron, as well as the theoretical predictions.
6 Conclusions
A measurement of the W
±Z production cross section with the ATLAS detector in LHC proton-proton collisions at √
s = 8 TeV has been performed using events with electrons and muons in the final state. In a
dataset with an integrated luminosity of 13 fb
−1a total of 1094 candidates is observed with a background expectation of 277 ± 9(stat.)±24(syst.) events. The Standard Model expectation for the number of signal events is 819 ± 34. The fiducial and total cross sections are determined to be
σ
WZ→lνlf id 0l0= 99.2
+−3.03.8(stat.)
+−5.45.1(syst.)
+−3.03.1(lumi.) fb
σ
totWZ= 20.3
+−0.70.8(stat.)
+−1.11.2(syst.)
+−0.60.7(lumi.) pb
The result is in agreement with the SM total cross section of 20.3 ± 0.8 pb.
[TeV]
s
0 2 4 6 8 10 12 14
[pb]
total WZσ
1
10
<116 GeV))(66<mll
p WZ (p
<116 GeV) WZ (pp)(66<mll
=8 TeV) s LHC Data 2012 (
=7 TeV) s LHC Data 2011 (
=1.96 TeV) s
Tevatron (
<116 GeV) L=13 fb-1
ll (66<mll
ν
→ l ATLAS WZ
<116 GeV) L=4.6 fb-1
ll (66<mll
ν
→ l ATLAS WZ
<120 GeV) L=8.6 fb-1
ll (60<mll
ν
→ l D0 WZ
ll L=7.1 fb-1
ν
→ l CDF WZ
Preliminary ATLAS
NLO QCD (MCFM, CT10)
Figure 5:
Measurements and theoretical predictions of the total W±Z production cross section as a function of center-of-mass energy. Experimental measurements from CDF and D0 in proton antiproton collisions at the Tevatron at √s=1.96 TeV, and experimental measurements from ATLAS in proton-proton collisions at the LHC at √
s=7 TeV and √
s=8 TeV are shown. The blue dashed line shows the theoretical prediction for theW±Z production cross section in proton anti-proton collisions, calculated at NLO using MCFM with PDF set CT10. The solid red line shows the theoretical prediction for theW±Z production cross section in proton-proton collisions, calculated in the same way. The ATLAS results at 8 TeV define the total cross section with aZboson with mass between 66 GeV and 116 GeV. The results from CDF define the total cross section assuming zero-width for theZ boson and neglecting theγ∗contribution. The results from D0 define the total cross section with aZboson with mass between 60 GeV and 120 GeV.