ATLAS-CONF-2018-029 05July2018
ATLAS CONF Note
ATLAS-CONF-2018-029
5th July 2018
Measurements of fiducial and differential cross-sections of t t ¯ production with additional heavy-flavour jets in proton-proton collisions at √
s = 13 TeV with the ATLAS detector
The ATLAS Collaboration
This note presents measurements of t¯ t production in association with additional b -jets in pp collisions at the LHC at a centre-of-mass energy of 13 TeV. Fiducial cross-section meas- urements are performed in the dilepton and lepton-plus-jets t¯ t decay channels. Results are presented at particle level in the form of inclusive cross-sections of t t ¯ final states with three and four b -jets as well as differential cross-sections as a function of global event properties and properties of b -jet pairs. The measured inclusive fiducial cross-sections generally exceed the t tb¯ ¯ b predictions from various next-to-leading-order matrix element calculations matched to a parton shower, but are compatible within the total uncertainties. The experimental uncertainties are smaller than the ones on the predictions. Comparisons to state-of-the-art theoretical predictions with the differential measurements are shown and good agreement with data is found for most of them.
© 2018 CERN for the benefit of the ATLAS Collaboration.
1 Introduction
Measurements of the production cross-section of top-quark-antiquark pairs ( t t ¯ ) with additional jets provide important tests of quantum chromodynamics (QCD) predictions. Among these, the process of t¯ t produced in association with jets originating from b -quarks ( b -jets) challenges the QCD calculations due to the non- negligible mass of the b -quark. It is therefore important to compare the predictions with both inclusive and differential experimental cross-section measurements of t¯ t production with additional heavy-flavour jets. State-of-the-art QCD calculations give predictions for the t t ¯ production cross-section with up to two additional partons at next-to-leading order (NLO) in perturbation theory matched to a parton shower [1], and the QCD production of t¯ tb b ¯ has been calculated at NLO matched to a parton shower [2–5].
Moreover, since the discovery of the Higgs boson [6, 7], the determination of the Higgs coupling to the heaviest elementary particle, the top quark, is a crucial test of the Standard Model (SM). Direct measurements of this top-quark Yukawa coupling are performed in events where a Higgs boson is produced in association with a top-quark pair ( t¯ t H ) [8, 9]. Improving the precision of the t¯ t H production measurement in each decay channel of the Higgs boson is important for further constraints in Higgs couplings and for stringent tests of SM electroweak predictions. The Higgs branching ratio is dominated by the H → b b ¯ decay, and therefore the t¯ t H process can be measured with the highest statistics in events where the Higgs boson decays in this manner, leading to a t tb ¯ b ¯ final state. However, this channel suffers from a large background from t t ¯ + b -jets [10, 11], thus the observation of t¯ t H has primarily been driven by the H → W W
∗, H → ττ and H → γγ decay channels [8, 9]. A better understanding of the QCD production of t¯ tb b ¯ as predcited by the SM, in particular improved Monte Carlo (MC) modelling, would be of benefit to measurements of t¯ t H (H → b b) ¯ . The measurements presented in this note aim to help improve the QCD MC modelling for the t¯ tb b ¯ process. The differential observables are particularly interesting as they are used to separate phase space regions with a dominant contribution of QCD produced t tb ¯ b ¯ events from regions enhanced with events of t¯ t -associated Higgs production ( t¯ t H ) with H → b b ¯ decays. Even though the aim is to improve the modelling of QCD production of additional b -jets in t t ¯ events, the analysis measures their production inclusively without separating the different production channels such as t t H ¯ or t t ¯ associated vector boson production ( t tV ¯ ) in order to avoid a potential bias from theoretical models.
Measurements of t¯ t production with additional heavy-flavour jets have been performed by ATLAS and CMS at
√ s = 7 TeV [12] and
√ s = 8 TeV [13–15]. CMS also reported a measurement of the inclusive t¯ tb b ¯ cross-section using 2.3 fb
−1at
√ s = 13 TeV [16]. In this note measurements of fiducial cross-sections are presented, based on data that were recorded by the ATLAS detector during 2015 and 2016 in pp collisions at a centre-of-mass energy
√ s = 13 TeV, corresponding to a total integrated luminosity of 36 . 1 fb
−1. In addition, differential measurements are presented for the first time at this centre-of-mass energy.
As the top quark decays to a b -quark and W boson nearly 100% of the time, t t ¯ decays are typically classified based on how the two W bosons decay. In this analysis, two channels are considered: the e µ channel, in which both W bosons decay leptonically, one to a muon and muon neutrino and the other to an electron and electron neutrino, and the lepton-plus-jets channel (lepton + jets), in which one W boson decays into an isolated charged lepton (an electron or muon) and corresponding neutrino and the other W boson decays into a pair of quarks. Electrons and muons produced either directly in the decay of the W boson or via an intermediate τ lepton are included in both channels.
As the decays of the top-quark-pair result in two b -quarks, the final state with one or two additional
b -jets contains up to four b -jets. This analysis does not attempt to identify the origin of the b -jets, i.e. it
does not distinguish between additional b -jets and b -jets that come from the top-quark decays. This is
to avoid using parton-level information for identification of b -jets to a single production process, leading to significant modelling uncertainties. Instead, differential cross-sections are measured as a function of kinematic distributions of pairs of b -jets which are built to enhance the contribution of a specific production mechanisms: the pair of the two b -jets closest in angular distance which is expected to be mainly b -jets from gluon splitting and the pair of the two highest p
Tb -jets which is dominated by top-pair production.
For each of these pairs, the angular separation between the b -jets ( ∆R(b, b) )1, the invariant mass ( m
bb) and transverse momentum ( p
T,bb) are measured.
The results are presented for events with at least three b -jets in the e µ channel and with at least four b -jets in the lepton + jets channel. It should be noted that for events with at least three b -jets, it is likely that one of the two closest b -jets is originating from the top quark. Hence the simple picture that the closest two b -jets are dominantly from gluon splitting may not apply. However, these observables are used for reconstruction of the final state in analyses with multiple b -jets and therefore probing the modelling of these observables is important. In addition, the differential cross-sections are measured as a function of the transverse momentum ( p
T) of each of the b -jets, the scalar sum of the p
Tof lepton and jets in the events ( H
T) and of only jets in the events ( H
hadT
) and as a function of the b -jet multiplicity ( N
b-jets).
The cross-sections are obtained by subtracting the estimated number of non- t¯ t background events from the data distributions. At detector-level, jets are identified as containing b -hadrons (" b -tagging") by a multivariate analysis algorithm. The t¯ t background with additional light-flavour and charm quark-jets wrongly identified as b -jets is evaluated using a template fit, in which the templates are constructed from the output discriminant of the b -tagging algorithm. The background-subtracted distributions are corrected for acceptance and detector effects using an unfolding technique that includes the corrections for the t¯ t related backgrounds.
This note is laid out as follows. The experimental setup for the collected data is described in Section 2.
Details of the simulation used throughout the document are provided in Section 3. The reconstruction and identification of leptons and jets, b -tagging of jets at detector level, and the objects definitions at particle level are described in Section 4. The selection of reconstructed events and definition of fiducial phase space are given in Section 5. Estimation of the background from non- t¯ t processes is described in Section 6. The method to estimate the t¯ t background with additional jets mis-identified as b -jets and the unfolding procedure to correct the data to particle level for fiducial cross-section measurements are explained in Section 7. Sources of systematic uncertainties and their propagation to the measured cross- sections are described in Section 8. The measured fiducial and normalised differential cross-sections and the comparison with various theoretical predictions are presented in Section 9. Finally, the results are summarised in Section 10.
2 ATLAS detector
The ATLAS detector [17] at the LHC covers nearly the entire solid angle around the collision point. It consists of an inner-tracking detector surrounded by a thin superconducting solenoid, electromagnetic and hadronic calorimeters, and a muon spectrometer incorporating three large superconducting toroidal
1ATLAS uses a right-handed coordinate system with its origin at the nominal interaction point (IP) in the centre of the detector and thez-axis along the beam pipe. The x-axis points from the IP to the centre of the LHC ring, and the y-axis points upward. Cylindrical coordinates(r, φ)are used in the transverse plane,φbeing the azimuthal angle around thez-axis. The pseudorapidity is defined in terms of the polar angleθasη=−ln tan(θ/2). The angular separation between two points inη andφis defined as∆R=q
(∆η)2+(∆φ)2.
magnets. The inner detector (ID) system is immersed in a 2 T axial magnetic field and provides charged particle tracking in the pseudorapidity range |η| < 2 . 5.
The high-granularity silicon pixel detector covers the interaction region and is followed by the silicon microstrip tracker. A new innermost silicon pixel layer has been added to the inner-detector before the Run- 2 data taking [18], which improves the identification of b -jets. These silicon detectors are complemented by the transition radiation tracker, which enables radially extended track reconstruction up to | η| = 2 . 0 and provides separation between electrons and pions.
The calorimeter system covers the range |η| < 4 . 9. Within the region |η | < 3 . 2, electromagnetic calorimetry is provided by barrel and endcap high-granularity lead/liquid-argon (LAr) electromagnetic calorimeters, with an additional thin LAr presampler covering |η| < 1 . 8, to correct for energy loss in material upstream of the calorimeters. Hadronic calorimetry is provided by the steel/scintillating- tile calorimeter, segmented into three barrel structures within |η | < 1 . 7, and two copper/LAr hadronic endcap calorimeters. The solid angle coverage is completed with forward copper/LAr and tungsten/LAr calorimeter modules optimised for electromagnetic and hadronic measurements respectively.
The muon spectrometer (MS) comprises separate trigger and high-precision tracking chambers measuring the deflection of muons in a magnetic field generated by superconducting air-core toroids. The field integral of the toroids ranges between 2.0 and 6.0 T m across most of the detector. A set of precision chambers covers the region |η | < 2 . 7 with three layers of drift tubes, complemented by cathode strip chambers in the forward region, where the background is highest. The muon trigger system covers the range |η| < 2 . 4 with resistive plate chambers in the barrel, and thin gap chambers in the endcap regions.
A two-level trigger system is used to select interesting events [19, 20]. The Level-1 trigger is implemented in hardware and uses a subset of detector information to reduce the event rate to a design value of at most 100 kHz. This is followed by a software-based trigger that reduces the event rate to about 1 kHz.
3 Monte Carlo simulation
Monte Carlo simulations are used in three ways in this analysis: to estimate the signal and background composition of the selected data samples, to determine correction factors for detector and acceptance effects for unfolding, and finally to estimate systematic uncertainties. In addition, theoretical predictions are compared to the unfolded data. The setups used to generate the samples are described in the following.
The nominal t¯ t sample is generated using the Powheg-Box next-to-leading order (NLO) generator (ver- sion 2, r3026) [21–24] with the NNPDF3.0NLO set of parton distribution functions (PDF) in the matrix element calculation. The parton shower, fragmentation, and the underlying event are simulated using Pythia 8.210 [25] with the NNPDF2.3LO PDF sets [26, 27] and the corresponding A14 set of tunable parameters [28]. The h
dampparameter, which controls the p
Tof the hardest additional parton emission beyond the Born configuration, is set to 1 . 5 m
t, where m
tdenotes the top-quark mass [29]. The main effect of this is to regulate the high- p
Temission against which the t t ¯ system recoils. The renormalisation and factorisation scales are set to µ = q
m
2t+ p
2T,t
, where p
T,tis the transverse momentum of the top quark.
Additional jets, including b -jets, are generated by the hardest additional parton emission and from parton showering which is affected by significant theoretical uncertainties.
Processes involving the production of a W, Z or Higgs boson in addition to a t¯ t pair are simulated using
the MadGraph5_aMC@NLO generator [30, 31] at NLO accuracy in the matrix element calculation.
The parton shower, fragmentation and underlying event are simulated using Pythia 8 using the A14 parton shower tune. A dynamic renormalisation and factorisation scale is used and chosen as H
T/ 2. The NNPDF3.0NLO PDF set is used in the matrix element calculation while the NNPDF2.3LO PDF set is used in the parton shower. In the case of t¯ t H , the Higgs boson mass is set to 125 GeV and all possible Higgs decay modes are allowed, with the branching fractions calculated with HDECAY [32, 33]. The t¯ tW and t¯ t Z samples are normalised to NLO cross-sections computed using MadGraph5_aMC@NLO. The t t H ¯ cross-section is normalised to NLO accuracy in QCD, including NLO electroweak corrections [32].
Alternative t¯ t samples are generated to assess the uncertainties due to a particular choice of QCD MC model for the production of the additional b -jets and to compare with unfolded data. These alternative samples are listed in Table 1 and comprise variations of the renormalisation and factorisation scales of the nominal t t ¯ sample as well as variations of the parton shower, hadronisation and underlying event model. Furthermore, simulations with different matrix element to parton shower matching algorithms are performed.
In order to investigate the effects of initial and final-state radiation, two samples are generated using Powheg+Pythia 8 with the renormalisation and factorisation scales varied by a factor of 2 (0.5) and using low (high) radiation variations of the A14 tune and an h
dampvalue of 1 . 5 m
t(3 . 0 m
t), corresponding to less (more) parton-shower radiation [29]. These samples are called Powheg+Pythia 8 (RadLo) and Powheg+Pythia 8 (RadHi) in the following. To estimate the effect of the choice of parton shower algorithm, a MC sample is generated by interfacing Powheg with Herwig 7 [34, 35] (v7.01) using the H7UE set of tunable parameters [35].
In order to estimate the effects of using an NLO t t ¯ matrix element calculation and parton shower to predict additional b -jets, events are generated with Sherpa 2.2.1 [36], which models the zero and one additional-parton process at NLO accuracy and up to four additional partons at LO accuracy, using the MePs@Nlo prescription [37]. Additional b -quarks are treated as massless and the NNPDF3.0NNLO PDF set is used. The calculation uses a parton shower tune developed by authors. This sample is referred to as Sherpa 2.2 t¯ t .
In addition to the t¯ t samples described above, a t t ¯ sample is generated using MadGraph5_aMC@NLO [30]
(v2.3.3), interfaced to Pythia 8.210 and is referred to as MadGraph5_aMC@NLO+Pythia 8 hereafter.
As with the nominal Powheg+Pythia 8 t¯ t sample, the NNPDF3.0NLO PDF set is used in the matrix element calculation and the NNPDF2.3LO PDF set is used in the parton shower. This sample is used to calculate the fraction of t¯ t +V/H events in t¯ t events and to compare with the data. The A14 set of tuneable parameters is used for Pythia.
The t t ¯ samples are normalised to a cross-section of σ
t¯t= 832
+46−51pb as calculated with the Top++2.0 program to next-to-next-to-leading order (NNLO) in perturbative QCD, including soft-gluon resumma- tion to next-to-next-to-leading-log (NNLL) order (see Ref. [38] and references therein), and assuming m
t= 172 . 5 GeV. The uncertainty in the theoretical cross-section comes from independent variations of the factorisation and renormalisation scales and variations in the PDF and α
s, following the PDF4LHC prescription with the MSTW 2008 NNLO, CT10 NNLO and NNPDF2.3 5f FFN PDF sets (see Ref. [39]
and references therein, and Refs. [40–42]).
Four more predictions are calculated only for comparisons with data which are all based on t tb¯ ¯ b matrix elements.
• A dedicated sample of t tb¯ ¯ b events is generated using Sherpa+OpenLoops [2]. t¯ tb b ¯ matrix elements
are calculated with massive b -quarks at NLO, using the Comix [43] and OpenLoops [44] matrix
element generators, and merged with the Sherpa parton shower, tuned by the authors [45]. The four-flavour NNLO NNPDF3.0 PDF set is used and the renormalisation scale ( µ
R) is set to µ
R= Q
i=t,t,b,¯ b¯
E
1 4
Ti
, where E
Tirefers to the transverse energy of the parton i in the partonic final state.
The factorisation ( µ
F) and resummation scales ( µ
Q) are both set to µ
F= µ
Q=
12P
i=t,t,b,¯ b¯
E
T,i. This sample is referred to as Sherpa 2.2 t¯ tb b ¯ (4FS).
• A dedicated sample of t¯ tb b ¯ events is generated using the PowHel generator [3], where the matrix elements are calculated at NLO assuming massless b -quarks and using the five-flavour NLO NNPDF3.0 PDF set. Events are matched to the Pythia 8 parton shower using the Powheg method. This sample is referred to as PowHel+Pythia 8 t¯ tb b ¯ (5FS). The factorisation and the renormalisation scales and the h
dampparameter are set to H
T/ 2.
• A dedicated sample of t¯ tb b ¯ events using the PowHel generator where the matrix elements are calculated at NLO with massive b -quarks and using the four-flavour NLO NNPDF3.0 PDF set [4].
Events are matched to the Pythia 8 parton shower using the Powheg method. This sample is referred to as PowHel+Pythia 8 t¯ tb b ¯ (4FS). The factorisation and the renormalisation scales and the h
dampparameter are set to H
T/ 2.
• A dedicated sample of t¯ tb b ¯ events using the Powheg generator where t tb ¯ b ¯ matrix elements are calculated at NLO with massive b -quarks and using the four-flavour NLO NNPDF3.0 PDF set [5].
Events are matched to the Pythia 8 parton shower using the Powheg method. This sample is referred to as Powheg+Pythia 8 t¯ tb b ¯ (4FS) to distinguish it from the nominal Powheg+Pythia 8 sample mentioned above. As with the two PowHel samples, the factorisation and the renormalisation scales and the h
dampparameter are set to H
T/ 2.
For all samples involving top quarks, m
tis set to 172.5 GeV and the EvtGen v1.2.0 program [46] is used for properties of the bottom and charm hadron decays. To preserve the spin correlation information, top quarks are decayed by MadSpin [47] in the Powheg and MadGraph5_aMC@NLO+Pythia 8 samples.
Sherpa performs its own calculation for spin correlation. Both of the PowHel+Pythia 8 t tb ¯ b ¯ samples use Pythia to decay the top quarks, hence these predictions miss spin correlation information.
The production of single top-quarks in the tW and s -channel is simulated using the Powheg-Box (v2, r2819) NLO generator with the CT10 PDF set in the matrix element calculations. Electroweak t -channel single top-quark events are generated using the Powheg-Box (v1, r2556) generator. This generator uses the four-flavour scheme for the NLO matrix elements calculation together with the fixed four-flavour PDF set CT10f4. For all top processes, top-quark spin correlations are preserved (in the case of the t -channel, top quarks are decayed using MadSpin). Interference between t t ¯ and tW production is accounted for using the diagram-removal scheme [48]. The parton shower, fragmentation, and the underlying event are simulated using Pythia 6.428 [49] with the CTEQ6L1 PDF sets and the Perugia 2012 tune (P2012) [50, 51]. The single-top MC samples for the t - and s -channels are normalised to cross-sections from NLO predictions [52, 53], while the tW -channel MC sample is normalised to approximate NNLO [54].
Events containing W or Z bosons with associated jets are simulated using the Sherpa 2.2.1 generator.
Matrix elements are calculated for up to two partons at NLO and up to four partons at leading order (LO)
using the Comix and OpenLoops matrix element generators and merged with the Sherpa parton shower
using the MePs@Nlo prescription. The NNPDF3.0NNLO PDF set is used in conjunction with parton
shower tuning developed by the Sherpa authors. The W /Z +jets events are normalised to NNLO cross
sections, computed using Fewz [55] with the MSTW 2008 NNLO PDF set.
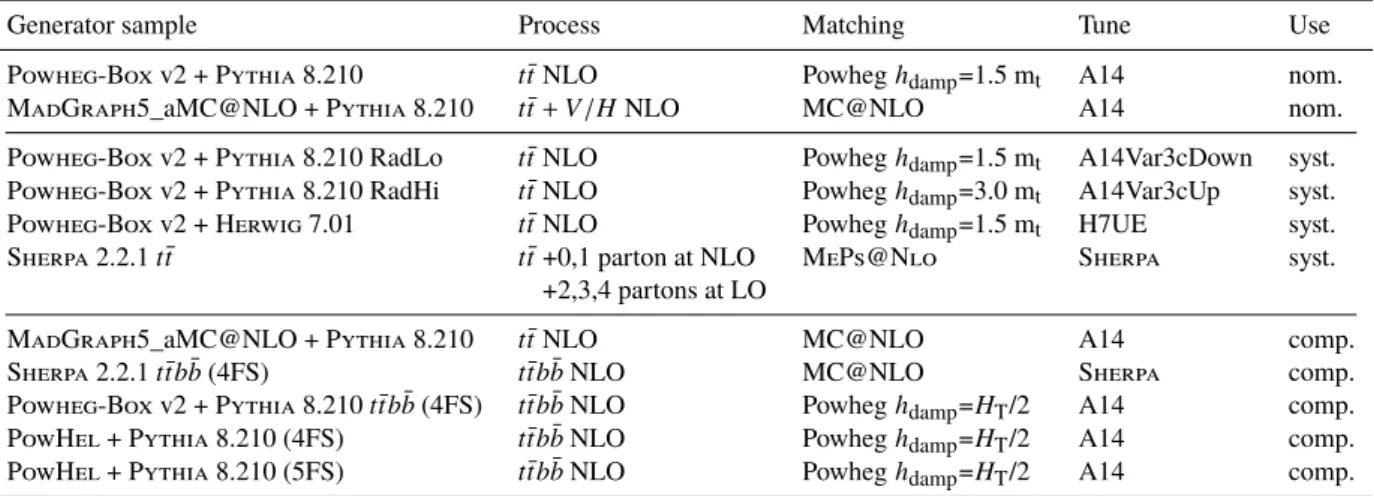
Table 1: Summary of MC setups used for modelling the signal processes (tt¯+ttV¯ +tt H¯ ) for the data analysis and for comparisons to the measured cross-sections and differential distributions. All samples use the NNPDF3.0NLO PDF set with the exception of the two Sherpa samples which use NNPDF3.0NNLO. The different blocks indicate from top to bottom the samples used as nominal MC (nom.), systematic variations (syst.) and for comparison only (comp.). For details see Section3.
Generator sample Process Matching Tune Use
Powheg-Box v2 + Pythia 8.210 t¯tNLO Powheghdamp=1.5 mt A14 nom.
MadGraph5_aMC@NLO + Pythia 8.210 t¯t+V/HNLO MC@NLO A14 nom.
Powheg-Box v2 + Pythia 8.210 RadLo t¯tNLO Powheghdamp=1.5 mt A14Var3cDown syst.
Powheg-Box v2 + Pythia 8.210 RadHi t¯tNLO Powheghdamp=3.0 mt A14Var3cUp syst.
Powheg-Box v2 + Herwig 7.01 t¯tNLO Powheghdamp=1.5 mt H7UE syst.
Sherpa 2.2.1t¯t t¯t+0,1 parton at NLO MePs@Nlo Sherpa syst.
+2,3,4 partons at LO
MadGraph5_aMC@NLO + Pythia 8.210 t¯tNLO MC@NLO A14 comp.
Sherpa 2.2.1t¯tbb¯(4FS) t¯tb¯bNLO MC@NLO Sherpa comp.
Powheg-Box v2 + Pythia 8.210t¯tb¯b(4FS) t¯tb¯bNLO Powheghdamp=HT/2 A14 comp.
PowHel + Pythia 8.210 (4FS) t¯tbb¯NLO Powheghdamp=HT/2 A14 comp.
PowHel + Pythia 8.210 (5FS) t¯tb¯bNLO Powheghdamp=HT/2 A14 comp.
Diboson processes are simulated using the Sherpa 2.1.1 generator. Matrix elements are calculated using the Comix and OpenLoops matrix element generators and merged with the Sherpa parton shower using the MePs@Nlo prescription. In the case of both bosons decaying leptonically, matrix elements contain all diagrams with four electroweak vertices and are calculated for up to one (four charged leptons or two charged leptons and two neutrinos) or zero partons (three charged leptons and one neutrino) at NLO, and up to three partons at LO. In the cases where one of the bosons decay hadronically and the other leptonically, matrix elements are calculated with up to one ( Z Z ) or zero ( W W, W Z ) additional partons at NLO and up to three additional partons at LO. The CT10 PDF set is used in conjunction with parton shower tuning developed by the Sherpa authors.
In all MC simulation samples, the effect of multiple pp interactions per bunch crossing (pileup) is modelled by adding multiple minimum-bias events simulated with Pythia 8.186 [25], the A2 set of tuned parameters [56] and the MSTW2008LO set of PDFs [57]. The distribution of the number of interactions per bunch crossing is then weighted to reflect the pileup conditions observed in the data.
4 Object reconstruction and identification
4.1 Detector-level object reconstruction
A description of the main reconstruction and identification criteria applied for electrons, muons, jets and b -jets is given below.
Electrons are reconstructed by matching ID tracks to clusters in the electromagnetic calorimeter. Electrons
must satisfy the tight identification criterion, based on a likelihood discriminant combining observables
related to the shower shape in the calorimeter and to the track matching the electromagnetic cluster, and are
required to be isolated in both the ID and EM calorimeter using the gradient isolation working point [58].
Electrons are required to have p
T> 25 GeV and |η
cluster| < 2 . 47. Electrons that fall in the transition region between the barrel and end-cap calorimeters (1 . 37 < |η
cluster| < 1 . 52) are poorly measured and are therefore not considered in this analysis.
Muon candidates are reconstructed by matching ID tracks with tracks in the muon spectrometer. Track reconstruction is performed independently in the ID and MS before a combined track is formed with a global refit to hits in the ID and MS. Muon candidates are required to have p
T> 25 GeV and |η | < 2 . 5, must satisfy the medium identification criteria and are required to be isolated using the gradient isolation working point [59].
Electron and muon tracks are required to be associated to the primary vertex. The association is performed by requiring the electron (muon) track to have |d
0|/σ
d0< 5 ( 3 ) and |∆z
0sin θ | < 0 . 5 mm, where d
0and z
0are the transverse and longitudinal impact parameters of the electron (muon) track with respect to the beamline, respectively, σ
d0is the uncertainty in the measurement of d
0, and θ is the angle of track with respect to the axis parallel to the beamline.
Reconstruction, identification and isolation efficiencies of electrons (muons) are corrected in simulation to match those observed in data using Z → e
+e
−( µ
+µ
−) events and the position and width of the observed Z boson peak is used to calibrate the electron (muon) energy (momentum) scale and resolution.
The anti- k
talgorithm [60] with a radius parameter of R = 0 . 4 is used to reconstruct jets with a four- momentum recombination scheme, using energy deposits in topological clusters in the calorimeter as inputs [61]. Jets are calibrated using a series of simulation-based corrections and in situ techniques [62].
Calibrated jets are required to have p
T> 25 GeV and |η| < 2 . 5 so that the ID can be used to determine whether they contain b -hadrons. Jets with p
T< 60 GeV and |η | < 2 . 4 are required to be identified as originating from the primary vertex using a jet-vertex tagger (JVT) algorithm [63].
Jets containing b -hadrons are identified based on the characteristics, such as long lifetime of b -hadrons and expected secondary vertices. A multivariate algorithm, MV2c10, is used that combines track and secondary-vertex information to distinguish b -jets from other jets. The algorithm is trained on simulated t¯ t events, defining b -jets as signal and a mixture of light-flavour and c -jets as background [64]. Four working points are defined by different b -tagging discriminant output thresholds corresponding to efficiencies of 85%, 77%, 70% and 60% in simulated t¯ t events for b -jets with p
T> 20 GeV and rejection factors ranging from 3–35 for c -jets and 30–1500 for light jets [64, 65].
After selecting electrons, muons and jets as defined above, several criteria are applied to ensure that objects do not overlap. If a selected electron and muon share a track then the electron is rejected. If an electron is within ∆R < 0 . 2 of one or more jets then the closest jet to the electron is removed. If there are remaining jets within ∆R < 0 . 4 of an electron then the electron is removed. When a jet is within ∆R < 0 . 4 of muon, it is removed if it has fewer than three tracks, otherwise the muon is removed.
4.2 Particle-level object definitions
Particle-level objects are selected in simulated events using definitions that closely match the detector-level objects defined in Section 4.1. Particle-level objects are defined using stable particles having a proper lifetime greater than 30 ps.
2Electrons and muons fromτdecays are thus included.
This analysis considers electrons and muons that do not come from hadron decays for the fiducial definition2. To take into account final-state photon radiation, the four-momentum of each lepton is modified by adding four-momenta of all photons not originating from a hadron within ∆R < 0 . 1 around the lepton to its original four-momentum. Electrons and muons are required to have p
T> 25 GeV and
|η | < 2 . 5.
Jets are clustered using all stable particles except those used in the definition of electrons and muons above and neutrinos not from hadron decays, using the anti- k
talgorithm with a radius parameter of 0.4. These jets do not include particles from pileup events but do include those from the underlying event. The decay products of hadronically decaying τ leptons are therefore included. Jets are required to have p
T> 25 GeV and |η | < 2 . 5.
Jets are identified as b -jets by requiring that at least one b -hadron with p
T> 5 GeV is ghost-associated to the jet [66]. The ghost association is performed by including b -hadrons in the jet clustering after scaling their p
Tto a negligible value. A similar procedure is followed to define c -jets, with the b -jet definition taking precedence i.e. a jet containing one b -hadron and one c -hadron is defined as a b -jet. Jets that do not contain either a b - or c -hadron are considered as light-flavour jets.
Electrons and muons that pass the selection criteria defined above are required to be separated from selected jets with ∆R( lepton , jet ) > 0 . 4. This ensures consistency with the detector-level selection defined in Section 4.1.
5 Event selection and definition of the fiducial phase space
5.1 Data event selection
The data analysed were collected by the ATLAS detector in 2015 and 2016 during stable pp collisions at
√ s = 13 TeV when all components of the ATLAS detector were fully operational. The total integrated luminosity recorded in this period was 36 . 1 fb
−1.
To ensure events originate from proton-proton collisions, events are required to have at least one primary vertex with at least two tracks. The primary vertex is defined as the vertex with the highest P
p
2T
of tracks associated to it.
Events are selected by requiring that a single-electron or single-muon trigger has fired. The triggers are designed to select well-identified charged leptons with high p
T. They require a p
Tof at least 20 (26) GeV for muons and 24 (26) GeV for electrons for the 2015 (2016) data set and also include requirements on the lepton quality and isolation. These triggers are complemented by others with higher p
Trequirements but loosened isolation requirements to ensure maximum efficiencies at higher lepton p
T.
In the eµ channel, events are required to have exactly one electron and one muon, with opposite electric charge. At least one of the two leptons must be matched in flavour and angle to a trigger object. In the lepton + jets channel, exactly one selected lepton is required which must be matched to the trigger object that triggered the event.
In the e µ channel, at least two jets are required with at least two of these required to be b -tagged at the 77%
efficiency b -tagging working point for the baseline selection. For the measurement of the fiducial cross-
section with one (two) additional b -jets, at least three (at least four) are b -tagged. For the measurement
of the b -jet multiplicity distribution, at least two jets are required, at least two of which must be b -tagged.
For all other differential cross-section measurements in the e µ channel, at least three jets are required, at least three of which must be b -tagged.
In the lepton + jets channel at least five jets are required with at least two of these required to be b -tagged for the baseline selection. For the measurement of the fiducial cross-section with one (two) additional b -jets, five (six) jets are required of which at least three (at least four) are b -tagged. For the measurement of the differential cross-sections, at least six jets, at least four of which are b -tagged, are required. In this channel, b -jets are identified using the tighter 60% efficiency b -tagging working point to better suppress c -jets from W
−→ cs ¯ or W
+→ c s ¯ decays.
5.2 Fiducial phase space definition
The fiducial cross-sections are defined using similar kinematic requirements on particle-level objects as for reconstructed objects in the event selection. The data are corrected to particle level using slightly different fiducial phase space definitions depending on the top-pair decay channel and on the observable.
In the e µ channel, fiducial cross-sections are measured requiring exactly one electron and one muon with opposite sign at particle-level and at least three (at least four) b -jet(s) for the fiducial cross-section with one (two) additional b -jets. The normalised differential cross-sections are measured in the fiducial volume containing the leptons and at least two b -jets for the distribution differential in number of b -jets and at least three b -jets for all other differential measurements.
In the lepton + jets channel, the fiducial phase space for the measurement of the fiducial cross-section with one (two) additional b -jet(s) is defined as containing exactly one particle-level electron or muon and five (six) jets, at least three (four) of which are b -jets. Differential cross-sections are measured in a fiducial volume containing at least six jets, at least four of which are required to be b -jets.
6 Background estimation
After the baseline selection with at least two b -tagged jets, only small backgrounds from processes other than t¯ t production remain in the sample. As mentioned before, events with additional b -jets produced in t tV ¯ or t¯ t H production are treated as signal. The estimation of t t ¯ production in association with additional light or c -jets is described in Section 7.1 and is done simultaneously with the extraction of fiducial cross-sections.
The remaining background events are classified into two types: those with real prompt leptons from single
top, W or Z decays (including those produced via leptonic tau decays), which are discussed in Sec. 6.1,
and those where at least one of the reconstructed lepton candidates is non-prompt or “fake” (NP & fake
lep.), i.e. a non-prompt lepton from the decay of a b - or c -hadron, an electron from a photon conversion,
hadronic jet activity misidentified as an electron, or a muon produced from an in-flight decay of a pion or
kaon. This is estimated using a combined data-driven and simulation-based approach in the e µ channel,
and a data-driven approach in the lepton + jets channel, both of which are described in Section 6.2.
6.1 Background from single top, Z /γ
∗+ jets and W + jets events
The background from single top-quark production is estimated from the MC simulation predictions in both channels. This background contributes 3% of the event yields in both channels with slightly smaller contributions in the four b -jets selections.
In the eµ channel, a very small number of events from Drell-Yan production, Z/γ
∗(→ ττ) +jets, fulfils the selection criteria. This background is estimated from MC simulation scaled to the data with separate scale factors for the two and three b -tagged jets bins. The scale factors are derived in events with a reconstructed mass of the dilepton system corresponding to the Z boson mass in data that fulfil the standard selection, except that the lepton flavour is ee or µµ . The fraction of background events from Z /γ
∗(→ ττ) +jets is below two per mill for all b -tagged jet multiplicities. The Z /γ
∗+jets background is negligible in the lepton + jets channel, and is fully taken from MC simulation.
In the lepton + jets channel, a small background from W + jets remains after the event selection, however, this contribution is below 2% in events with at least three b -tagged jets. This background is estimated directly from MC simulation.
6.2 Background from non-prompt and fake leptons
In the e µ channel, the normalisation of this background is estimated from data events in which the electron and muon have the same electric charge, using the method described in [67]. Known sources of same-sign prompt leptons are subtracted from the data and the non-prompt and fake background is extracted by scaling the remaining data events by a transfer factor determined from MC simulation. This transfer factor is defined as the ratio of predicted opposite-sign to predicted same-sign non-prompt and fake leptons.
In the lepton+ jets channel, the background from non-prompt and fake leptons is estimated using the matrix method [68]. A sample enriched in non-prompt and fake leptons is obtained by removing the isolation and impact parameter requirements on the lepton selections defined in Section 4. The efficiency of these leptons, hereafter referred to as loose leptons, to pass the standard criteria is then measured separately for prompt and fake leptons. For both electrons and muons the efficiency for a prompt loose lepton to pass the standard criteria is measured using a sample of Z boson decays, while the efficiency for fake loose leptons to pass the standard criteria is measured in events with low missing transverse momentum for electrons and high lepton impact parameter significance for muons. These efficiencies allow the number of fake leptons selected in the signal region to be estimated.
6.3 Data and MC simulation comparison of baseline selection
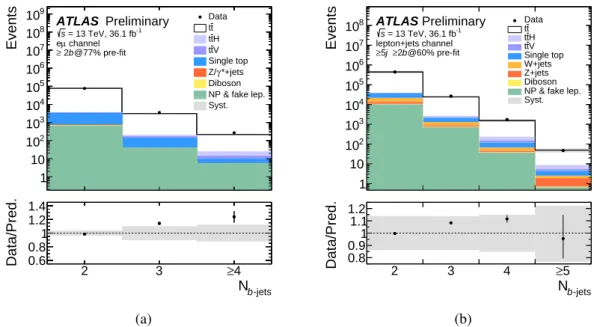
The overall number of events fulfilling the baseline selection are well described by the prediction in both
channels, as seen in Tables 2 and 3 and Figure 1. However, the number of events with more than two
b -tagged jets is slightly underestimated, as shown in Figures 1 and 2. Therefore, data-driven scale factors
are derived to correct the predictions of additional c -jets or light jets in the t¯ t MC simulation, as described
in the next section.
Events
1 10 102
103
104
105
106
107
108
109 Data
t t H t t V t t Single top
*+jets γ Z/
Diboson NP & fake lep.
Syst.
ATLAS Preliminary
= 13 TeV, 36.1 fb-1 s
channel µ e
@77% pre-fit b
≥ 2
-jets
Nb
2 3 ≥4
Data/Pred. 0.6
0.8 1 1.2 1.4
(a)
1 10 102
103
104
105
106
107
108
Events
2 3 4 ≥5
-jets
Nb
0.8 0.91.11 1.2
Data/Pred.
Data t t H t t V t t Single top W+jets Z+jets Diboson NP & fake lep.
Syst.
ATLAS Preliminary
= 13 TeV, 36.1 fb-1 s
lepton+jets channel
@60% pre-fit b
≥2 j
≥5
(b)
Figure 1: Comparison of the data distributions with predictions for the number ofb-tagged jets, in events with at least 2b-tagged jets, in the(a)eµand(b)lepton+jets channels. The systematics uncertainty band, shown in grey, includes all uncertainties from experimental sources.
Events / GeV
0 10 20 30 40
50 Data
t t H t t V t t Single top
*+jets γ Z/
Diboson NP & fake lep.
Syst.
ATLAS Preliminary
= 13 TeV, 36.1 fb-1 s
channel µ e
@77% pre-fit b
≥ 3
[GeV]
b1
pT
50 100 150 200 250 300
Data/Pred. 0.6
0.8 1 1.2 1.4
(a)
0 50 100 150 200 250 300 350 400
Events / GeV
50 100 150 200 250 300
[GeV]
b1
pT
0.6 0.81 1.2 1.4
Data/Pred.
Data t t H t t V t t Single top W+jets Z+jets Diboson NP & fake lep.
Syst.
ATLAS Preliminary
= 13 TeV, 36.1 fb-1 s
lepton+jets channel
@60% pre-fit b
≥3 j
≥5
(b)
Figure 2: Comparison of the data distributions with predictions for the leadingb-tagged jet pT, in events with at least 3b-tagged jets, in the(a)eµand(b)lepton+jets channels. The systematics uncertainty band, shown in grey, includes all uncertainties from experimental sources. Events that fall outside of the range of thex-axis are not included in the plot.
Table 2: Predicted and observedeµchannel event yields in 2b,≥3band≥4bselections. The quoted errors are symmetrized and indicate total statistical and systematic uncertainties in predictions due to experimental sources.
Process 2 b ≥ 3 b ≥ 4 b
t¯ t 74 200 ± 2900 3100 ± 310 190 ± 29
t¯ t H 45.3 ± 6.6 36.5 ± 7.0 9.4 ± 3.3
t¯ tV 190 ± 16 33.5 ± 6.7 4.4 ± 2.2
t¯ t + t¯ t H + t¯ tV 74 400 ± 2900 3200 ± 310 210 ± 29
Single top 2460 ± 540 96 ± 32 4.1 ± 2.5
NP and fake lep. 600 ± 600 43 ± 43 5.1 ± 5.1
Z/γ
∗+jets 53 ± 13 1.3 ± 0.3 0.07 ± 0.02
Diboson 38 ± 20 1.0 ± 1.1 0 ± 0
Total bkg. 3150 ± 810 140 ± 53 9.2 ± 5.6
Expected 77 600 ± 3000 3320 ± 320 216 ± 30
Observed 76 425 3809 267
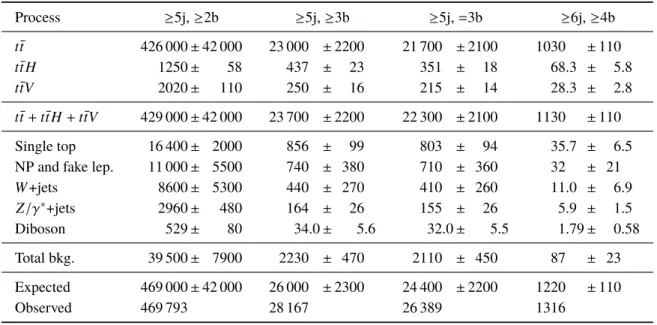
Table 3: Predicted and observed lepton+jets event yields in the≥5j ≥2b,≥5j ≥3b,≥5j =3b, and≥6j ≥4b selections. The quoted uncertainties are symmetrized and indicate total statistical and systematic uncertainties in predictions due to experimental sources.
Process ≥5j,≥2b ≥5j,≥3b ≥5j,=3b ≥6j,≥4b
tt¯ 426 000±42 000 23 000 ±2200 21 700 ±2100 1030 ±110
tt H¯ 1250± 58 437 ± 23 351 ± 18 68.3 ± 5.8
ttV¯ 2020± 110 250 ± 16 215 ± 14 28.3 ± 2.8
tt¯+tt H¯ +ttV¯ 429 000±42 000 23 700 ±2200 22 300 ±2100 1130 ±110
Single top 16 400± 2000 856 ± 99 803 ± 94 35.7 ± 6.5
NP and fake lep. 11 000± 5500 740 ± 380 710 ± 360 32 ± 21
W+jets 8600± 5300 440 ± 270 410 ± 260 11.0 ± 6.9
Z/γ∗+jets 2960± 480 164 ± 26 155 ± 26 5.9 ± 1.5
Diboson 529± 80 34.0± 5.6 32.0± 5.5 1.79± 0.58
Total bkg. 39 500± 7900 2230 ± 470 2110 ± 450 87 ± 23
Expected 469 000±42 000 26 000 ±2300 24 400 ±2200 1220 ±110
Observed 469 793 28 167 26 389 1316
7 Extraction of the fiducial cross-sections
Fiducial cross-sections defined in Sec. 5.2 for the different observables are extracted from detector-level distributions obtained after the event selections described in Sec. 5.1 and subtracting the number of background events, from the non- t¯ t processes described in Sec. 6. The non- t¯ t background-subtracted data suffer from backgrounds from t¯ t events with additional light ( t¯ tl ) or c -jets ( t¯ tc ) that are mis-identified as b -jets by the b -tagging algorithm. Comparisons of data to the MC simulated events with more than two b -tagged jets, as shown in Figures 1 and 2, indicate mis-modelling of the flavor composition of additional jets in t t ¯ events. Therefore, the correction factors for the signal and mis-tagged background events are evaluated from fits to data, as discussed in Sec. 7.1. The data are then unfolded using the corrected MC simulation as described in Sec. 7.2.
7.1 Data-driven correction factors for flavor composition of additional jets in t t ¯ events The measurement of t¯ t + b -jets production is tightly bound to the determination of the background from other t¯ t processes. For example, according to simulation studies, in the e µ channel only about 50% of the events selected at detector-level with at least three b -tagged jets at the 77% efficiency working point, and within the fiducial phase space of the analysis, also have at least three b -jets at particle level, while the other events contain at least one c -jet or light jet which is misidentified as a b -jet. While the c -jet mistag efficiency is known with a precision of 6 – 22% [69], depending on the jet p
Tand the b -tagging working point, the cross-section for the production of t¯ t in association with a charm-quark pair is poorly known.
The cross-section of t¯ t + light jets is better known as this process has been measured with 10 ( 16 ) % uncertainty on the production cross-section of two (three) additional jets [70]. However, the precision of light-jet mistag efficiency ranges from 15 – 75% [71], depending on the jet p
Tand the b -tagging working point. Due to these large uncertainties, template fits to data are performed to extract the t¯ tb signal yields and estimate the t¯ tc and t¯ tl backgrounds as described in the following.
The events are selected within the analysis region, consisting of at least three b -tagged jets at the 77%
b -tagging working point as specified in Section 5.1, in the e µ channel in order to avoid extrapolation of the background shapes determined outside the selected region into the analysis region. The fit in the lepton + jets channel is performed on a sample with at least five jets, at least two of which are b -tagged with a b -tagging efficiency of 60%. While this means that the MC simulation is required to extrapolate the results of the fit into the signal regions, it allows the t tl ¯ background to be extracted in what is effectively a control region. The lepton + jets channel suffers from an additional background due to W
+→ c s ¯ or corresponding W
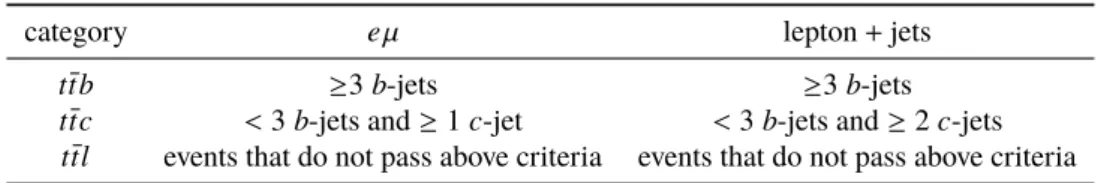
−decays in the inclusive t¯ t process, where the c -jet is mis-identified as a b -jet. To separate this background from t¯ t + c -jets events, events containing only one particle-level c -jet are attributed to this background and grouped to a t tl ¯ class, while those with two particle-level c -jets are placed into a t¯ tc class, as summarised in Table 4. In this sample, 85% of the events with exactly one particle-level c -jet are found to contain W → c s ¯ ( cs) ¯ decays, according to t¯ t MC simulation.
Templates are created for events in the different categories described in Table 4 using the b -tagging
discriminant value of the jet with the third highest b -tagging discriminant in the e µ channel, and the two jets
with the third and fourth highest b -tagging discriminant values in lepton + jets channel. The discriminant
values are divided into five b -tagging discriminant bins such that each bin corresponds to a certain range
of b -tagging efficiencies defined by the working points. The bins range from 1 to 5, corresponding to
efficiencies of [100% – 85%], [85% – 77%], [77% – 70%], [70% – 60%], and < 60% respectively.
Table 4: Event categorisation based on the particle-level selections ofb,cand light-flavour jets.
category eµ lepton+jets
ttb¯ ≥3b-jets ≥3b-jets
ttc¯ <3b-jets and≥1c-jet <3b-jets and≥2c-jets ttl¯ events that do not pass above criteria events that do not pass above criteria
One-dimensional templates with three bins are formed corresponding to b -tagging efficiencies between 77% and 0% of the jet with the third highest b -tagging discriminant value in the e µ channel, while in the lepton + jets channel two-dimensional templates are created using the b -tagging discriminant values of the two jets with the third and fourth highest b -tagging discriminant values corresponding to b -tagging efficiencies of the two jets between 100% and 0%.
In both channels, one template is created from the sum of all backgrounds described in Section 6 and three templates are created from t¯ t MC simulation, to account for t¯ tb , t tc ¯ and t¯ tl events, as detailed in Table 4.
These templates are then fitted to the template from data using a binned maximum likelihood fit, with a Poisson likelihood
L (~ α| x
1, . . . , x
n) =
n
Y
k
e
−νk(~α)ν
k(~ α)
xkx
k! , (1)
where x
kis the number of events in bin k of the data template and ν
k(~ α) is the number of expected events, and depends upon a number of free parameters, ~ α .
In the eµ channel, two free parameters are used, such that the expected number of events in bin k is ν
k(α
b, α
cl) = α
bN
tkt b¯
+ α
clN
tkt c¯
+ N
tktl¯
+ N
knon−tt¯
, (2)
where N
ktt b¯
, N
kt¯t c
, N
kt¯tl
and N
knon−t¯t
are the number of events in bin k of the t¯ tb , t¯ tc , t tl ¯ and non- t¯ t background templates, respectively. The scale factors obtained from the fit are α
b= 1 . 37 ± 0 . 06 and α
cl= 1 . 05 ± 0 . 04, where the quoted uncertainties are statistical only. Figure 3(a) shows the distributions of the templates before and after scaling the templates by these scale factors.
In the lepton + jets channel, three free parameters, α
b, α
cand α
l, are used in the maximum likelihood fit, such that the expected number of events in bin k is:
ν
k(α
b, α
c, α
l) = α
bN
tkt b¯
+ α
cN
tkt c¯
+ α
lN
tktl¯
+ N
knon−t¯t
. (3)
The best-fit values of the free parameters are α
b= 1 . 11 ± 0 . 02, α
c= 1 . 59 ± 0 . 06 and α
l= 0 . 962 ± 0 . 003 where the quoted uncertainties are statistical only. Including systematic uncertainties, the values of α
bextracted in the e µ and lepton + jets channels are found to be compatible at a level better than 1.5 σ . Some of the dominant common sources of systematics uncertainties have small correlations between two channels, while the uncertainty on α
bdue to the modelling of t¯ tc template in the e µ channel, as discussed in Section 8.3 is uncorrelated between two channels. Taking into account only this uncertainty as uncorrelated, the compatibility of the values of α
bextracted from two channels is found be at a level better than 1.7 σ . Figure 3(b) shows the distribution of b -tagging discriminant before and after the fit.
For clarity, the two-dimensional lepton + jets templates have been flattened into a single dimension.
Events
0 500 1000 1500 2000
2500 Data
l t c+t t
t αcl = 1.05 ± 0.04 b
t
t αb = 1.37 ± 0.06 t
Non-t Pre-fit
Preliminary channel
µ e
@77%
b
≥ 3
ATLAS
= 13 TeV, 36.1 fb-1
s
-tag discriminant bin b
3 4 5
Pred./Data 0.6 0.8 1 1.2
1.4 Pre-fit Post-fit
(a)
102
103
104
105
106
107
Events
-tag discriminant bin b
0.8 1 1.2
Pred./Data jetrd3 1 2 3 4 5 2 3 4 5 3 4 5 4 5 5
th jet
4 1 1 1 1 1 2 2 2 2 3 3 3 4 4 5
Data l t t c t t b t t
t Non-t Pre-fit
Pre-fit Post-fit
ATLAS Preliminary
= 13 TeV, 36.1 fb-1
s
lepton+jets channel
@60%
b
≥2 j
≥5 αl=0.962±0.003
±0.06 1.59
c=
α
±0.02 1.11
b=
α
(b)
Figure 3: Theb-tagging bin distribution of third highestb-tagging discriminant-ranked jet for the(a)eµchannel, and of third and fourthb-tagging discriminant-ranked jet for the(b)lepton+jets channel. For clarity, the two-dimensional lepton+jets templates have been flattened into one dimension. The ratio of total predictions before and after fit to the data are shown in lower panel. The vertical bars in the ratio represents only the statistical uncertainty, and the grey bands represent the total error including systematic uncertainties from experimental sources. The extracted scale factorsαb, αc, αl, αcl and theχ2are given considering only statistical uncertainties.
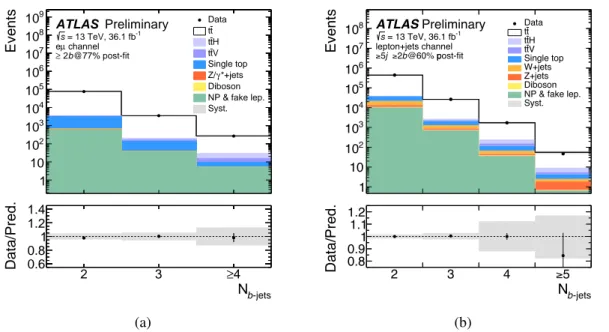
Figures 4 and 5 show the comparison of data and predictions for the b -tagged jet multiplicity and the leading b -tagged jet p
Tin the e µ and lepton + jets channels after the t¯ tb signal, and the t¯ tc and t¯ tl backgrounds, have been scaled by the extracted scale factors. The data are described much better by the prediction after the scaling is applied.
7.2 Unfolding
The measured distributions at detector level are unfolded to the particle level. The unfolding procedure corrects for resolution effects and for detector efficiencies and acceptances.
First, the number of non- t¯ t background events in bin j ( N
jnon-tt¯-bkg
), described in Section 6, is subtracted from the data distribution at the detector level in bin j ( N
jdata
). This retains a mixture of signal and t t ¯ -related backgrounds, the latter coming from mis-tagged events as described in Section 7.1. A series of corrections are then applied, with all corrections derived from simulated t¯ t , t¯ t H and t¯ tV events. The non- t t ¯ background subtracted data are first corrected for mis-tagged events by applying a correction,
f
tjt b¯
= α
bN
t¯jt b,reco
α
bN
tjt b,¯ reco
+ B
j, (4)
where α
bis defined in the previous section, N
tjt b,is the number of detector-level t¯ tb events predicted
Events
1 10 102
103
104
105
106
107
108
109 Data
t t H t t V t t Single top
*+jets γ Z/
Diboson NP & fake lep.
Syst.
ATLAS Preliminary
= 13 TeV, 36.1 fb-1 s
channel µ e
@77% post-fit b
≥ 2
-jets
Nb
2 3 ≥4
Data/Pred. 0.6
0.8 1 1.2 1.4
(a)
1 10 102
103
104
105
106
107
108
Events
2 3 4 ≥5
-jets
Nb
0.8 0.91.11 1.2
Data/Pred.
Data t t H t t V t t Single top W+jets Z+jets Diboson NP & fake lep.
Syst.
ATLASPreliminary
= 13 TeV, 36.1 fb-1 s
lepton+jets channel b 2
≥ j 5
≥
(b)
Figure 4: Comparison of the data distributions with predictions, after applying scale factors, for the number of b-tagged jets, in events with at least 2b-tagged jets, in the(a)eµand(b)lepton+jets channels. The systematics uncertainty band, shown in grey, includes all uncertainties from experimental sources.
Events / GeV
0 10 20 30 40
50 Data
t t H t t V t t Single top
*+jets γ Z/
Diboson NP & fake lep.
Syst.
ATLAS Preliminary
= 13 TeV, 36.1 fb-1 s
channel µ e
@77% post-fit b
≥ 3
[GeV]
b1
pT
50 100 150 200 250 300
Data/Pred. 0.6
0.8 1 1.2 1.4
(a)
0 50 100 150 200 250 300 350 400
Events / GeV
50 100 150 200 250 300 [GeV]
b1
pT
0.6 0.81 1.21.4
Data/Pred.
Data t t H t t V t t Single top W+jets Z+jets Diboson NP & fake lep.
Syst.
ATLASPreliminary
= 13 TeV, 36.1 fb-1 s
lepton+jets channel b 3
≥ j 5
≥
(b)
Figure 5: Comparison of the data distributions with predictions for the leadingb-tagged jetpT, after applying scale factors, in events with at least 3b-tagged jets, in the(a)eµand(b)lepton+jets channels. The systematics uncertainty band, shown in grey, includes all uncertainties from experimental sources. Events that fall outside of the range of thex-axis are not included in the plot.