CERN-PH-EP–2010-037 7 Oct. 2010
Measurement of the W → ` ν and Z/ γ ∗ → `` production cross sections in proton-proton collisions at √
s = 7 TeV with the ATLAS detector
The ATLAS Collaboration ∗
Abstract
First measurements of the W → `ν and Z/γ ∗ → `` (` = e, µ) production cross sections in proton- proton collisions at √
s = 7 TeV are presented using data recorded by the ATLAS experiment at the LHC. The results are based on 2250 W → `ν and 179 Z/γ ∗ → `` candidate events selected from a data set corresponding to an integrated luminosity of approximately 320 nb −1 . The measured total W and Z/γ ∗ -boson production cross sections times the respective leptonic branching ratios for the combined electron and muon channels are σ W tot · BR(W → `ν) = 9.96 ± 0.23(stat) ± 0.50(syst)
± 1.10(lumi) nb and σ Z/γ tot
∗· BR(Z/γ ∗ → ``) = 0.82 ±0.06(stat)± 0.05(syst) ±0.09(lumi) nb (within the invariant mass window 66 < m `` < 116 GeV). The W /Z cross-section ratio is measured to be 11.7 ± 0.9(stat) ± 0.4(syst). In addition, measurements of the W + and W − production cross sections and of the lepton charge asymmetry are reported. Theoretical predictions based on NNLO QCD calculations are found to agree with the measurements.
∗ See Appendix for the list of collaboration members
arXiv:1010.2130v1 [hep-ex] 11 Oct 2010
1 Introduction
Measurements of the inclusive production cross sections of the W and Z bosons at hadron colliders con- stitute an important test of the Standard Model. The theoretical calculations involve parton distribution functions (PDF) and different couplings of the partons to the weak bosons. They are affected by sig- nificant higher-order QCD corrections. Calculations of the inclusive W and Z production cross sections have been carried out at next-to-leading order (NLO) [1–3] and next-to-next-to leading order (NNLO) in perturbation theory [4–8].
The production of W and Z bosons at hadron colliders was measured previously by the UA1 [9] and UA2 [10] experiments at √
s = 0.63 TeV at the CERN Sp¯pS and by the CDF [11–13] and D0 [14, 15]
experiments at √
s = 1.8 TeV and √
s = 1.96 TeV at the Fermilab Tevatron proton-antiproton colliders.
In contrast to proton-antiproton collisions, the cross sections for W + and W − production are expected to be different in proton-proton collisions due to different valence quark distributions of the u and d quarks.
Most recently, the RHIC collider experiments [16,17] have reported the first observation of W production in proton-proton collisions at √
s = 0.5 TeV.
W and Z bosons are expected to be produced abundantly at the Large Hadron Collider (LHC) [18].
The projected large dataset and the high LHC energy will allow for detailed measurements of their production properties in a previously unexplored kinematic domain. These conditions, together with the proton-proton nature of the collisions, will provide new constraints on the parton distribution functions and will allow for precise tests of perturbative QCD. Besides the measurements of the W and Z boson production cross sections, the measurement of their ratio R and of the asymmetry between the W + and W − cross sections constitute important tests of the Standard Model. The ratio R can be measured with a higher relative precision because both experimental and theoretical uncertainties partially cancel. With larger data sets this ratio can be used to provide constraints on the W -boson width Γ W [13].
This paper describes the first measurement of the W + ,W − and Z/γ ∗ boson production cross sections in proton-proton collisions at √
s = 7 TeV by the ATLAS [19] experiment at the LHC. The measurements are based on data corresponding to an integrated luminosity of approximately 320 nb −1 . The inclusive Z/γ ∗ -production-cross section is measured within the mass range 66 < m `` < 116 GeV. In addition to the individual cross-section measurements, first measurements of the ratio R of the W to Z cross sections and of the W → `ν charge asymmetry are presented. Throughout this paper the label “Z” refers to Z/γ ∗ . The paper is organized as follows: after a short description of the ATLAS detector, the data set and the Monte-Carlo samples in Sections 2 and 3, the identification of electrons, muons and the measurement of the transverse missing energy are discussed in Section 4. In Section 5, the selection of W → `ν and Z → `` candidates is presented. Section 6 is devoted to a detailed discussion of backgrounds in these samples. The measurement of the W → `ν and Z → `` cross sections and of their ratio is presented in Section 7 together with a comparison to theoretical predictions. The measurement of the W → `ν charge asymmetry is discussed in Section 8.
2 The ATLAS detector
The ATLAS detector [19] at the LHC comprises a thin superconducting solenoid surrounding the inner- detector and three large superconducting toroids arranged with an eight-fold azimuthal coil symmetry placed around the calorimeters, forming the basis of the muon spectrometer.
The Inner-Detector (ID) system is immersed in a 2 T axial magnetic field and provides tracking infor-
mation for charged particles in a pseudorapidity range matched by the precision measurements of the
electromagnetic calorimeter; the silicon tracking detectors, pixel and silicon microstrip (SCT), cover the
pseudorapidity range |η| < 2.5. 1 The highest granularity is achieved around the vertex region using the pixel detectors. The Transition Radiation Tracker (TRT), which surrounds the silicon detectors, en- ables track-following up to |η| = 2.0. Electron identification information is provided by the detection of transition radiation in the TRT straw tubes.
The calorimeter system covers the pseudorapidity range |η| < 4.9. It is based on two different detector technologies, with liquid argon (LAr) and scintillator-tiles as active media. The electromagnetic (EM) calorimeter, consisting of lead absorbers and liquid argon as the active material, is divided into one barrel ( |η| < 1.475) and two end-cap components (1.375 < |η| < 3.2). It uses an accordion geometry to ensure fast and uniform response. It has a fine segmentation in both the lateral and longitudinal directions of the particle showers. At high energy, most of the EM shower energy is collected in the second layer which has a lateral cell granularity of ∆η × ∆φ = 0.025 × 0.025. The first layer is segmented into eight strips per cell in the η direction which extend over four cells in φ. A third layer measures the tails of very high energy EM showers and helps in rejecting hadron showers. In the region |η| < 1.8, a presampler detector consisting of a thin layer of LAr is used to correct for the energy lost by electrons, positrons, and photons upstream of the calorimeter. The hadronic tile calorimeter is placed directly outside the EM calorimeter envelope. This steel/scintillating-tile detector consists of a barrel covering the region |η| < 1.0, and two extended barrels in the range 0.8 < |η| < 1.7. The copper Hadronic End-cap Calorimeter (HEC), which uses LAr as active material, consists of two independent wheels per end-cap (1.5 < |η | < 3.2), located directly behind the end-cap electromagnetic calorimeter. The Forward Calorimeter (FCal), which also uses LAr as the active material, consists of three modules in each end-cap: the first, made of copper, is optimised for electromagnetic measurements, while the other two, made of tungsten, measure primarily the energy of hadronic interactions [20].
Muon detection is based on the magnetic deflection of muon tracks in the large superconducting air- core toroid magnets, instrumented with separate trigger and high-precision tracking chambers. A system of three toroids, a barrel and two end-caps, generates the magnetic field for the muon spectrometer in the pseudorapidity range |η| < 2.7. Over most of the η-range, a precision measurement of the track coordinates in the principal bending direction of the magnetic field is provided by Monitored Drift Tubes (MDTs). At large pseudorapidities, Cathode Strip Chambers (CSCs) with higher granularity are used in the innermost plane (station) over 2.0 < |η | < 2.7, to withstand the demanding rate and background conditions expected with the LHC operation at the nominal luminosity. The muon trigger system, which covers the pseudorapidity range |η| < 2.4, consists of Resistive Plate Chambers (RPCs) in the barrel ( |η| < 1.05) and Thin Gap Chambers (TGCs) in the end-cap regions (1.05 < |η| < 2.4), with a small overlap in the |η| =1.05 region.
The first-level (L1) trigger system uses a subset of the total detector information to make a decision on whether or not to record each event, reducing the data rate to a design value of approximately 75 kHz.
Details about the L1 calorimeter and muon trigger systems used in the W and Z analyses are provided in Section 3. The subsequent two levels, collectively known as the high-level trigger, are the Level-2 (L2) trigger and the event filter. They provide the reduction to a final data-taking rate designed to be approximately 200 Hz.
3 Data and Monte-Carlo samples
The data were collected over a four-month period, from March to July 2010. Application of basic beam, detector, and data-quality requirements resulted in total integrated luminosities of 315 nb −1 for
1 The nominal interaction point is defined as the origin of the coordinate system, while the anti-clockwise beam direction defines the z-axis and the x − y plane is transverse to the beam direction. The positive x-axis is defined as pointing from the interaction point to the centre of the LHC ring and the positive y-axis is defined as pointing upwards. The azimuthal angle φ is measured around the beam axis and the polar angle θ is the angle from the beam axis. The pseudorapidity is defined as η = − ln tan(θ /2). The distance ∆R in the η − φ space is defined as ∆R = p
(∆η ) 2 + (∆φ ) 2 .
the W → eν, 310 nb −1 for the W → µ ν, 316 nb −1 for the Z → ee, and 331 nb −1 for the Z → µ µ channels. The uncertainty on the absolute luminosity determination is ± 11% [21].
Events in this analysis are selected using only the hardware-based L1 trigger, i.e. without use of the high- level trigger. The L1 calorimeter trigger selects photon and electron candidates within |η | < 2.5 using calorimeter information in trigger towers of dimension ∆η × ∆φ = 0.1 × 0.1. The calorimeter trigger used in this analysis accepts electron and photon candidates if the transverse energy from a cluster of trigger towers is above approximately 10 GeV. The L1 muon trigger searches for patterns of hits within
|η | < 2.4 consistent with high-p T muons originating from the interaction region. The algorithm requires a coincidence of hits in the different trigger stations along a road which follows the path of a muon from the interaction point through the detector. The width of the road is related to the p T threshold to be applied. The muon trigger used in this analysis corresponds to a threshold of approximately 6 GeV. As a result of these trigger decisions, a total of 6.5 × 10 6 and 5.1 × 10 6 events are triggered in the electron and muon channels, respectively.
In order to compare the data with theoretical expectations and to estimate the backgrounds from various physics processes, Monte-Carlo simulations were performed. For the W and Z signal processes, dedi- cated W → `ν and Z → `` signal samples were generated. For the backgrounds the following processes were considered:
– W → τ ν : this process is expected to contribute, in particular via leptonic tau decays, τ → `ν ν , to both electron and muon final states in the W analysis.
– Z → ``: Z → µ µ decays with one muon outside of the muon-spectrometer acceptance generate apparent missing transverse energy and constitute an important background in the W → µ ν anal- ysis. Due to the larger η coverage of the calorimeter system, this effect is less severe for the corresponding Z → ee decays in the W → eν analysis.
– Z → τ τ: these decays contribute a smaller background to both the W and Z analyses via single or double leptonic tau decays.
– t t ¯ production: the production of top pairs constitutes an additional background to both the W and Z analyses. The relative size, compared to the backgrounds from W and Z decays, depends on the channel considered.
– Jet production via QCD processes: the production of jets via QCD processes (referred to as “QCD background” in the following) is another important background contribution. It has significant components from semi-leptonic decays of heavy quarks, hadrons misidentified as leptons and, in the case of the electron channel, electrons from conversions. For the Z → µ µ analysis, dedi- cated b b ¯ and c c ¯ samples were generated in addition, to increase the statistics for these background components.
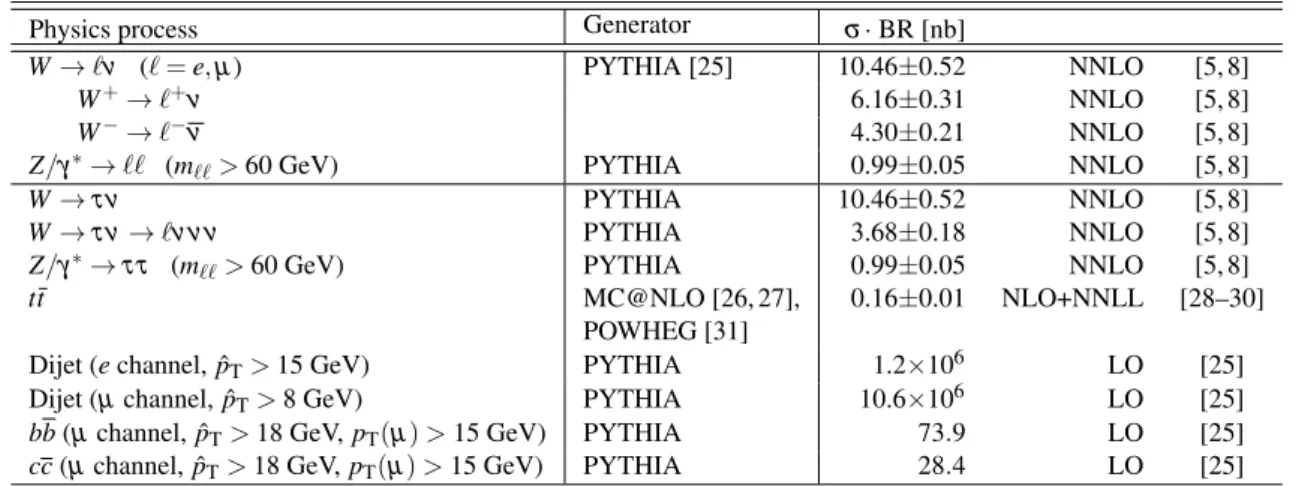
An overview of all signal and background processes considered and of the generators used for the sim- ulation is given in Table 1. All signal and background samples were generated at √
s = 7 TeV, then processed with the GEANT4 [22] simulation of the ATLAS detector [23], reconstructed and passed through the same analysis chain as the data. For the comparison to data, all cross sections, except the dijet cross section, are normalised to the results of higher order QCD calculations (see Table 1). More details on the calculations for the W and Z processes and on the assigned uncertainties are presented in Section 7.6. For the t¯ t production cross section, an uncertainty of ±6% is assumed.
For the QCD background, no reliable prediction can be obtained from a leading order Monte-Carlo
simulation. For the comparisons of differential distributions to data, as presented in Section 5, this
Physics process Generator σ· BR [nb]
W → `ν (` = e,µ) PYTHIA [25] 10.46±0.52 NNLO [5, 8]
W + → ` + ν 6.16±0.31 NNLO [5, 8]
W − → ` − ν 4.30±0.21 NNLO [5, 8]
Z/γ ∗ → `` (m `` > 60 GeV) PYTHIA 0.99±0.05 NNLO [5, 8]
W → τ ν PYTHIA 10.46±0.52 NNLO [5, 8]
W → τ ν → `ν ν ν PYTHIA 3.68±0.18 NNLO [5, 8]
Z/γ ∗ → τ τ (m `` > 60 GeV) PYTHIA 0.99±0.05 NNLO [5, 8]
t¯ t MC@NLO [26, 27], 0.16±0.01 NLO+NNLL [28–30]
POWHEG [31]
Dijet (e channel, ˆ p T > 15 GeV) PYTHIA 1.2×10 6 LO [25]
Dijet (µ channel, ˆ p T > 8 GeV) PYTHIA 10.6×10 6 LO [25]
bb (µ channel, ˆ p T > 18 GeV, p T (µ) > 15 GeV) PYTHIA 73.9 LO [25]
cc (µ channel, ˆ p T > 18 GeV, p T (µ) > 15 GeV) PYTHIA 28.4 LO [25]
Table 1: Signal and background Monte-Carlo samples as well as the generators used in the simulation. For each sample the production cross section, multiplied by the relevant branching ratios (BR), to which the samples were normalised is given. For the electroweak (W and Z boson production) and for the t t ¯ production, contributions from higher order QCD corrections are included. The inclusive QCD jet and heavy quark cross sections are given at leading order (LO). These samples were generated with requirements on the transverse momentum of the partons involved in the hard-scattering process, ˆ p T . All Monte-Carlo samples result in negligible statistical uncertainties, unless otherwise stated.
background is normalised to data. However, for the final cross-section measurement, except for the Z → µ µ analysis, data-driven methods are used to determine the residual contributions of the QCD background to the final W and Z samples, as discussed in Section 6.
During the period these data were recorded, the average pile-up varied from zero to about two extra interactions per event, with most of the data being recorded with roughly one extra interaction per event.
To account for this, the W → `ν, Z → ``, and QCD-dijet Monte-Carlo samples were generated with on average two extra primary interactions and then weighted to the primary vertex multiplicity distribution observed in the data.
All data distributions in this paper are shown with statistical uncertainties only, based on Poisson statis- tics [24], unless otherwise stated.
4 Reconstruction of electrons, muons and missing transverse energy 4.1 Track reconstruction in the inner detector
The reconstruction of both electrons and muons uses reconstructed charged tracks in the inner detector.
A detailed description of the track reconstruction has already been presented in Ref. [32]. The inner tracking system measures charged particle tracks at all φ over the pseudorapidity region |η| < 2.5 using the pixel, SCT and TRT detectors. Tracks are reconstructed using a pattern recognition algorithm that starts with the silicon information and adds hits in the TRT. This “inside-out” tracking procedure selects track candidates with transverse momenta above 100 MeV [33]. One further pattern recognition step is then run, which only looks at hits not previously used. It starts from the TRT and works inwards adding silicon hits as it progresses. In this second step, tracks from secondary interactions, such as photon conversions and long-lived hadron decays, with transverse momenta above 300 MeV are recovered.
4.2 Electrons
The ATLAS standard electron reconstruction and identification algorithm [34] is designed to provide
various levels of background rejection for high identification efficiencies for calorimeter transverse en-
ergy E T > 20 GeV, over the full acceptance of the inner-detector system. Electron reconstruction be- gins with a seed cluster of E T > 2.5 GeV in the second layer of the electromagnetic calorimeter. A matching track, extrapolated to the second EM calorimeter layer, is searched for in a broad window of
∆η × ∆φ = 0.05 × 0.1 amongst all reconstructed tracks with p T > 0.5 GeV. The closest-matched track to the cluster barycentre is kept as that belonging to the electron candidate. The final electron candidates have cluster sizes of ∆η × ∆φ = 0.075 × 0.175 in the barrel calorimeter and 0.125 × 0.125 in the end- cap. The transverse energy of these electron candidates is obtained from the corresponding calorimeter clusters.
The electron identification selections are based on criteria using calorimeter and tracker information and have been optimised in 10 bins in η and 11 bins in E T . Three reference sets of requirements (“loose”,
”medium”, and “tight”) have been chosen, providing progressively stronger jet rejection at the expense of some identification efficiency loss. Each set adds additional constraints to the previous requirements:
– “Loose”: this basic selection uses EM shower shape information from the second layer of the EM calorimeter (lateral shower containment and shower width) and energy leakage into the hadronic calorimeters as discriminant variables. This set of requirements provides high and uniform identi- fication efficiency but a low background rejection.
– “Medium”: this selection provides additional rejection against hadrons by evaluating the energy deposit patterns in the first layer of the EM calorimeter (the shower width and the ratio of the energy difference associated with the largest and second largest energy deposit over the sum of these energies), track quality variables (number of hits in the pixel and silicon trackers, transverse distance of closest approach to the primary vertex (transverse impact parameter)) and a cluster- track matching variable (∆η between the cluster and the track extrapolated to the first layer of the EM calorimeter).
– “Tight”: this selection further rejects charged hadrons and secondary electrons from conversions by fully exploiting the electron identification potential of the ATLAS detector. It makes require- ments on the ratio of cluster energy to track momentum, on the number of hits in the TRT, and on the ratio of high-threshold hits 2 to the total number of hits in the TRT. Electrons from conversions are rejected by requiring at least one hit in the first layer of the pixel detector. A conversion- flagging algorithm is also used to further reduce this contribution. The impact-parameter require- ment applied in the medium selection is further tightened at this level.
Z → ee and W → eν signal Monte-Carlo samples were used to estimate the medium and tight elec- tron identification efficiencies within the relevant kinematic and geometrical acceptance (E T > 20 GeV within the range |η| < 2.47 and excluding the transition region between the barrel and end-cap calorime- ters, 1.37 < |η| < 1.52). The efficiencies are estimated to be 94.3% and 74.9% respectively, relative to the basic reconstruction efficiency of 97% which requires a very loose matching between the candidate electron track and the electromagnetic cluster. Using QCD dijet background Monte-Carlo samples, the corresponding rejections against background from hadrons or conversion electrons in generated jets with E T > 20 GeV within the relevant kinematic and geometrical acceptance are found to be 5700 and 77000, respectively.
Given the limited available statistics of Z → ee decays, the electron performance cannot yet be evalu- ated in detail with collision data. The overall uncertainty on the electron energy scale is estimated to be ±3%, based on extrapolations from test-beam measurements. The uncertainty on the electron energy resolution is also based on extrapolations from test-beam measurements and has a negligible impact on the measurements reported here.
2 The TRT readout discriminates at two thresholds. The lower one is set to register minimum-ionizing particles and the
higher one is intended for the detection of transition radiation.
The material in front of the electromagnetic calorimeter affects the reconstruction and identification efficiencies as well as the correct identification of the charge of the reconstructed electron. This has been studied in detail with dedicated simulations including additional material in the inner detector and in front of the electromagnetic calorimeter. The amount of additional material which might be present is currently best constrained by track efficiency measurements in minimum bias data [32] and studies of photon conversions. The probability for wrongly identifying the charge of the electron depends strongly on the amount of material it traverses in the inner detector and therefore on η . It is expected to be (1.9 ± 0.3)%
for the medium electron identification cuts (this affects the selection of Z-boson candidates as discussed in Section 6.3) and (0.6 ± 0.3)% for the tight identification cuts (this affects the measurement of the W -boson asymmetry as discussed in Section 8).
The most precise current estimate of the electron identification efficiencies is obtained from a sample of W → eν candidates which were selected using tight cuts on the missing transverse energy and the topol- ogy of the event and requiring only that an electron candidate be reconstructed through the very loose match between a track and an electromagnetic cluster mentioned above. The residual background from QCD dijets was estimated using a calorimeter isolation technique similar to that described in Section 6.1.
The results obtained for the medium efficiency were 0.900±0.014(stat) ±0.040(syst) compared to 0.943 from the Monte Carlo. For the tight efficiency, the corresponding results were 0.742 ± 0.013(stat) ± 0.030(syst) compared to 0.749 from the Monte Carlo. These measurements confirm that, within the current uncertainties, the electron identification efficiencies are well modelled by the simulation and are used to evaluate the systematic uncertainties discussed in Section 7.2.
4.3 Muons
The ATLAS muon identification and reconstruction algorithms take advantage of multiple sub-detector technologies which provide complementary approaches and cover pseudorapidities up to 2.7 [35].
The stand-alone muon reconstruction is based entirely on muon-spectrometer information, independently of whether or not the muon-spectrometer track is also reconstructed in the inner detector. The muon reconstruction is initiated locally in a muon chamber by a search for straight line track segments in the bending plane. Hits in the precision chambers are used and the segment candidates are required to point to the centre of ATLAS. When available, the hit coordinate φ in the non-bending plane measured by the trigger detectors is associated to the segment. Two or more track segments in different muon stations are combined to form a muon track candidate using three-dimensional tracking in the magnetic field.
The track parameters (p T , η, φ, transverse and longitudinal distances of closest approach to the primary vertex) obtained from the muon spectrometer track fit are extrapolated to the interaction point taking into account both multiple scattering and energy loss in the calorimeters. For the latter, the reconstruction utilises either a parameterisation or actual measurements of calorimeter energy losses, together with a parameterisation of energy loss in the inert material. The average muon energy loss in the calorimeters is 3 GeV. The stand-alone muon reconstruction algorithms use the least-squares formalism to fit tracks in the muon spectrometer, with most material effects directly integrated into the χ 2 function.
The combined muon reconstruction associates a stand-alone muon-spectrometer track to an inner-detector track. The association is performed using a χ 2 -test, defined from the difference between the respective track parameters weighted by their combined covariance matrices. The parameters are evaluated at the point of closest approach to the beam axis. The combined track parameters are derived either from a statistical combination of the two tracks or from a refit of the full track. To validate the results presented in this paper, these two independent reconstruction chains were exercised and good agreement was ob- served. The results presented here are based on the statistical combination of muon-spectrometer and inner-detector measurement.
Detailed studies of the muon performance in collision data were performed. The muon momentum scale
and resolution were extracted by fitting the invariant mass distribution of the Z candidates described
in Section 5.4 to a Breit-Wigner function convolved with a Gaussian function. The fitted mean value indicates that the muon-momentum scale is within ± 1% around the nominal value. From the fitted width the muon-momentum resolution, for muons from Z decays, is extracted to be (4 ± 2)% in the barrel and (7 ± 3)% in the end-cap regions. These results are consistent with those obtained from the single muon studies reported in Ref. [36].
Two complementary approaches were used to measure the muon reconstruction efficiency in data. The first technique determines the efficiency of isolated combined muons relative to inner-detector tracks matched to muon hits in the muon spectrometer, resulting in an efficiency measured in data of 0.994 ± 0.006(stat) ± 0.024(syst), compared to 0.986 from the Monte-Carlo simulation. In the second approach, events are selected requiring an isolated combined muon passing the same selection as for the Z analysis (see Section 5.4). The second muon of the Z candidate is then selected as an inner-detector track with opposite charge. The invariant mass of the muon-track pair is required to be within 10 GeV of the nominal Z mass. The combined muon efficiency, measured relative to this sample of tracks, is 0.933
± 0.022(stat) ± 0.013(syst), while the value from Monte-Carlo simulation is 0.924. The difference in the efficiency values obtained from the two methods is due to the different sensitivity to the geometrical acceptance of the muon spectrometer, as the first method explicitly requires muon hits. Both techniques confirm that the reconstruction efficiency is well modelled by the simulation and the latter is used to assign the systematic uncertainty on that value.
4.4 Missing transverse energy
The transverse missing energy (E T miss ) reconstruction used in the electron channel is based on calorimeter information. It relies on a cell-based algorithm which sums the electromagnetic-scale energy deposits of calorimeter cells inside three-dimensional topological clusters [37]. The EM scale corresponds to the energy deposited in the calorimeter calculated under the assumption that all processes are purely electromagnetic in nature. These clusters are then corrected to take into account the different response to hadrons than to electrons or photons, dead material losses and out of cluster energy losses [38]. These topological clusters are built around energy E > 4σ noise seeds, where σ noise is the Gaussian width of the cell energy distribution in randomly triggered events, by iteratively gathering neighbouring cells with E > 2σ noise and, in a final step, by adding all direct neighbours of these accumulated secondary cells.
For the electron channel, the components of the missing transverse energy are calculated by summing over all topological cluster cell energy components E x,y i :
E x,y miss | e = − ∑
i
E x,y i . (1)
The E T miss used in the muon channel is calculated by adding the reconstructed momenta of isolated and non-isolated muons measured in the pseudorapidity range |η| < 2.7:
E x,y miss | µ = − ∑
i
E x,y i −
isolated
∑
k
p k x,y −
non−isolated
∑
j
p x,y j , (2)
where non-isolated muons are those within a distance ∆R ≤ 0.3 of a jet in the event. The p T of an isolated
muon is determined from the combined measurement of the inner detector and muon spectrometer, as
explained in Section 4.3. The energy lost by an isolated muon in the calorimeters is removed from the
calorimeter term. For a non-isolated muon, the energy lost in the calorimeter cannot be separated from
the nearby jet energy. The muon-spectrometer measurement of the muon momentum after energy loss
in the calorimeter is therefore used, unless there is a significant mismatch between the spectrometer and
combined measurements. In this case the combined measurement minus the parameterised energy loss
in the calorimeter is used. For values of the pseudorapidity outside the fiducial volume of the inner
detector (2.5 < |η| < 2.7), there is no matched track requirement and the muon spectrometer stand-alone measurement is used instead.
Systematic uncertainties on the measurement of E T miss result mainly from uncertainties on the energy scale of topological clusters. From a comparison of the momentum and energy measurement of charged particles [39], the topological cluster energy scale is known to ± 20% for p T ∼ 500 MeV and ± 5% at high p T . Other contributions result from uncertainties due to the imperfect modelling of the overall E T miss response (low energy hadrons) and resolution, modelling of the underlying event and pile-up effects.
5 Selection of W → `ν and Z → `` candidates 5.1 Event selection
Collision candidates are selected by requiring a primary vertex with at least three tracks, consistent with the beam-spot position. To reduce contamination from cosmic-ray or beam-halo events, the muon analysis requires the primary vertex position along the beam axis to be within 15 cm of the nominal position (this primary vertex distribution has a measured longitudinal RMS of 6.2 cm).
An analysis of a high-statistics sample of minimum-bias events has shown that events can occasionally contain very localised high-energy calorimeter deposits not originating from the proton-proton collision, but e.g. from sporadic discharges in the hadronic end-cap calorimeter or, more rarely, coherent noise in the electromagnetic calorimeter. Cosmic-ray muons undergoing a hard bremsstrahlung are also a potential source of localised energy deposits uncorrelated with the primary proton-proton collisions. The occurrence of these events is very rare but can potentially impact significantly the E T miss measurement by creating high-energy tails [40]. To remove such events, dedicated cleaning requirements have been developed using a minimum-bias event sample. Using Monte-Carlo simulation, it was verified that these criteria remove less than 0.1% of minimum-bias events, 0.004% of W → `ν, and 0.01% of dijet events.
For the electron channel only, the event is rejected if the candidate electromagnetic cluster is located in any problematic region of the EM calorimeter. Due to hardware problems [20], the signal cannot be read out from ∼ 2% of the EM calorimeter cells.
5.2 Selection of high transverse-energy leptons
Electron candidates selected with the identification level “tight” for the W analysis and “medium” for the Z analysis (according to the algorithm described in Section 4.2) are required to have a cluster E T > 20 GeV within the range |η | < 2.47, excluding the transition region between the barrel and end- cap calorimeters (1.37 < |η| < 1.52). Muon candidates selected according to the algorithm described in Section 4.3 are required to have a combined muon with p T > 20 GeV and a muon-spectrometer track with p T > 10 GeV within the range |η| < 2.4. To increase the robustness against track reconstruction mismatches, the difference between the inner-detector and muon-spectrometer p T corrected for the mean energy loss in upstream material, is required to be less than 15 GeV. The difference between the z posi- tion of the muon track extrapolated to the beam line and the z coordinate of the primary vertex is required to be less than 1 cm.
Figure 1 shows the E T and p T spectra of these “tight” electron and combined muon candidates and com-
pares these to the signal and background Monte-Carlo samples described in Section 3. Comparisons of
the dijet Monte-Carlo distributions to equivalent data distributions have shown that the dijet Monte Carlo
for this high-p T lepton selection over-estimates the amount of background by a factor of approximately
2.4 for the electron channel and a factor of 1.6 for the muon channel. The difference between these
values is likely explained by the different composition of the QCD background in the two analyses. For
the electron case, this normalisation factor is obtained by comparing data and Monte-Carlo samples of
high transverse-momentum electron candidates which are dominated by QCD background. For the muon
[GeV]
E T
20 30 40 50 60 70 80 90 100
Entries / 5 GeV
1 10 10 2
10 3
10 4
10 5
10 6
[GeV]
E T
20 30 40 50 60 70 80 90 100
Entries / 5 GeV
1 10 10 2
10 3
10 4
10 5
10 6
ATLAS L dt = 315 nb -1
∫
= 7 TeV ) s Data 2010 (
ν
→ e W QCD
→ ee Z
ν τ
→ W
τ τ
→ Z
t t
(a)
20 30 40 50 60 70 80 90 100 1
10 10 2
10 3
10 4
10 5
10 6
20 30 40 50 60 70 80 90 100 1
10 10 2
10 3
10 4
10 5
10 6
[GeV]
p T
20 30 40 50 60 70 80 90 100
Entries / 5 GeV
1 10 10 2
10 3
10 4
10 5
10 6
Data 2010 (s = 7 TeV)ν µ
→ W QCD
ν τ
→ W →µµ Z
τ τ
→ Z
t t
ATLAS L dt = 310 nb -1
∫
(b)
Fig. 1: Calorimeter cluster E T of “tight” electron candidates (a) and combined p T of muon candidates (b) for data and Monte-Carlo simulation, broken down into the signal and various background components. The vertical line in (b) indicates the analysis cut. The transverse momentum region between 15 and 20 GeV of the muon sample is used in the estimation of the QCD background (see Section 6.2).
case, this normalisation factor is obtained from a non-isolated muon data sample and is then applied to the isolated muon sample used in this analysis.
Unless otherwise stated, all Monte-Carlo distributions shown in this paper have been normalised to the integrated luminosity of the data as described in Section 3, using the cross sections as given in Table 1 and taking into account these scale factors for the QCD background. At this stage of the selection, the event samples are dominated by QCD background. These distributions show agreement in shape between data and Monte-Carlo simulation.
5.3 Lepton isolation
The use of an isolation parameter to enhance the signal-to-background ratio was investigated. Separate isolation requirements must be considered for the electron and muon channels, since the electron can undergo bremsstrahlung, while a muon is primarily defined by its track.
A calorimeter-based isolation parameter defined as the total calorimeter transverse energy in a cone of
∆R < 0.3 surrounding the candidate electron cluster, divided by the cluster E T , is considered for the electron channel. This variable is exploited for background estimations in this channel, but is not used in the event selection.
In the muon analysis, a track-based isolation defined as the sum of the transverse momenta of tracks with p T > 1 GeV in the inner detector within a cone of ∆R < 0.4 around the muon track, divided by the p T of the muon, is considered. An isolation requirement of ∑ p ID T / p T < 0.2 is imposed in the muon selection given that, after all other selections are made to identify W candidates, this requirement rejects over 84%
of the expected QCD background while keeping (98.4±1.0)% of the signal events.
5.4 Kinematic selection
Additional requirements beyond those in Sections 5.2 and 5.3 are imposed to better discriminate W → `ν
and Z → `` events from background events. A summary of all requirements is as follows:
[GeV]
T
E miss
0 20 40 60 80 100 120
Entries / 5 GeV
1 10 10 2
10 3
10 4
10 5
[GeV]
T
E miss
0 20 40 60 80 100 120
Entries / 5 GeV
1 10 10 2
10 3
10 4
10 5
ATLAS L dt = 315 nb -1
∫
= 7 TeV ) s Data 2010 (
ν
→ e W QCD
ν τ
→ W
→ ee Z
τ τ
→ Z
t t
(a)
0 20 40 60 80 100 120
1 10 10 2
10 3
10 4
10 5
0 20 40 60 80 100 120
1 10 10 2
10 3
10 4
10 5
[GeV]
miss
E T
0 20 40 60 80 100 120
Entries / 5 GeV
1 10 10 2
10 3
10 4
10 5
= 7 TeV) s Data 2010 (
ν µ
→ W QCD
ν τ
→ W →µµ Z
τ τ
→ Z
t t
ATLAS L dt = 310 nb -1
∫
(b)
Fig. 2: Distributions of the missing transverse energy, E T miss , of electron (a) and muon (b) candidates for data and Monte-Carlo simulation, broken down into the signal and various background components.
– An electron with E T > 20 GeV or a combined muon with p T > 20 GeV;
For the W → eν analysis, events containing an additional “medium” electron are vetoed. If more than one combined muon candidate is reconstructed, the one with the highest p T is chosen.
– Isolation for the muon channel: ∑ p ID T /p T < 0.2;
For the electron channel, no isolation criterion is used.
– For the W analysis only:
– Missing transverse energy E T miss > 25 GeV;
– Transverse mass of the lepton-E T miss system, m T > 40 GeV;
The transverse mass is defined as m T = q
2 p ` T E T miss (1 − cos ∆φ), where ∆φ is the azimuthal separation between the directions of the lepton and the missing transverse energy.
– For the Z analysis only:
– A pair of oppositely-charged leptons (each lepton with p T > 20 GeV) of the same flavour;
– Invariant mass window of lepton pair: 66 < m `` < 116 GeV;
– Veto on events with three or more “medium” electrons (for the Z → ee analysis).
Figure 2 shows the E T miss distributions of electron and muon candidates passing the requirements de-
scribed above, except the E T miss and m T criteria. Both distributions indicate that applying a minimum
requirement on E T miss greatly enhances the W signal over the expected background. True W → `ν events
in the Monte Carlo are predominantly at high E T miss due to the escaping neutrino in the event. Although
some of the QCD background events may also have neutrinos in their final state, they mostly populate
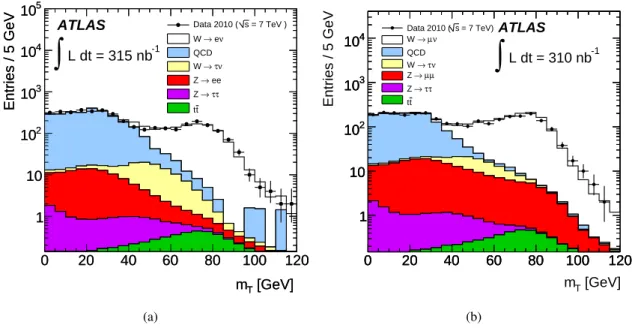
the regions of small E T miss . Figures 3 and 4 show the m T distributions without and with the requirement
of E T miss > 25 GeV.
[GeV]
m T
0 20 40 60 80 100 120
Entries / 5 GeV
1 10 10 2
10 3
10 4
10 5
[GeV]
m T
0 20 40 60 80 100 120
Entries / 5 GeV
1 10 10 2
10 3
10 4
10 5
ATLAS L dt = 315 nb -1
∫
= 7 TeV ) s Data 2010 (
ν
→ e W QCD
ν τ
→ W
→ ee Z
τ τ
→ Z
t t
(a)
0 20 40 60 80 100 120
1 10 10 2
10 3
10 4
0 20 40 60 80 100 120
1 10 10 2
10 3
10 4
[GeV]
m T
0 20 40 60 80 100 120
Entries / 5 GeV
1 10 10 2
10 3
10 4
= 7 TeV) s Data 2010 (
ν µ
→ W QCD
ν τ
→ W →µµ Z
τ τ
→ Z
t t
ATLAS L dt = 310 nb -1
∫
(b)
Fig. 3: Distributions of the transverse mass, m T , of the electron-E T miss system (a) and muon-E T miss system (b) without an E T miss requirement. The data are compared to Monte-Carlo simulation, broken down into the signal and various background components.
[GeV]
m T
0 20 40 60 80 100 120
Entries / 5 GeV
1 10 10 2
10 3
10 4
10 5
[GeV]
m T
0 20 40 60 80 100 120
Entries / 5 GeV
1 10 10 2
10 3
10 4
10 5
= 7 TeV ) s Data 2010 (
ν
→ e W QCD
ν τ
→ W
t t
→ ee Z
τ τ
→ Z
ATLAS L dt = 315 nb -1
∫
(a)
0 20 40 60 80 100 120
1 10 10 2
10 3
10 4
0 20 40 60 80 100 120
1 10 10 2
10 3
10 4
[GeV]
m T
0 20 40 60 80 100 120
Entries / 5 GeV
1 10 10 2
10 3
10 4
= 7 TeV) s Data 2010 (
ν µ
→ W QCD
ν τ
→ W
µ µ
→ Z
τ τ
→ Z
t t
ATLAS L dt = 310 nb -1
∫
(b)
Fig. 4: Distributions of the transverse mass, m T , of the electron-E T miss system (a) and muon-E T miss system (b) with a requirement of E T miss > 25 GeV. The data are compared to Monte-Carlo simulation, broken down into the signal and various background components.
5.5 W and Z candidates after final selection
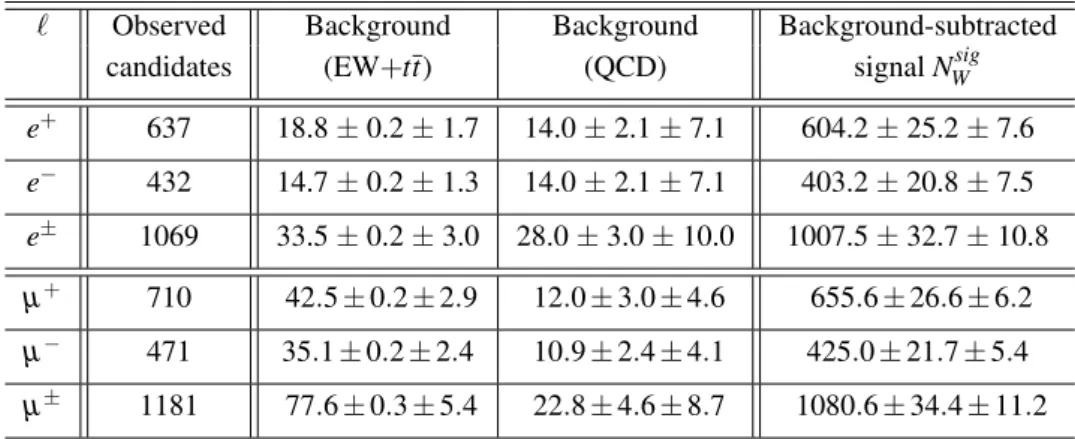
Table 2 summarises the number of W → `ν candidates remaining after each major requirement in the
respective analyses. A total of 1069 candidates (637 e + and 432 e − ) pass all requirements in the electron
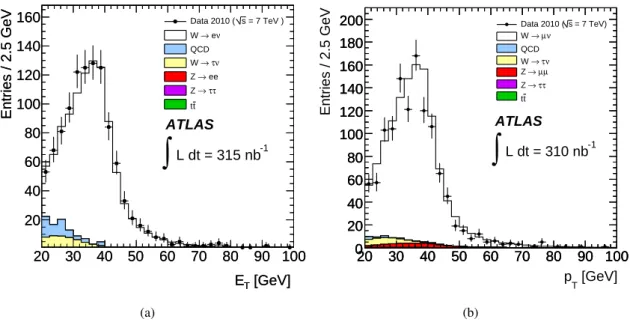
channel and 1181 candidates (710 µ + and 471 µ − ) in the muon channel. Figure 5 shows the electron
cluster E T and muon combined p T of the lepton candidates, while Fig. 6 shows the p T spectrum of the
W → `ν candidates. Both channels demonstrate a clear W signal over an almost negligible background.
Requirement Number of candidates W → eν W → µ ν
Trigger 6.5 × 10 6 5.1 × 10 6
Lepton: e with E T > 20 GeV or µ with p T > 20 GeV 4003 7052
Muon isolation: ∑ p ID T /p T < 0.2 – 2920
E T miss > 25 GeV 1116 1220
m T > 40 GeV 1069 1181
Table 2: Number of W → eν and W → µ ν candidates in data, remaining after each major requirement.
[GeV]
E T
20 30 40 50 60 70 80 90 100
Entries / 2.5 GeV
20 40 60 80 100 120 140 160
[GeV]
E T
20 30 40 50 60 70 80 90 100
Entries / 2.5 GeV
20 40 60 80 100 120 140 160
ATLAS L dt = 315 nb -1
∫
= 7 TeV ) s Data 2010 (
ν
→ e W QCD
ν τ
→ W
→ ee Z
τ τ
→ Z
t t
(a)
20 30 40 50 60 70 80 90 100 0
20 40 60 80 100 120 140 160 180 200
20 30 40 50 60 70 80 90 100 0
20 40 60 80 100 120 140 160 180 200
[GeV]
p T
20 30 40 50 60 70 80 90 100
Entries / 2.5 GeV
0 20 40 60 80 100 120 140 160 180
200
Data 2010 (s = 7 TeV)ν µ
→ W QCD
ν τ
→ W
µ µ
→ Z
τ τ
→ Z
t t
ATLAS L dt = 310 nb -1
∫
(b)
Fig. 5: Distributions of the electron cluster E T (a) and muon p T (b) of the W candidates after final selection. The requirements of E T miss > 25 GeV and m T > 40 GeV are applied. The data are compared to Monte-Carlo simulation, broken down into the signal and various background components.
Requirement Number of candidates
Z → ee Z → µ µ
Trigger 6.5 ×10 6 5.1 × 10 6
Two leptons (ee or µ µ with E T (p T ) >20 GeV) 83 144 Muon isolation: ∑ p ID T / p T < 0.2 – 117
Opposite charge ee or µ µ pair: 78 117
66 < m `` < 116 GeV 70 109
Table 3: Number of Z → ee and Z → µ µ candidates in data, remaining after each major requirement.
Table 3 summarises the number of Z → `` candidates remaining after each major requirement has been
imposed. A total of 70 candidates pass all requirements in the electron channel and 109 candidates in
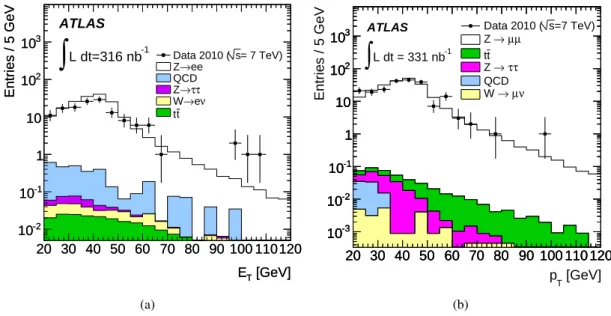
the muon channel, within the invariant mass window 66 < m `` < 116 GeV. Figure 7 shows the electron
cluster E T and muon combined p T of the lepton candidates. The breakdown of the various background
contributions are also shown in this figure. Due to the small size of the backgrounds in both channels,
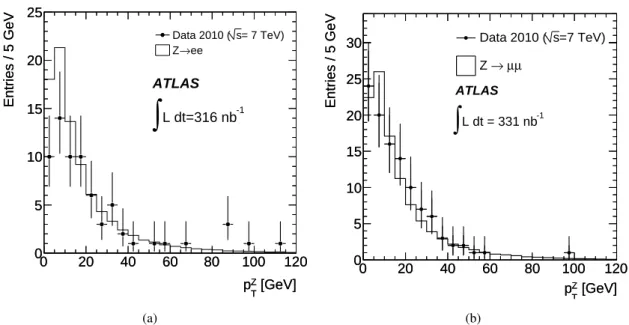
backgrounds are not shown in the subsequent distributions for the Z analysis. Figure 8 shows the p T
spectrum of the Z → `` candidates. The invariant mass distribution of the lepton pairs is presented
in Fig. 9. The observed resolution degradation in the muon data compared to design expectations is
currently under investigation. It has been taken into account in the systematic uncertainties of the cross-
[GeV]
T
p W
0 10 20 30 40 50 60 70 80 90 100
Entries / 2.5 GeV
20 40 60 80 100 120 140 160 180
[GeV]
T
p W
0 10 20 30 40 50 60 70 80 90 100
Entries / 2.5 GeV
20 40 60 80 100 120 140 160
180
Data 2010 ( s = 7 TeV )ν
→ e W QCD
ν τ
→ W
→ ee Z
τ τ
→ Z
t t
ATLAS L dt = 315 nb -1
∫
(a)
0 10 20 30 40 50 60 70 80 90 100 0
20 40 60 80 100 120 140 160 180 200
0 10 20 30 40 50 60 70 80 90 100 0
20 40 60 80 100 120 140 160 180 200
[GeV]
W
p T
0 10 20 30 40 50 60 70 80 90 100
Entries / 2.5 GeV
0 20 40 60 80 100 120 140 160 180
200
Data 2010 (s = 7 TeV)ν µ
→ W QCD
ν τ
→ W →µµ Z
τ τ
→ Z
t t
ATLAS L dt = 310 nb -1
∫
(b)
Fig. 6: Distributions of the transverse momentum p T of the W candidates in the electron channel (a) and muon channel (b) after final selection. The requirements of E T miss > 25 GeV and m T > 40 GeV are applied. The data are compared to Monte-Carlo simulation, broken down into the signal and various background components.
[GeV]
E T
20 30 40 50 60 70 80 90 100 110120
Entries / 5 GeV
10 -2
10 -1
1 10 10 2
10 3
= 7 TeV) s Data 2010 (
→ ee Z QCD → τ τ Z → e ν W
t t
ATLAS L dt=316 nb -1
∫
[GeV]
E T
20 30 40 50 60 70 80 90 100 110120
Entries / 5 GeV
10 -2
10 -1
1 10 10 2
10 3
(a)
20 30 40 50 60 70 80 90 100 110 120 10 -3
10 -2
10 -1
1 10 10 2
10 3
20 30 40 50 60 70 80 90 100 110 120 10 -3
10 -2
10 -1
1 10 10 2
10 3
[GeV]
p T
20 30 40 50 60 70 80 90 100 110 120
Entries / 5 GeV
10 -3
10 -2
10 -1
1 10 10 2
10 3
L dt = 331 nb
-1∫
ATLAS Data 2010 ( s =7 TeV) µ
µ
→ Z
t t → τ τ Z QCD → µ ν W
(b)
Fig. 7: Distributions of the electron cluster E T (a) and muon p T (b) of the Z candidate leptons after final selec- tion. The data are compared to Monte-Carlo simulation, broken down into the signal and various background components.
section measurement.
[GeV]
Z
p T
0 20 40 60 80 100 120
Entries / 5 GeV
0 5 10 15 20 25
= 7 TeV) s Data 2010 (
→ ee Z
ATLAS L dt=316 nb -1
∫
[GeV]
Z
p T
0 20 40 60 80 100 120
Entries / 5 GeV
0 5 10 15 20 25
(a)
[GeV]
Z
p T
0 20 40 60 80 100 120
Entries / 5 GeV
0 5 10 15 20 25 30
[GeV]
Z
p T
0 20 40 60 80 100 120
Entries / 5 GeV
0 5 10 15 20 25 30
L dt = 331 nb
-1∫
ATLAS
=7 TeV) s Data 2010 (
µ µ
→ Z
(b)
Fig. 8: Distributions of the transverse momentum p T of the Z candidates in the electron channel (a) and muon channel (b) after final selection. The data are compared to the expectations from Monte-Carlo simulation.
[GeV]
m ee
60 70 80 90 100 110 120
Entries / 5 GeV
0 5 10 15 20 25 30 35 40 45 50
= 7 TeV) s Data 2010 (
→ ee
Z ATLAS
L dt=316 nb -1
∫
[GeV]
m ee
60 70 80 90 100 110 120
Entries / 5 GeV
0 5 10 15 20 25 30 35 40 45 50
(a)
[GeV]
µ
m µ
60 70 80 90 100 110 120
Entries / 5 GeV
0 10 20 30 40 50 60 70
L dt = 331 nb
-1∫
ATLAS
=7 TeV) s Data 2010 (
µ µ
→ Z
(b)
Fig. 9: Distributions of the invariant mass m `` of Z candidates in the electron (a) and muon (b) channels. The data
are compared to the expectations from Monte-Carlo simulation.
6 W and Z boson signals and backgrounds
In this section, estimates of the various background components in the W and Z-candidate samples, and background-subtracted signal numbers, are presented. Except for the Z → µ µ final state, the QCD components of the backgrounds were estimated from the data. The electroweak and tt components were obtained for all channels from Monte-Carlo simulation.
6.1 Background estimate for the W → eν channel
The expected contributions from the W → τ ν , Z → ee and Z → τ τ processes were estimated to be 25.9, 1.9, and 1.6 events, respectively, while from tt production 4.1 events are expected.
The QCD background was estimated using the distribution of the missing transverse energy E T miss as measured in data. Events were selected by applying all cuts used in the W selection, except the E T miss cut at 25 GeV. The resulting distribution is displayed in Fig. 10. The signal and background components in this sample were obtained from a binned maximum likelihood template fit. The shapes of the W → eν signal and of the dominant W → τ ν background were taken from Monte-Carlo simulation, whereas the shape of the QCD background was determined from data.
The background template was obtained by using the W selection, but not applying all electron identifica- tion requirements and reversing some of the requirements in the “tight” electron identification. In order to suppress the residual contribution from W → eν signal events and to obtain an essentially signal-free sample, isolated candidates were rejected. Using a high-statistics QCD-dijet Monte-Carlo sample, it was verified that these requirements produce a background template similar in shape to the background ex- pected from the W selection. The result of the fit to the data is shown in Fig. 10. It provides a background estimate in the signal region (E T miss > 25 GeV) of N QCD = 28.0 ± 3.0(stat) events, where the uncertainty contains the statistical uncertainty of the data and of the templates. This estimate is used in the extraction of the cross section in Section 7.
To estimate the systematic uncertainty, the shape of the background template was varied by applying different event selection criteria, in particular by varying isolation cuts. In addition, two extreme ranges in E T miss (0–25 GeV and 15–100 GeV) were considered as fit ranges. Based on these studies, the systematic uncertainty on the QCD background was estimated to be ± 10 events.
As an alternative estimate, the calorimeter isolation variable, ∑ ∆R<0.3 i E T i /E T , as defined in Section 5.3, was used as discriminating variable. Due to the limited statistics and the few background events, the fit was performed after applying the “loose” instead of the “tight” electron identification, while the re- quirements on E T miss and m T were kept. Using this method, the number of QCD background events was estimated to be 48.0 ± 17.0(stat). The large error results from the large uncertainty on the estimation of the jet rejection factor for the “tight” requirement with respect to the “loose” requirement. As a further cross-check the background was also estimated from the dijet Monte-Carlo simulation, including the normalisation factor discussed in Section 5.2, and was found to be 30.8 ± 6.1(stat) events, which is in agreement with the estimates presented above.
6.2 Background estimate for the W → µ ν channel
For the muon channel, the expected contributions from Z → µ µ, W → τ ν, and Z → τ τ decays are 38.4, 33.6, and 1.4 events, respectively, while the tt contribution is expected to be 4.2 events.
The QCD background is primarily composed of heavy-quark decays, with smaller contributions from pion and kaon decays and hadrons faking muons. Given the large uncertainty in the dijet cross section and the difficulty to properly simulate fake prompt muons, the QCD background has been derived from data using the two methods described in the following.
In the baseline method, the QCD background was estimated from a comparison of the number of events
[GeV]
miss
E T
0 10 20 30 40 50 60 70 80 90 100
Entries / 5 GeV
0 50 100 150 200 250 300
ATLAS L dt =315 nb -1
∫
= 7 TeV) s Data 2010 (
ν τ
→ + W ν
→ e W
QCD (data template)