A TLAS-CONF-2015-039 19 August 2015
ATLAS NOTE
ATLAS-CONF-2015-039
18th August 2015
Measurement of W ± and Z Boson Production Cross Sections in p p Collisions at √
s = 13 TeV with the ATLAS Detector
The ATLAS Collaboration
Abstract
Measurements of the W
±→ `
±ν and Z → `
+`
−production cross sections (where `
±= e
±, µ
±) in proton-proton collisions at √
s = 13 TeV are presented using data recorded by the ATLAS experiment at the LHC, corresponding to a total integrated luminosity of approx- imately 85 pb
−1. The total inclusive W
±boson production cross sections times the single- lepton-flavour branching ratios are σ
Wtot+= [10960 ± 20 (stat) ± 440 (sys)± 990 (lumi)] pb and σ
totW−= [8380±20 (stat)±350 (sys)±750 (lumi)] pb for W
+and W
−respectively. The total in- clusive Z boson production cross section times leptonic branching ratio, within the invariant mass window 66 < m
``< 116 GeV, is σ
totZ= [1869± 7 (stat) ± 42 (sys) ± 168 (lumi)] pb. The W
+, W
−, and Z boson production cross sections and cross-section ratios are also measured within a fiducial region defined by the detector acceptance. Theoretical predictions based on calculations accurate to NLO for electroweak and NNLO for QCD, using different PDF sets and predictions from different Monte Carlo generators, are compared to the measurements.
© 2015 CERN for the benefit of the ATLAS Collaboration.
Reproduction of this article or parts of it is allowed as specified in the CC-BY-3.0 license.
1 Introduction
The measurement of weak vector boson production at hadron colliders provides a benchmark of our understanding of quantum chromodynamic (QCD) and electroweak (EW) processes. The relatively large production cross sections and easily identifiable decays to leptonic final states offer a clean experimental signature which can be measured to high precision. In addition, theoretical predictions are available up to next-to-next-to-leading-order (NNLO) accuracy in QCD, and include EW corrections at next-to- leading-order (NLO) accuracy. The cross-section predictions are dependent on the parton distribution functions (PDFs) and are thus sensitive to the underlying dynamics of strongly interacting beam particles.
Therefore, measurements of W
±and Z boson 1 production o ff er a unique opportunity to test models of parton dynamics at the Large Hadron Collider’s (LHC) new higher operating centre-of-mass energy of
√ s = 13 TeV.
This note details measurements by the ATLAS experiment of the total inclusive production cross sections times leptonic branching ratios for the W → eν, W → µν, Z → e
+e
−, and Z → µ
+µ
−processes. The charge-specific cross sections for W
+and W
−boson production are also presented. These measurements are used to evaluate cross-section ratios of W
+to W
−production and of W
±to Z production. All of the measurements are performed with pp collision data corresponding to an integrated luminosity of approximately 85 pb
−1, collected at √
s = 13 TeV with the ATLAS detector during the Large Hadron Collider Run 2.
2 The ATLAS detector
The ATLAS experiment [1] is a multi-purpose particle detector with a forward-backward symmetric cylindrical geometry and nearly 4π coverage in solid angle.2 The collision point is surrounded by inner tracking devices followed by a superconducting solenoid providing a 2 T magnetic field, a calorimeter system, and a muon spectrometer.
The inner tracker provides precision tracking of charged particles for pseudorapidities |η | < 2.5. It consists of pixel and silicon-microstrip detectors inside a transition radiation tracker. One significant upgrade for the new 13 TeV running period is the presence of the Insertable B-Layer [2], an additional pixel layer that provides high-resolution hits at small radius to improve tracking performance.
In the pseudorapidity region |η | < 3.2, high-granularity lead / liquid-argon (LAr) electromagnetic (EM) sampling calorimeters are used. An iron/scintillator tile calorimeter measures hadron energies for |η | <
1.7. The endcap and forward regions, spanning 1.5 < |η | < 4.9, are instrumented with LAr calorimeters for both EM and hadronic measurements.
The muon spectrometer consists of three large superconducting toroids with 8 coils each, a system of trigger chambers, and precision tracking chambers, which provide triggering and tracking capabilities in the ranges |η | < 2.4 and |η| < 2.7, respectively.
1
Throughout this note, Z/γ
∗boson production is denoted simply as Z boson production.
2
ATLAS uses a right-handed coordinate system with its origin at the nominal interaction point (IP) in the centre of the detector and the z-axis along the beam pipe. The x-axis points from the IP to the centre of the LHC ring, and the y-axis points upward. Cylindrical coordinates (r, φ) are used in the transverse plane, φ being the azimuthal angle around the beam pipe.
The pseudorapidity is defined in terms of the polar angle θ as η = − ln tan(θ/2).
A two-level trigger system is used to select events. The first-level trigger is implemented in hardware and uses a subset of the detector information. This is followed by the software-based High-Level Trigger (HLT) system, which can run o ffl ine reconstruction and calibration software, reducing the event rate to less than 1 kHz.
3 Cross-section methodology and theoretical predictions
3.1 Methodology
The production cross section for the W
±boson σ
totW±times the branching ratio for decays into a single lepton flavour BR(W → `ν) can be expressed as:
σ
Wtot±= σ
W· BR(W → `ν) = N
WsigA
W· C
W· L (1)
and similarly for σ
totZ, introducing N
Zsig, BR( Z → `
+`
−), A
Z, and C
Zin place of the corresponding W
±values. These factors are defined as follows:
• N
Wsigand N
Zsigdenote the numbers of background-subtracted data events ( N
observed− N
background) passing the selection criteria of the analyses in the W
±and Z boson channels.
• A
Wand A
Zdenote the acceptances for the W
±and Z-boson decays under consideration, defined as the fraction of decays satisfying the geometric and kinematic requirements at the generator level (fiducial acceptance). These quantities can only be determined from Monte Carlo simulations and are defined before the decay leptons emit photons via final state radiation (Born-level FSR), unless otherwise stated.
• C
Wand C
Zdenote the ratios between the total number of generated events which pass the final selection requirements after reconstruction and the total number of generated events within the fi- ducial acceptance. These correction factors include the efficiencies for triggering, reconstructing, and identifying the W
±and Z-boson decays falling within the acceptance, and an acceptance cor- rection accounting for the slight di ff erence between the fiducial phase space and the phase space selected in reconstruction. The denominators of the C ratios are conceptually equivalent to the numerators of the respective A ratios.
• L denotes the integrated luminosity of the data set used, which is the same for all analyses presented here.
The resulting cross sections, as defined by Eq. (1), define measured total inclusive cross sections and subsequent decay to a single lepton flavour. For the W
±bosons, they are measured separately for W
+, W
−and W
±production. The total cross sections are therefore denoted as σ
totW+, σ
totW−and σ
Wtot±. The corresponding Z boson cross section in the invariant mass range 66 < m
``< 116 GeV is referred to as σ
totZ.
The W
±boson cross section in the fiducial region, σ
fidW±, is related to the total cross section via the formula:
σ
fidW±= σ
totW±· A
W= N
WsigC
W· L (2)
and similarly for σ
fidZ.
For the W
±boson production cross section the fiducial phase space is defined by:
• p
T`> 25 GeV
• p
νT> 25 GeV
• |η
`| < 2.5
• m
T> 50 GeV
where p
`Tis the lepton transverse momentum, η
`is the lepton pseudorapidity, p
νTis the neutrino transverse momentum, and m
Tis the transverse mass defined as
m
T= q
2p
`Tp
νT1 − cos (φ
`− φ
ν)
(3) with φ
`the azimuthal angle of the charged lepton, and φ
νthe azimuthal angle of the neutrino.
Similarly, the fiducial Z boson production cross section is measured in the fiducial phase space defined by:
• p
T`> 25 GeV
• |η
`| < 2.5
• 66 < m
``< 116 GeV
where m
``is the dilepton invariant mass.
By definition, the acceptance correction factors A
Wand A
Zare not included in the measurement of the fiducial cross section. As a result, these cross sections are not affected by significant theoretical uncertainties. Future improvements on the predictions of A
Wor A
Zcan be used to extract improved total cross-section measurements.
3.2 Theoretical predictions
The geometrical acceptances A
Wand A
Zare calculated using F ewz 3.1 [3–6] with the NNLO PDFs CT10 nnlo [7]. The central values of the acceptances are provided in Table 1. The statistical uncertainties resulting from these evaluations are negligible.
The systematic uncertainties on the acceptance are dominated by the limited knowledge of the proton PDFs. The systematic uncertainties are derived from the following sources:
• PDF: These uncertainties are evaluated with four di ff erent NNLO PDFs: CT10 nnlo , NNPDF3.0 [8],
MMHT14 nnlo 68 cl [9], and ABM12LHC [10]. The PDF uncertainty of the CT10 nnlo PDF set was
rescaled from 90% CL to 68% CL to match the other sets. The quadrature sum of the CT10nnlo
eigenvectors uncertainties and the envelope of predictions from various PDFs set is taken as con-
servative estimate of the PDF uncertainties. The acceptance results determined with these alternate
PDFs are presented in Table 1.
PDF A
W+A
W−A
W±A
ZCT10 nnlo 0.396
+0.003−0.0030.399
+0.003−0.0040.397
+0.003−0.0030.399
+0.004−0.005NNPDF3.0 0.396 0.404 0.399 0.398
MMHT14 nnlo 0.394 0.406 0.399 0.398
ABM12LHC 0.395 0.408 0.401 0.402
Table 1: Summary of geometrical acceptance values A
Wand A
Zfor W → `ν and Z → `
+`
−using various PDF sets. The uncertainty in the top row is the CT10 nnlo PDF set uncertainty. All other entries are the central value for the corresponding PDF set.
PDF σ
Wfid+[pb] σ
Wfid−[pb] σ
fidW±[pb] σ
fidZ[pb] σ
fidW+/ σ
fidW−σ
fidW±/ σ
fidZCT10 nnlo 4660
+110−1403450
+90−1108110
+190−250769
+20−251.353
+0.011−0.01210.54
+0.10−0.12NNPDF3.0 4500 ± 100 3400 ± 80 7890 ± 180 740 ± 16 1.324 ± 0.007 10.67 ± 0.06 MMHT14 nnlo 4570
+80−603500
+60−508070
+130−110761
+15−131.307
+0.010−0.00610.61
+0.10−0.14ABM12LHC 4650 ± 60 3510 ± 50 8150 ± 100 769 ± 10 1.326 ± 0.004 10.594 ± 0.035 Table 2: Summary of the fiducial σ
fidW±
and σ
fidZpredictions for W → `ν and Z → `
+`
−, and their ratios using various PDFs. The fiducial region is defined in Section 3.1.The uncertainties correspond to the PDF uncertainty.
• QCD scale: The scale uncertainies are defined by the envelope of variations in which the renorm- alisation (µ
R) and factorisation (µ
F) scales are changed by factors of two subject to the constraint 0.5 ≤ µ
R/µ
F≤ 2, which excludes variations in opposite directions. These uncertainies are sym- metrised.
• α
S: The uncertainties due to α
Swere estimated following the prescription given with the CT10nnlo PDF [7], varying α
Sby ±0.001 to correspond to 68% CL. This source was found to be sub- dominant due to cancellation in the numerator and the denominatior of A
W,Z.
• Comparison of Fewz results with Powheg +Pythia 8 [11–14]: The difference between fixed-order predictions and Monte Carlo simulations was taken as an additional uncertainty.
• Parton showers and hadronisation description: These are taken from a previous publication of the W
±and Z boson inclusive cross section [15] at 7 TeV.
These components, when added in quadrature, give the systematic uncertainties on the acceptance values for W
±and Z boson production. The uncertainties were symmetrised by taking the larger of the upper and lower values for each component. The largest single source of uncertainty is the intrinsic PDF uncertainty.
The total uncertainties on the acceptance correction factors are given in Tables 9 and 10.
Theoretical predictions of the fiducial and total cross sections are computed for comparison to the meas-
ured cross sections using F ewz 3.1, thereby providing full NLO EW and NNLO QCD calculations. The
NLO EW corrections were calculated with F ewz 3.1 for Z bosons and with the Monte Carlo programme
S anc [16, 17] for W
±bosons. The calculation was done in the G
µEW scheme [18]. The cross sections
were calculated for vector boson decays into leptons at Born level, to match the definition of the measured
cross sections in the data. Thus, from complete NLO EW corrections the following components were in-
cluded: virtual QED and weak corrections, real initial state radiation (ISR) and interference between ISR
and real final state radiation (FSR) [19]. QED FSR e ff ects as simulated in P hotos [20] were used to correct
the data. For the Z boson production, all the predictions are derived including the 66 < m
``< 116 GeV
requirement. The central values of the fiducial and total cross sections are provided in Tables 2 and 3,
respectively. The statistical uncertainties resulting from these evaluations are negligible.
PDF σ
Wtot+[pb] σ
Wtot−[pb] σ
Wtot±[pb] σ
totZ[pb]
CT10 nnlo 11770
+270−3108640
+210−24020400
+500−5001930
+40−50NNPDF3.0 11360 ± 260 8410 ± 200 19800 ± 500 1860 ± 40 MMHT14 nnlo 11610
+200−1708620
+140−13020230
+330−2901909
+31−27ABM12LHC 11760 ± 150 8580 ± 100 20340 ± 250 1914 ± 23
Table 3: Summary of the total σ
totW±and σ
totZpredictions for W → `ν and Z → `
+`
−using various PDFs. The uncertainties correspond to the PDF uncertainty.
Similarly to the acceptance factors A
W±,Z, the systematic uncertainties on the predictions are dominated by the limited knowledge of the proton PDFs. Other major sources of systematic uncertainty on the predictions come from scale uncertainties and the uncertainty on α
Sas described above. Additional sources of uncertainties come from:
• Knowledge of the beam energy: a systematic uncertainty of 1% has been assumed due to the uncertainty in the beam energy [21].
• EW corrections: these contribute of the order of 0.5% to the prediction uncertainty.
• Intrinsic theory uncertainties: these uncertainties are related to the limitations of NNLO calcula- tions estimated by varying internal parameters related to the subtraction scheme and comparing to di ff erent codes. These are small for the total cross sections, and therefore were neglected. In the case of the fiducial cross sections, they are expected to contribute less than 1% to the prediction uncertainty.
The predictions for the fiducial cross sections using the CT10 nnlo PDF set are:
• σ
fidW+= [4660
+−140110(PDF) ± 70(scale) ± 85(other)] pb;
• σ
fidW−= [3450
+−11090(PDF) ± 50(scale) ± 60(other)] pb;
• σ
fidW±= [8110
+−250190(PDF) ± 120(scale) ± 145(other)] pb;
• σ
fidZ= [769
+20−25(PDF) ± 10(scale) ± 15(other)] pb.
while the predictions for the total cross sections are:
• σ
totW+= [11770
+−310270(PDF) ± 175(scale) ± 175(other)] pb;
• σ
totW−= [8640
+−240210(PDF) ± 130(scale) ± 130(other)] pb;
• σ
totW±= [20400
+−500500(PDF) ± 300(scale) ± 300(other)] pb;
• σ
totZ= [1930
+−5040(PDF) ± 30(scale) ± 30(other)] pb
The first uncertainty corresponds to the variations of the CT10 nnlo PDF set, the second to the variations
of the scale, and the third to an estimate of all remaining systematic uncertainties described in this section,
added in quadrature.
4 Dataset and simulated samples
The data were collected by the ATLAS detector during the period of June 13 to July 16, 2015. During this period, the LHC circulated 6.5 TeV proton beams with 50 ns bunch spacing. The peak delivered instantaneous luminosity was L = 1.7 × 10
33cm
−1s
−1, and the mean number of additional pp interactions per bunch crossing (pileup events) in the dataset was hµi = 19.
The dataset is screened for problems with subdetector systems or operational ine ffi ciencies, and the data passing these basic data-quality requirements correspond to a total integrated luminosity of 85 pb
−1. The uncertainty on the integrated luminosity is ±9%. It is derived, following a methodology similar to that detailed in Ref. [22], from a preliminary calibration of the luminosity scale using a pair of x-y beam separation scans performed in June 2015.
The data are compared to Monte Carlo simulations. Nearly all of the expected distributions were gen- erated with the P owheg -Box v2 Monte Carlo program [11–13], specifically the codes for single boson production [23], interfaced with the Pythia v.8.186 parton shower program [14]. The programs used the CT10 PDF set [24] and the AZNLO CTEQL1 tune for P owheg + P ythia v.8 [25]. The EvtGen v.1.2.0 program [26] was used for properties of the bottom and charm hadron decays, and P hotos++ version 3.52 was used for QED emissions from electroweak vertices and charged leptons.
Samples of top quark pairs production were generated with the P owheg -Box v2 generator and P ythia v.6.428 [27] (Perugia 2012 tune). The samples are normalised to the cross section calculated at NNLO + NNLL (next-to-next-to-leading-log) with the Top++2.0 program [28].
Diboson processes with four charged leptons, three charged leptons and one neutrino, or two charged leptons and two neutrinos were simulated using the Sherpa v2.1.1 generator [29]. The matrix elements contain the doubly-resonant W W , W Z and Z Z processes, and all other diagrams with four electroweak vertices. The 4` and 2` + 2ν processes were calculated at NLO for up to one additional parton; final states with two and three additional partons were calculated at LO. The 3` + 1ν process was calculated at NLO and up to three partons at LO using the Comix [30] and OpenLoops [31] matrix element generators and merged with the S herpa parton shower [32] using the ME + PS@NLO prescription [33]. The CT10 PDF set was used in conjunction with dedicated parton shower tuning.
Multijet events were simulated using P ythia v.8.186, and dedicated samples containing b b ¯ and c c ¯ quark final states were simulated using P ythia v.8.186 and the EvtGen v.1.2.0 program [26] in order to include the correct properties of the bottom and charm hadron decays.
To simulate the e ff ects of additional proton-proton collisions in the same and nearby bunch crossings, additional events were generated using the soft QCD processes of Pythia v.8.186 using tune A2 [34]
and the MSTW2008LO PDF. The Monte Carlo samples were reweighted so that the h µi distribution matched the observed distribution in the data. All of the samples were processed with the G eant 4-based simulation [35] of the ATLAS detector [36].
An overview of all signal and background processes considered and of the generators used for the simula- tion is given in Table 4. Total production cross sections, including higher order QCD corrections and their respective uncertainties, are listed in Table 4 for the electroweak (W
±, Z and diboson) and t¯ t processes.
For the comparison to data, all the Monte Carlo simulations, except the dijet samples, are normalised to
the results of higher order QCD calculations listed in Table 4. For the multijet background, no reliable
Physics process Generator σ (· BR [pb]) Order Reference W → `ν (` = e, µ, τ) P owheg + P ythia 8 20400 ± 5% NNLO [3–6]
W
+→ `
+ν 11770 ± 5% NNLO [3–6]
W
−→ `
−ν 8640 ± 5% NNLO [3–6]
Z → `
+`
−(66 < m
``< 116 GeV) P owheg +P ythia 8 1930 ± 5% NNLO [3–6]
t¯ t (m
t= 172.5 GeV) P owheg +P ythia 6 830 ± 6% NNLO+NNLL [28]
Dibosons S herpa 99 ± 6% NLO [29]
Dijet (e channel, ˆ p
T> 21 GeV) P ythia 8 180 × 10
3LO [14]
bb ( µ channel, ˆ p
T> 15 GeV) P ythia 8 188 LO [14]
cc ( µ channel, ˆ p
T> 15 GeV) P ythia 8 58 LO [14]
Table 4: Signal and background Monte Carlo samples from the generators used in the simulation. Each sample is normalised to the production cross section multiplied by the relevant branching ratios (BR), as shown in the third column. For the electroweak (W
±and Z boson) and top-quark production, contributions from higher order QCD corrections are included following the references given in the last column. The diboson samples include W W , W Z and Z Z on-shell and o ff -shell production. The inclusive jet and heavy quark cross sections are calculated only at LO. These samples were generated with requirements on the transverse momentum of the partons involved in the hard-scattering process, ˆ p
T.
prediction can be obtained from a leading order Monte Carlo simulation. For the final inclusive cross- section measurements, data-driven methods are used to determine the residual contributions of the multijet background to the W
±boson samples, as discussed in Section 6.
5 Event selection
Electron and muon candidate events are selected using triggers that require at least one electron or muon with transverse momentum thresholds of p
T> 24 GeV and 20 GeV, respectively, with loose isolation requirements. To recover possible e ffi ciency loss at high momenta, additional electron and muon triggers that do not make any isolation requirements are included with thresholds of p
T> 60 GeV and 50 GeV, respectively.
Candidate events are required to have a primary vertex, defined as the vertex with the highest sum of track p
T2, with at least two associated tracks.
Electron candidates are reconstructed from an isolated electromagnetic calorimeter energy deposit matched to an inner detector track and are required to have p
T> 25 GeV and to pass a medium likelihood-based identification requirement [37], within the fiducial region of pseudorapidity |η| < 2.47. Candidates within the transition region between the barrel and endcap electromagnetic calorimeters, 1.37 < | η| < 1.52, are removed. The likelihood includes measurements of calorimeter shower shapes and measurements of track properties from the inner detector. The electrons must also satisfy a p
T-dependent cone-based isolation requirement. The isolation requirement is based on both calorimeter and tracker information, and it is tuned so that the electron isolation efficiency is at least 90% for all p
T> 25 GeV.
Muons are reconstructed in the region |η| < 2.4 from muon spectrometer tracks and matching inner
detector tracks. All muons must have p
T> 25 GeV and must pass the “medium” identification require-
ments, based on requirements on the number of hits in the different inner detector and muon spectrometer
subsystems, and the q/p significance [38]. They must also satisfy the same p
T-dependent cone-based
isolation requirements, tuned so that the muon isolation e ffi ciency is at least 90% for p
T> 25 GeV.
Jets are reconstructed from calorimeter clusters using the anti-k
Talgorithm [39] with radius parameter R = 0.4 using topological clusters in the calorimeter as input objects. All jets must have p
T> 20 GeV and pseudorapidity requirement |η| < 4.5. Jets are calibrated as described in Ref. [40]. In order to reduce the e ff ects of pileup contributions, a significant fraction of tracks in each jet are required to have origins compatible with the primary vertex, as defined in the jet vertex tagger [41], and the expected average contribution from pileup clusters is subtracted according to the jet area.
The missing transverse momentum vector (E
Tmiss) is defined as the negative of the global vector sum of all identified physics objects (electrons, muons, jets) as well as specific “soft terms” accounting for unclassified soft tracks and calorimeter clusters. In this way, the missing transverse momentum is adjusted for the best calibration of the jets and the other identified physics objects above.
The W
±boson signature event selection requires exactly one identified electron or muon. If a second lepton passing the same quality and kinematic requirements is present in the event, the event is rejec- ted. The magnitude of the calibrated missing transverse momentum is required to be E
Tmiss> 25 GeV, and the transverse mass 3 is required to satisfy m
T> 50 GeV. After the full W → `ν selection a total of 463063 candidates (256923 e
+and 206140 e
−) pass all requirements in the electron channel, and 487090 candidates (272841 µ
+and 214249 µ
−) pass the requirements in the muon channel.
Events containing a Z boson candidate are selected by requiring exactly two selected leptons of the same flavor that are oppositely charged. The invariant mass of the dilepton pair has to satisfy 66 < m
``<
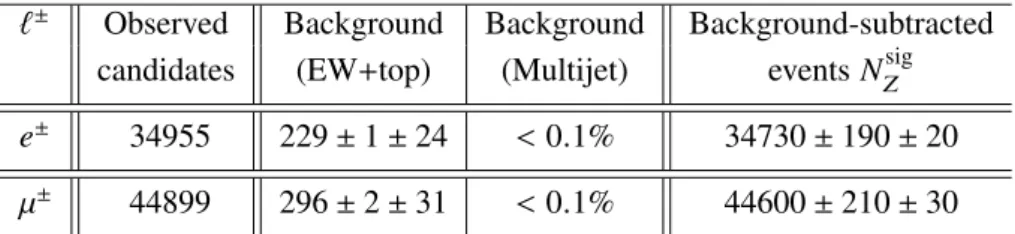
116 GeV. A total of 34955 candidates pass all requirements in the electron channel and 44899 candidates in the muon channel.
6 Background contributions to W ± and Z boson selections
Contributions from the electroweak (single boson and diboson) and top-quark components of the back- ground are obtained from the corresponding Monte Carlo samples described in Section 4. Table 5 shows the expected contributions of individual background processes in the W and Z channel. All other sources of electroweak background are expected to be negligible.
In the inclusive W
±boson analysis, the multijet component of the background is estimated from the data.
In the inclusive Z boson analysis, studies of the data invariant mass sidebands show that the multijet component is less than 0.1% of the data sample.
In the W
±boson analysis the multijet background is estimated using the transverse mass (m
T) distribu- tion in the data, because the low m
Ttail outside the signal region is largely populated by multijet events.
Events are selected by applying all of the W
±boson selection, except the m
Tthreshold at 50 GeV. The expected number of multijet events is then extracted using a binned maximum likelihood template fit on the entire m
Tspectrum, separately for events selected with positively charged leptons and negatively charged leptons. The signal and multijet background yields are free parameters in the fits. The other background components are normalised to their expectation, based on the estimated cross section and in- tegrated luminosity. Systematic uncertainties on these expected yields are applied through multiplicative scale factors on the yields, and Gaussian constraint terms for these scale factors are included in the likeli- hood fit. The fit templates for the W
±signal and for the dominant electroweak and top-quark backgrounds
3
The transverse mass is defined by Eq. 3, where p
νT
and φ
νare estimated from the measured E
missT
vector.
Expected fraction in each channel W → eν W → µν Z → e
+e
−Z → µ
+µ
−W → τν 1.8 2.0 – –
Z → τ
−τ
−0.2 0.2 < 0.1 < 0.1
Diboson – – 0.1 0.1
t t ¯ 1.2 1.1 0.5 0.5
W → eν 95.6 – < 0.1 –
W → µν – 92.0 – < 0.1
Z → e
+e
−1.2 – 99.4 –
Z → µ
+µ
−– 4.7 – 99.4
Table 5: Electroweak and top-quark background contributions estimated from simulation for the inclusive channels.
Expectations are expressed as a percentage of the total number of simulated events passing the signal selection in each channel. Sources of background that were found to be negligible in comparison with the others are indicated by a dash. The total number of events and the associated uncertainties are given in Table 6.
[GeV]
mT
Entries / 2 GeV
1 10 102
103
104
105
106
107
Data Sys.
⊕ MC Stat.
Multijet ν
→e W
ν τ
→ W Top
τ-
τ+
→ Z
e-
e+
→ Z Background CR
ν
→e W
Preliminary ATLAS
13 TeV, 85 pb-1
[GeV]
mT
0 50 100 150
Data / Pred. 0.5 1 1.5
Entries / 2 GeV
1 10 10
210
310
410
510
610
710
810
9Data Sys.
⊕ MC Stat Multijet
ν µ
→ W
µ-
µ+
→ Z
ν τ
→ W Top
τ-
τ+
→ Z
Preliminary
ATLAS
13 TeV, 85 pb
-1Background CR
νµ
→
W
[GeV]
m
T0 20 40 60 80 100 120 140
Data / Pred. 0.5 1 1.5
Figure 1: The W
±boson transverse mass spectrum reconstructed in the electron (left) and muon (right) channel, for events passing the control region selection described in the text.
are taken from Monte Carlo simulation, whereas the shape of the multijet background is determined from data, as described in the following for the electron and the muon channel.
W → eν channel: The multijet background expectation in the W → eν channel includes heavy-quark decays, converted photons, and hadrons mimicking the detector signature of electrons. A template de- rived from data with a modified electron selection (control region) is used to fit the W
±boson transverse mass distribution. The background template is obtained by using the W
±boson selection, but reversing some of the requirements in the medium electron identification, and relaxing the isolation requirement.
Some events from signal, electroweak, and top-quark processes pass the control region selection. This contamination is estimated to be about 3% and is subtracted from the data. Figure 1 (left) shows the m
Tdistribution for the data and the signal and background Monte Carlo samples in the control region.
The systematic uncertainty on the fitted background yield is estimated by inverting the isolation require-
`
±Observed Background Background Background-subtracted candidates (EW + top) (Multijet) events N
Wsige
+256923 10100 ± 600 15200 ± 300 ± 6700 231600 ± 500 ± 6700 e
−206140 8900 ± 500 15600 ± 300 ± 6900 181600 ± 500 ± 6900 µ
+272841 20420 ± 920 12200 ± 200 ± 3500 240300 ± 500 ± 3600 µ
−214249 18210 ± 830 11500 ± 100 ± 3100 184500 ± 500 ± 3200
Table 6: Number of observed events in the W → `ν channels, electroweak plus top-quark background (EW + top), and data-derived multijet background events, and background-subtracted data events. The first uncertainty is stat- istical. The second uncertainty represents the systematic uncertainties, as described in the text. The uncertainty considered for the EW + top backgrounds is the combination of the experimental uncertainties, the NNLO normal- isation uncertainties, and the small statistical uncertainty from the Monte Carlo samples. The 9% uncertainty on the luminosity determination, applicable to the EW + top backgrounds, is not included in this table.
ment in the data control region and repeating the fit using this modified template. Based on this study, the systematic uncertainty on the multijet background is estimated to be approximately 40%.
The numbers of multijet events extracted in the signal region (m
T> 50 GeV) are N
Multijete+= 15200 ± 300±
6700 events and N
Multijete−= 15600 ± 300 ± 6900 events, where the uncertainty contributions are statistical and systematic, in that order.
W → µν channel: The main sources of multijet background for the W → µν channel are non-prompt muons from b and c hadron decays. This background is modelled from data using a template built in a background-enriched control region, where the full analysis selection is applied but the isolation requirement on the muons is inverted. Those requirements ensure that the control region is orthogonal to the signal region, and reduce the signal contribution in the control region. Figure 1 (right) shows the m
Tdistribution in the control region defined above. The contamination of the multijet-enriched control region by signal and non-multijet backgrounds is estimated to be 20%. Templates are derived from the data after subtracting this contamination according to its estimate from simulation.
The total systematic uncertainty includes the uncertainties on the yield of the other background com- ponents, a possible di ff erence in the relative proportions of b b ¯ and c c ¯ between the signal region and the control region estimated with simulation, and shape di ff erences between the nominal data template and templates with different background subtraction scenarios. The main source of systematic uncertainty (∼ 20%) comes from the di ff erence between the fit results obtained using the nominal data template and a template built from an alternative data control region where the isolation requirement is unchanged with respect to the signal selection but the muon candidates are required to have a large impact parameter significance.
The number of multijet events returned by the fit is then extracted in the signal region with m
T> 50 GeV.
This results in an estimate of N
Multijetµ+= 12200 ± 200 ± 3500 events and N
Multijetµ−= 11500 ± 100 ±
3100 events, where the uncertainty contributions are statistical and systematic, in that order.
`
±Observed Background Background Background-subtracted candidates (EW + top) (Multijet) events N
Zsige
±34955 229 ± 1 ± 24 < 0.1% 34730 ± 190 ± 20 µ
±44899 296 ± 2 ± 31 < 0.1% 44600 ± 210 ± 30
Table 7: Number of observed events in the Z → `
+`
−channels, and estimates for the electroweak plus top-quark background (EW + top), the multijet background, and background-subtracted data events. The first uncertainty is statistical. The second uncertainty represents the systematic uncertainties, as described in the text. The 9%
uncertainty on the luminosity determination, applicable to the EW + top backgrounds, is not included in this table.
7 W ± and Z boson candidates
For the W → `ν and Z → `
+`
−channels, the number of observed candidate events, the estimated backgrounds from the multijet and electroweak plus top-quark processes, and the background-subtracted signal yields are summarised in Tables 6 and 7, together with their statistical and systematic uncertain- ties. The systematic uncertainties on the backgrounds include contributions from experimental sources and from theoretical uncertainties on the predicted cross sections for W
±, Z (due to cross-contamination between channels) and top-quark production. The background-subtracted data result includes the stat- istical uncertainty and the total systematic uncertainty, obtained by summing in quadrature the EW+top uncertainties and the multijet statistical and systematic uncertainties. For the Z → `
+`
−channels, the multijet background is estimated to have less than a 0.1% contribution to the cross-section measurement and is therefore neglected. All results from Monte Carlo samples have negligible statistical uncertain- ties.
The luminosity determination uncertainty of ± 9% is used in all channels but is only applicable to the electroweak and top-quark backgrounds as they are determined from Monte Carlo samples. The resulting correlation of the luminosity systematic uncertainty is fully taken into account in the calculation of the cross sections in Section 8.2.
Kinematic distributions are shown in Figs. 2-9 for the W → eν and W → µν channels, and in Figs. 10-16 for the Z → e
+e
−and Z → µ
+µ
−channels. The uncertainty bands shown in these distributions are described in Section 8.1 and are calculated from the following components:
• uncertainty due to the multijet background estimation method;
• lepton energy and momentum scale and resolution;
• lepton trigger e ffi ciency; 4
• lepton reconstruction and identification efficiency, including uncertainties on lepton isolation;
• jet energy scale and resolution;
• soft (unclustered) energy contributions in the E
missTreconstruction;
• uncertainties in background cross-section calculations for electroweak and top-quark production;
4
Due to the limited data set available, the data over Monte Carlo correction factors for the muon trigger e ffi ciency were
evaluated in coarser bins than the one used in the kinematic plots. Therefore, the uncertainties are not expected to cover
discrepancies observed on a smaller pseudorapidity range.
[GeV]
e
p
TEntries / 2 GeV
0 10 20 30 40 50
103
×
Data
Syst. Unc.
⊕ MC Stat.
ν
→e W Multijet
ν τ
→ W Top
τ-
τ+
→ Z
e-
e+
→ Z
ν
→
e W
Preliminary
ATLAS13 TeV, 85 pb
-1[GeV]
e
p
T20 30 40 50 60 70 80 90 100
Data / Pred. 0.8 0.91 1.1 1.2
Entries / 2 GeV
0 10 20 30 40 50 60
103
×
ν µ
→ W
Preliminary ATLAS
13 TeV, 85 pb
-1Data
Syst. Unc.
⊕ MC Stat.
ν µ
→ W Multijet
ν τ
→ W Top
τ-
τ+
→ Z
µ-
µ+
→ Z
[GeV]
µ
pT
20 30 40 50 60 70 80 90 100
Data / Pred. 0.8 0.91.11 1.2
Figure 2: Lepton transverse momentum distribution from the W → eν selection (left) and the W → µν selection (right). The expected contributions from all backgrounds are estimated with Monte Carlo simulations, except for the multijet background which is estimated with a data-driven method. Systematic uncertainties for the signal and background distributions are combined in the shaded band, the statistical uncertainty is shown on the data points.
The luminosity uncertainty is not included.
• statistical uncertainty due to limited Monte Carlo sample size.
These uncertainties are included in the histograms as a shaded band, but the 5% theoretical uncertainty on
the W
±and Z signal cross section and the luminosity uncertainty of ±9% are omitted from the band.
ηe
Entries / 0.2
0 5 10 15 20 25 30
103
×
Data
Syst. Unc.
⊕ MC Stat.
ν
→e W Multijet
ν τ
→ W Top
τ-
τ+
→ Z
e-
e+
→ Z ν
→
e W
Preliminary
ATLAS13 TeV, 85 pb
-1ηe
−
2
−1 0 1 2
Data / Pred. 0.8 0.9 1 1.1 1.2
Entries / 0.2
0 5 10 15 20 25 30 35 40
103
×
ν µ
→ W
Preliminary ATLAS
13 TeV, 85 pb
-1Data
Syst. Unc.
⊕ MC Stat.
ν µ
→ WMultijet
ν τ
→ W Top -
τ τ+
→ Z→µ+µ-
Z
ηµ
−2 −1 0 1 2
Data / Pred. 0.8 0.91.11 1.2
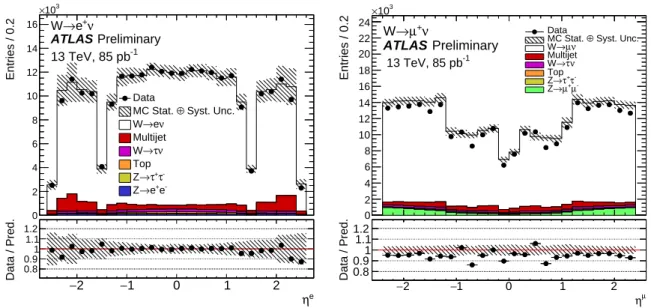
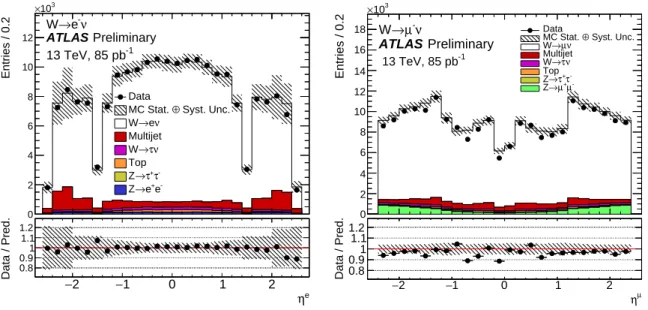
Figure 3: Lepton pseudorapidity distribution from the W → eν selection (left) and the W → µν selection (right).
The expected contributions from all backgrounds are estimated with Monte Carlo simulations, except for the mul- tijet background which is estimated with a data-driven method. Systematic uncertainties for the signal and back- ground distributions are combined in the shaded band, the statistical uncertainty is shown on the data points. The luminosity uncertainty is not included.
ηe
Entries / 0.2
0 2 4 6 8 10 12 14 16
103
×
Data
Syst. Unc.
⊕ MC Stat.
ν
→e W Multijet
ν τ
→ W Top
τ-
τ+
→ Z
e-
e+
→ Z ν
e
+→
W
Preliminary
ATLAS13 TeV, 85 pb
-1ηe
−
2
−1 0 1 2
Data / Pred. 0.8 0.9 1 1.1 1.2
Entries / 0.2
0 2 4 6 8 10 12 14 16 18 20 22 24
103
×
ν µ
+→ W
Preliminary ATLAS
13 TeV, 85 pb
-1Data ⊕ Syst. Unc.
MC Stat.
ν µ
→ W Multijet
ν τ
→ W Top -
τ τ+
→
Z -
µ µ+
→ Z
ηµ
−2 −1 0 1 2
Data / Pred. 0.8 0.91.11 1.2
Figure 4: Lepton pseudorapidity distribution as described in Figure 3, but for positively charged leptons only.
ηe
Entries / 0.2
0 2 4 6 8 10 12
103
×
Data
Syst. Unc.
⊕ MC Stat.
ν
→e W Multijet
ν τ
→ W Top
τ-
τ+
→ Z
e-
e+
→ Z ν
e
-→
W
Preliminary
ATLAS13 TeV, 85 pb
-1ηe
−
2
−1 0 1 2
Data / Pred. 0.8 0.9 1 1.1 1.2
Entries / 0.2
0 2 4 6 8 10 12 14 16 18
103
×
ν µ
-→ W
Preliminary ATLAS
13 TeV, 85 pb
-1Data ⊕ Syst. Unc.
MC Stat.
ν µ
→ W Multijet
ν τ
→ W Top -
τ τ+
→
Z -
µ µ+
→ Z
ηµ
−2 −1 0 1 2
Data / Pred. 0.8 0.91.11 1.2
Figure 5: Lepton pseudorapidity distribution as described in Figure 3 but for negatively charged leptons only.
[GeV]
miss
E
TEntries / 2 GeV
0 5 10 15 20 25 30 35 40 45
103
×
Data
Syst. Unc.
⊕ MC Stat.
ν
→e W Multijet
ν τ
→ W Top
τ-
τ+
→ Z
e-
e+
→ Z
ν
→
e W
Preliminary
ATLAS13 TeV, 85 pb
-1[GeV]
miss
E
T20 30 40 50 60 70 80 90 100
Data / Pred. 0.6 0.8 1 1.2 1.4
Entries / 2 GeV
0 10 20 30 40 50
103
×
ν µ
→ W
Preliminary ATLAS
13 TeV, 85 pb
-1Data
Syst. Unc.
⊕ MC Stat.
ν µ
→ W Multijet
ν τ
→ W Top
τ-
τ+
→ Z
µ-
µ+
→ Z
[GeV]
miss
ET
20 30 40 50 60 70 80 90 100
Data / Pred. 0.6 0.8 1 1.2 1.4
Figure 6: Missing transverse energy distribution from the W → eν selection (left) and the W → µν selection (right).
The E
Tmisshas been recalibrated using the best energy calibration for each of the identified physics objects. The
expected contributions from all backgrounds are estimated with Monte Carlo simulations, except for the multijet
background which is estimated with a data-driven method. Systematic uncertainties for the signal and background
distributions are combined in the shaded band, the statistical uncertainty is shown on the data points. The luminosity
uncertainty is not included.
[GeV]
m
TEntries / 2 GeV
0 5 10 15 20 25 30
103
×
Data
Syst. Unc.
⊕ MC Stat.
ν
→e W Multijet
ν τ
→ W Top
τ-
τ+
→ Z
e-
e+
→ Z
ν
→
e W
Preliminary
ATLAS13 TeV, 85 pb
-1[GeV]
m
T40 60 80 100 120 140
Data / Pred. 0.8 0.9 1 1.1 1.2
Entries / 2 GeV
0 5 10 15 20 25 30 35
103
×
ν µ
→ W
Preliminary ATLAS
13 TeV, 85 pb
-1Data
Syst. Unc.
⊕ MC Stat.
ν µ
→ W Multijet
ν τ
→ W Top
τ-
τ+
→ Z
µ-
µ+
→ Z
[GeV]
mT
40 60 80 100 120 140
Data / Pred. 0.8 0.91.11 1.2
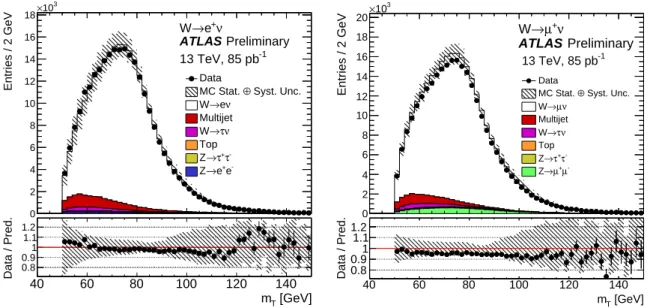
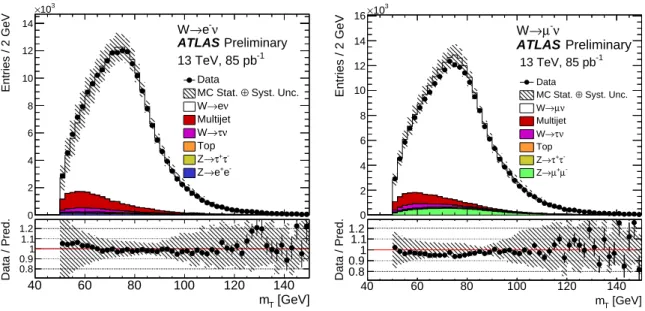
Figure 7: Transverse mass distribution, calculated from the lepton and the E
Tmissfrom the W → eν selection (left) and the W → µν selection (right). The expected contributions from all backgrounds are estimated with Monte Carlo simulations, except for the multijet background which is estimated with a data-driven method. Systematic uncertainties for the signal and background distributions are combined in the shaded band, the statistical uncertainty is shown on the data points. The luminosity uncertainty is not included.
[GeV]
m
TEntries / 2 GeV
0 2 4 6 8 10 12 14 16 18
103
×
Data
Syst. Unc.
⊕ MC Stat.
ν
→e W Multijet
ν τ
→ W Top
τ-
τ+
→ Z
e-
e+
→ Z
ν
e
+→
W
Preliminary
ATLAS13 TeV, 85 pb
-1[GeV]
m
T40 60 80 100 120 140
Data / Pred. 0.8 0.9 1 1.1 1.2
Entries / 2 GeV
0 2 4 6 8 10 12 14 16 18 20
103
×
ν µ
+→ W
Preliminary ATLAS
13 TeV, 85 pb
-1Data
Syst. Unc.
⊕ MC Stat.
ν µ
→ W Multijet
ν τ
→ W Top
τ-
τ+
→ Z
µ-
µ+
→ Z
[GeV]
mT
40 60 80 100 120 140
Data / Pred. 0.8 0.91.11 1.2
Figure 8: Transverse mass distribution as described in Figure 7 but for positively charged leptons only.
[GeV]
m
TEntries / 2 GeV
0 2 4 6 8 10 12 14
103
×
Data
Syst. Unc.
⊕ MC Stat.
ν
→e W Multijet
ν τ
→ W Top
τ-
τ+
→ Z
e-
e+
→ Z
ν
e
-→
W
Preliminary
ATLAS13 TeV, 85 pb
-1[GeV]
m
T40 60 80 100 120 140
Data / Pred. 0.8 0.9 1 1.1 1.2
Entries / 2 GeV
0 2 4 6 8 10 12 14 16
103
×
ν µ
-→ W
Preliminary ATLAS
13 TeV, 85 pb
-1Data
Syst. Unc.
⊕ MC Stat.
ν µ
→ W Multijet
ν τ
→ W Top
τ-
τ+
→ Z
µ-
µ+
→ Z
[GeV]
mT
40 60 80 100 120 140
Data / Pred. 0.8 0.91.11 1.2
Figure 9: Transverse mass distribution as described in Figure 7 but for negatively charged leptons only.
[GeV]
e
pT
Entries / GeV
0 1 2 3 4 5
103
×
Data
Syst. Unc.
⊕ MC Stat.
e-
e+
→ Z Diboson
τ-
τ+
→ Z Top
e
-e
+→
Z
Preliminary ATLAS
13 TeV, 85 pb
-1[GeV]
e
pT
20 40 60 80 100
Data/Pred. 0.8 0.91.11
1.2 µ [GeV]
pT
Entries / GeV
0 1 2 3 4 5
103
×
Data
Syst. Unc.
⊕ MC Stat.
µ-
µ+
→ Z Diboson
τ-
τ+
→ Z Top
µ-
µ+
→
Z
Preliminary ATLAS
13 TeV, 85 pb
-1[GeV]
µ
pT
20 40 60 80 100
Data/Pred. 0.8 0.91.11 1.2
Figure 10: Lepton transverse momentum distributions from the Z → e
+e
−selection (left) and the Z → µ
+µ
−selection (right). The expected contributions from all backgrounds are estimated with Monte Carlo simulations.
The background processes are heavily suppressed and not visible on the linear scale. Systematic uncertainties for
the signal and background distributions are combined in the shaded band, the statistical uncertainty is shown on
the data points. The luminosity uncertainty is not included. There are two lepton entries in the histogram for each
candidate event.
ηe
Entries / 0.2
0 1 2 3 4 5 6 7 8
103
×
Data
Syst. Unc.
⊕ MC Stat.
e-
e+
→ Z Diboson
τ-
τ+
→ Z Top
e
-e
+→
Z
Preliminary ATLAS
13 TeV, 85 pb
-1ηe
−2 −1 0 1 2
Data/Pred. 0.8 0.91.11
1.2 ηµ
Entries / 0.2
0 1 2 3 4 5 6 7 8
103
×
Data
Syst. Unc.
⊕ MC Stat.
µ-
µ+
→ Z Diboson
τ-
τ+
→ Z Top µ-
µ+
→
Z
Preliminary ATLAS
13 TeV, 85 pb
-1ηµ
−2 −1 0 1 2
Data/Pred. 0.8 0.91.11 1.2
Figure 11: Lepton pseudorapidity distribution from the Z → e
+e
−selection (left) and the Z → µ
+µ
−selection (right). The expected contributions from all backgrounds are estimated with Monte Carlo simulations. The back- ground processes are heavily suppressed and not visible on the linear scale. Systematic uncertainties for the signal and background distributions are combined in the shaded band, and the statistical uncertainty is shown on the data points. The luminosity uncertainty is not included. There are two lepton entries in the histogram for each candidate event.
Entries / 2 GeV
0 1 2 3 4 5 6
103
×
Data
Syst. Unc.
MC Stat. ⊕ e-
e+
Z→ Diboson
τ-
τ+
Z→ Top Preliminary
ATLAS 13 TeV, 85 pb-1
e-
e+
Z→
[GeV]
miss
ET
0 10 20 30 40 50 60 70 80
Data / Pred. 0.60.81 1.2 1.4
Entries / 2 GeV
0 1 2 3 4 5 6
103
×
Data
Syst. Unc.
MC Stat. ⊕ µ-
µ+
→ Z Diboson
τ-
τ+
Z→ Top Preliminary
ATLAS 13 TeV, 85 pb-1
µ-
µ+
Z→
[GeV]
miss
ET
0 10 20 30 40 50 60 70 80
Data / Pred. 0.60.81 1.2 1.4
Figure 12: Missing transverse energy distribution from the Z → e
+e
−selection (left) and the Z → µ
+µ
−selection
(right). The E
Tmisshas been recalibrated using the best energy calibration for the physics objects. The expected
contributions from all backgrounds are estimated with Monte Carlo simulations. The background processes are
heavily suppressed and not visible on the linear scale. Systematic uncertainties for the signal and background
distributions are combined in the shaded band, and the statistical uncertainty is shown on the data points. The
luminosity uncertainty is not included.
[GeV]
mee
Entries / GeV
0 1 2 3 4 5
103
× Data
Syst. Unc.
⊕ MC Stat.
e-
e+
→ Z Diboson
τ-
τ+
→ Z Top
e
-e
+→
Z
Preliminary ATLAS
13 TeV, 85 pb
-1[GeV]
mee
70 80 90 100 110
Data/Pred. 0.8 0.91.11
1.2 mµµ [GeV]
Entries / GeV
0 1 2 3 4 5 6 7 8
103
× Data
Syst. Unc.
⊕ MC Stat.
µ-
µ+
→ Z Diboson
τ-
τ+
→ Z Top
µ-
µ+
→
Z
Preliminary ATLAS
13 TeV, 85 pb
-1[GeV]
µ
mµ
70 80 90 100 110
Data/Pred. 0.8 0.91.11 1.2
Figure 13: Dilepton mass distribution after the Z → e
+e
−selection (left) and the Z → µ
+µ
−selection (right).
The expected contributions from all backgrounds are estimated with Monte Carlo simulations. The background processes are heavily suppressed and not visible on the linear scale. Systematic uncertainties for the signal and background distributions are combined in the shaded band, and the statistical uncertainty is shown on the data points. The luminosity uncertainty is not included.
[GeV]
mee
Entries / GeV
1 10 102
103
104
105
Data
Syst. Unc.
⊕ MC Stat.
e-
e+
→ Z Diboson
τ-
τ+
→ Z Top
e
-e
+→
Z
Preliminary ATLAS
13 TeV, 85 pb
-1[GeV]
mee
70 80 90 100 110
Data/Pred. 0.8 0.91.11
1.2 mµµ [GeV]
Entries / GeV
1 10 102
103
104
105 Data
Syst. Unc.
⊕ MC Stat.
µ-
µ+
→ Z Diboson
τ-
τ+
→ Z Top
µ-
µ+
→
Z
Preliminary ATLAS
13 TeV, 85 pb
-1[GeV]
µ
mµ
70 80 90 100 110
Data/Pred. 0.8 0.91.11 1.2
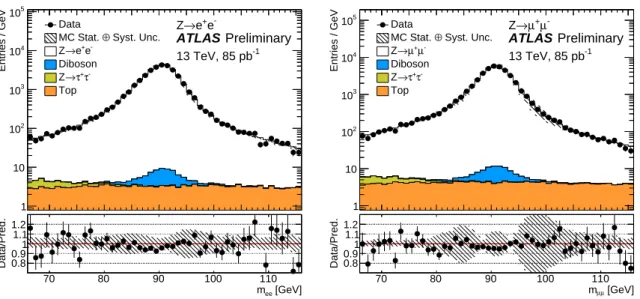
Figure 14: Dilepton mass distribution after the Z → e
+e
−selection (left) and the Z → µ
+µ
−selection (right). The
expected contributions from all backgrounds are estimated with Monte Carlo simulations. Systematic uncertainties
for the signal and background distributions are combined in the shaded band, and the statistical uncertainty is shown
on the data points. The luminosity uncertainty is not included.
[GeV]
ee
pT
Entries / 10 GeV
1 10 102
103
104
105
106 Data
Syst. Unc.
⊕ MC Stat.
e-
e+
→ Z Diboson
τ-
τ+
→ Z Top
e
-e
+→
Z
Preliminary ATLAS
13 TeV, 85 pb
-1[GeV]
ee
pT
0 50 100 150 200 250
Data/Pred. 0.8 0.91.11
1.2 µµ [GeV]
pT
Entries / 10 GeV
1 10 102
103
104
105
106 Data
Syst. Unc.
⊕ MC Stat.
µ-
µ+
→ Z Diboson
τ-
τ+
→ Z Top µ-
µ+
→
Z
Preliminary ATLAS
13 TeV, 85 pb
-1[GeV]
µ µ
pT
0 50 100 150 200 250
Data/Pred. 0.8 0.91.11 1.2
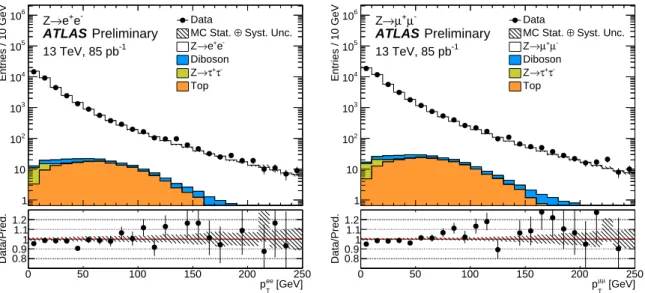
Figure 15: Z boson transverse momentum distribution after the Z → e
+e
−selection (left) and the Z → µ
+µ
−selection (right). The expected contributions from all backgrounds are estimated with Monte Carlo simulations.
Systematic uncertainties for the signal and background distributions are combined in the shaded band, and the statistical uncertainty is shown on the data points. The luminosity uncertainty is not included.
yee
Entries / 0.2
0 0.5 1 1.5 2 2.5 3 3.5 4 4.5
103
× Data
Syst. Unc.
⊕ MC Stat.
e-
e+
→ Z Diboson
τ-
τ+
→ Z Top
e
-e
+→
Z
Preliminary ATLAS
13 TeV, 85 pb
-1yee
−2 −1 0 1 2
Data/Pred. 0.8 0.91.11
1.2 yµµ
Entries / 0.2
0 0.5 1 1.5 2 2.5 3 3.5 4 4.5
103
× Data
Syst. Unc.
⊕ MC Stat.
µ-
µ+
→ Z Diboson
τ-
τ+
→ Z Top
µ-
µ+
→
Z
Preliminary ATLAS
13 TeV, 85 pb
-1µ
yµ
−2 −1 0 1 2
Data/Pred. 0.8 0.91.11 1.2