A TLAS-CONF-2019-032 15 July 2019
ATLAS CONF Note
ATLAS-CONF-2019-032
15th July 2019
Combined measurement of the total and differential cross sections in the H → γγ and the
H → Z Z ∗ → 4` decay channels at √
s = 13 TeV with the ATLAS detector
The ATLAS Collaboration
Combined measurements of the total and differential cross sections of Higgs boson production are performed with proton-proton collisions recorded by the ATLAS detector at the Large Hadron Collider. The data correspond to an integrated luminosity of 139 fb
−1produced at a center-of-mass energy of 13 TeV. The cross sections are obtained from the measured H → Z Z
∗→ 4 ` and H → γγ event yields, which are combined accounting for luminosity, detector effects, acceptances, and branching fractions. The measured total Higgs boson production cross section is 55.4
+4−4..32pb, in agreement with the Standard Model prediction. A differential cross-section measurement is also performed as a function of the Higgs boson transverse momentum. The results from the two decay channels are found to be compatible with each other, and their combination agrees with the Standard Model predictions.
© 2019 CERN for the benefit of the ATLAS Collaboration.
Reproduction of this article or parts of it is allowed as specified in the CC-BY-4.0 license.
1 Introduction and methods
This note presents measurements of the total Higgs boson production cross section and of the differential cross section as a function of Higgs boson transverse momentum p
T,Husing the H → γγ and H → Z Z
∗→ 4 ` (where ` = e, µ throughout this note) final states. The results are obtained from the full Run-2 13 TeV proton-proton dataset, produced at the Large Hadron Collider (LHC), recorded by the ATLAS detector [1], and corresponding to an integrated luminosity of 139.0 ± 2.4 fb
−1[2, 3]. The measurements are extrapolated to the full phase space and the measured cross sections are compared to Standard Model (SM) predictions.
Both the ATLAS and CMS collaborations have previously measured fiducial, total, and differential Higgs boson production cross sections in the H → γγ , H → Z Z
∗→ 4 ` , H → WW
∗→ eνµν , and H → b b ¯ decay channels [4–11].
Full descriptions of the measurement of the event yields in the H → γγ and H → Z Z
∗→ 4 ` decay channels are given in Refs. [12, 13]. Corrections are applied to these yields accounting for luminosity, detector effects, fiducial acceptances, and branching fractions. The SM values of the Higgs boson branching fractions are used, and the acceptances are based on SM predictions. Uncertainties due to the model dependence of the acceptance factors are evaluated by varying the contribution of the different Higgs boson production modes. The value of the Higgs boson mass is assumed to be 125.09 GeV [14]. The combined differential cross-section measurement reported here is based on results obtained in the individual channels using bin-by-bin correction factors.
Details about the simulated events used for the calculation of the acceptance factors and the SM predictions can be found in Refs. [12, 13]. The gluon fusion (ggF) distributions are obtained using POWHEG NNLOPS [15–25], while other production mode distributions are simulated with POWHEG [15–17] except for b bH ¯ and tH , which are simulated using MG5_aMC@NLO [26, 27]. The samples are normalized to cross sections obtained from the best available predictions as provided by the LHC Higgs Cross Section Working Group [28]. Details on the cross-section predictions are given in Table 1, including the order of the calculations in both QCD and electroweak (EW) processes, and the SM composition of the production modes. N
3LO is an abbreviation for next-to-next-to-next-to-leading order.
Table 1: Cross-section predictions used to normalize simulated SM events for the ggF [29–39], VBF [40–42], VH [43–52], t tH ¯ [53–56], tH [57, 58], and b bH ¯ [59–61] production modes, with the accuracy of the calculation for both QCD and EW processes (if the latter is not mentioned, no EW corrections are applied) and the SM fraction of each production mode.
Process Accuracy Fraction [%]
ggF N
3LO in QCD, NLO in EW 87.2
VBF (approximate) NNLO in QCD, NLO in EW 6.8
VH qq/qg: NNLO in QCD, NLO in EW; gg: NLO+NLL in QCD 4.0 t tH ¯ + tH t tH ¯ : NLO in QCD, NLO in EW, tH : NLO in QCD 1.1
b bH ¯ NNLO (NLO) in QCD for 5FS (4FS) 0.9
The branching fraction for a Higgs boson with mass m
H= 125.09 GeV decaying to H → γγ is predicted to be (0.227 ± 0.007)% [28], and the branching ratio to the four-lepton final state is predicted to be (0.0125 ± 0.0003)% [28]. Both branching ratios are calculated with HDECAY [62, 63] and PROPHECY4F [64, 65]
and include the complete NLO QCD and EW corrections. In the H → Z Z
∗→ 4 ` case, the interference
effects between identical final-state fermions are included.
A likelihood combination of the two decay channels is performed, following the method described in Ref. [4]. The p
T,Hbinning in the H → γγ analysis is finer than that in the H → Z Z
∗→ 4 ` analysis. Where needed, the sum of the respective H → γγ bins is combined with one H → Z Z
∗→ 4 ` bin. Experimental and theoretical uncertainties that affect both channels are correlated by the implementation of common nuisance parameters. These include the uncertainties in the integrated luminosity, in the Higgs boson mass value, in the description of the pileup in the simulation, and in the contributions of the different Higgs boson production modes. Additionally, the uncertainties in the branching fractions are correlated through the correlation of the corresponding underlying sources. Finally, the uncertainties in the acceptance and correction factors due to variations of the modeling of the parton shower are also correlated. All other uncertainties are treated as uncorrelated. The asymptotic approximation [66] is used when computing the uncertainties in the cross-section measurements. The validity of this approximation has been verified in previous analyses by performing pseudo-experiments.
2 Results and Conclusion
The inclusive acceptance factors, relative to the full phase space, are about 50% for the H → γγ channel and about 49% for the H → Z Z
∗→ 4 ` channel. In the H → γγ channel, the acceptance factor is about 50% at low p
T,H, 45% at intermediate values, and about 75% at high p
T,H. In the H → Z Z
∗→ 4 ` channel, the acceptance factor varies from about 45% at low p
T,Hto 65% at high p
T,H.
The total Higgs boson production cross section is measured in the H → γγ decay channel to be 56.7
+6.4−6.2pb and in the H → Z Z
∗→ 4 ` channel to be 54.4
+5−5..64pb. Combining the two channels, a result of 55.4
+4−4..32pb ( ± 3 . 1 ( stat .)
+3−.02.8
( sys .) ) is obtained. All three results are in agreement with the SM prediction of 55.6 ± 2.5 pb. Figure 1 shows the measured total cross section, together with the cross sections measured at
√ s = 7 and 8 TeV [67].
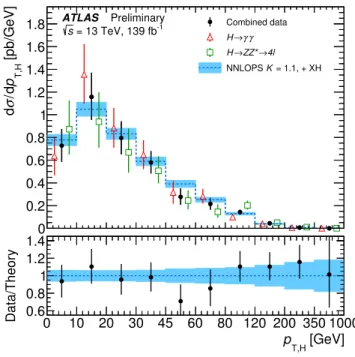
The differential cross sections as a function of p
T,Hfor the individual channels and their combination are shown in Figure 2, along with the SM prediction described above. The uncertainty band on the SM prediction includes PDF and α
Suncertainties as well as those due to missing higher-order corrections, obtained following the method described in Ref. [6]. The measurement uncertainty is dominated by the statistical component. The background modeling uncertainty in the H → γγ analysis is the main source of systematic uncertainty, followed by the luminosity estimate.
The measurements in the two decay channels are found to be compatible with a p -value of 76% for the
total cross section and 11% for the p
T,Hdistribution. The combined measurements are compatible with the
SM predictions with a p -value of 96% for the total cross section and 78% for the p
T,Hdistribution. Both
compatibility checks are performed using a likelihood approach, neglecting the uncertainties in the SM
prediction.
7 8 9 10 11 12 13 [TeV]
s 0
20 40 60 80 [pb]σH→pp 100
ATLAS Preliminary σpp→H mH = 125.09 GeV QCD scale uncertainty
s) PDF+α (scale ⊕ Total uncertainty γ
γ
→
H H→ZZ*→4l Combined data Systematic uncertainty
= 7 TeV, 4.5 fb-1
s
= 8 TeV, 20.3 fb-1
s
= 13 TeV, 139 fb-1
s
Figure 1: Total pp → H + X cross sections measured at center-of-mass energies of 7, 8, and 13 TeV, compared to Standard Model predictions. The H → γγ channel (red triangles), H → Z Z
∗→ 4 ` channel (green squares) and combined (black dots) measurements are shown. The individual channel results are offset along the x-axis for display purposes. The grey bands on the combined measurements represent the systematic uncertainty, while the error bars show the total uncertainty. The light blue band shows the estimated uncertainty due to missing higher-order corrections, and the dark blue band indicates the total uncertainty. The total theoretical uncertainty corresponds to the higher-order-correction uncertainty summed in quadrature with the sum of the PDF and α
Suncertainties, and is partially correlated across values of the center-of-mass energy.
0 0.2 0.4 0.6 0.8 1 1.2 1.4 1.6 1.8 [pb/GeV] T,Hpd/
σ
dATLAS Preliminary = 13 TeV, 139 fb-1
s Combined data
γ γ H→
→4l
→ZZ*
H
= 1.1, + XH NNLOPS K
0 10 20 30 45 60 80 120 200 350 1000 [GeV]
pT,H
0.6 0.8 1 1.2 1.4
T,HpData/Theory
Figure 2: Differential pp → H + X cross section as a function of Higgs boson transverse momentum p
T,Hin the
full phase space, compared to Standard Model predictions. The H → γγ (red triangles), H → Z Z
∗→ 4 ` (green
squares) and combined (black dots) measurements are shown. The blue dashed line shows the central value of the
sum of the NNLOPS ggF prediction, scaled to the N
3LO prediction with a K -factor of 1.1, and the contribution
of the other Higgs boson production modes XH. The SM prediction is overlaid with uncertainty bands including
PDF and α
Suncertainties as well as those due to missing higher-order corrections. For better visibility, all bins are
shown as having the same size, independent of their numerical width. The panel on the bottom shows the ratio of the
combined measurement to the prediction.
Appendix
4
10− 3
10− 2
10− 1
10−
1 10
[pb/GeV] T,Hpd/
σ
dATLAS Preliminary = 13 TeV, 139 fb-1
s
Combined data γ γ H→
→4l
→ZZ*
H
= 1.1, + XH NNLOPS K
0 10 20 30 45 60 80 120 200 350 1000 [GeV]
pT,H
0.6 0.8 1 1.2 1.4
T,HpData/Theory
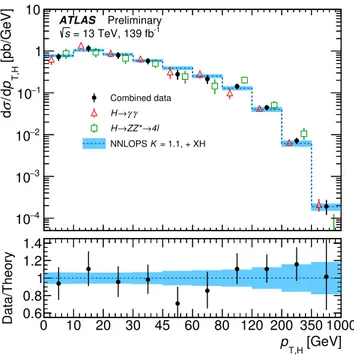
Figure 3: Differential pp → H + X cross section as a function of Higgs boson transverse momentum p
T,Hin the
full phase space, compared to Standard Model predictions. The H → γγ (red triangles), H → Z Z
∗→ 4 ` (green
squares) and combined (black dots) measurements are shown. The blue dashed line shows the central value of the
sum of the NNLOPS ggF prediction, scaled to the N
3LO prediction with a K -factor of 1.1, and the contribution
of the other Higgs boson production modes XH. The SM prediction is overlaid with uncertainty bands including
PDF and α
Suncertainties as well as those due to missing higher-order corrections. For better visibility, all bins are
shown as having the same size, independent of their numerical width. The panel on the bottom shows the ratio of the
combined measurement to the prediction.
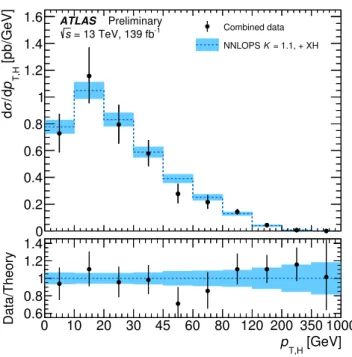
0 0.2 0.4 0.6 0.8 1 1.2 1.4 1.6
[pb/GeV] T,Hpd/
σ
dATLAS Preliminary = 13 TeV, 139 fb-1
s Combined data
= 1.1, + XH NNLOPS K
0 10 20 30 45 60 80 120 200 350 1000 [GeV]
pT,H
0.6 0.8 1 1.2 1.4
T,HpData/Theory