A TLAS-CONF-2018-034 10 July 2018
ATLAS CONF Note
ATLAS-CONF-2018-034
9th July 2018
Measurement of W ± Z production cross sections and gauge boson polarisation in √ pp collisions at
s = 13 TeV with the ATLAS detector
The ATLAS Collaboration
This note presents measurements of W
±Z production in pp collisions at a centre-of- mass energy of 13 TeV. The data were collected in 2015 and 2016 by the AT- LAS experiment at the Large Hadron Collider, and correspond to an integrated lumin- osity of 36.1 fb
−1. The W
±Z candidate events are reconstructed using leptonic de- cay modes of the gauge bosons into electrons and muons. The measured inclusive cross section in the detector fiducial region for leptonic decay modes is σ
fid.W±Z→`0ν``
= 63.7 ± 1.0 (stat.) ± 2.3 (sys.) ± 0.3 (mod.) ± 1.5 (lumi.) fb, in agreement with the next-to-next-to-leading-order Standard Model prediction of 61.5
+−1.31.4fb. Cross sections for W
+Z and W
−Z production and their ratio are presented as well as di ff erential cross sections for several kinematic observables. An analysis of angular distributions of lepton decays of W and Z bosons is performed and integrated helicity fractions in the detector fiducial region are measured for each of the W and Z bosons. The longitudinal helicity state of pair-produced vector bosons is measured in hadronic collisions.
c
2018 CERN for the benefit of the ATLAS Collaboration.
Reproduction of this article or parts of it is allowed as specified in the CC-BY-4.0 license.
1 Introduction
The study of W
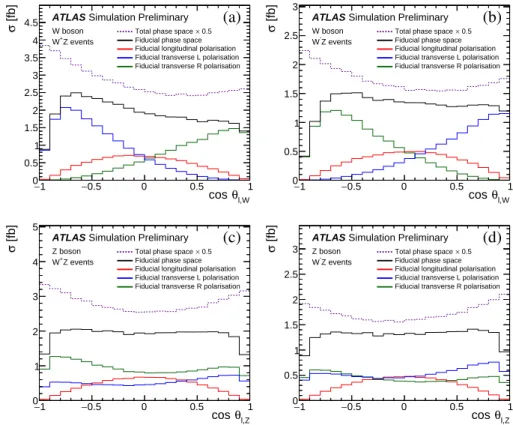
±Z diboson production is an important test of the Standard Model (SM) for its sensit- ivity to gauge boson self-interactions, related to the non-Abelian structure of the electroweak interac- tion. It provides the means to directly probe the triple gauge boson couplings (TGC), in particular the W W Z gauge coupling. Improved constraints from precise measurements can potentially probe scales of new physics in the multi-TeV range and provide a way to look for signals of new physics in a model- independent way. Previous measurements have concentrated on the inclusive and di ff erential production cross sections. In addition to new data on these cross sections, this note presents measurements of the three helicity states of the W and Z bosons. The existence of the third state, the longitudinally polarised state, is a consequence of the non-vanishing mass of the bosons, generated by the electroweak symmetry breaking mechanism. Exploration of the polarisation of gauge bosons at the LHC can provide new in- sights on their production mechanism and be used to look for new interactions that can lead to di ff erent polarisation behaviour than predicted by the SM [1, 2]. Charge-dependent polarisation measurements may be helpful in the investigation of C P violation effects in the interaction between gauge bosons [3, 4].
Measurements of the W
±Z production cross section in proton–antiproton collisions at a centre-of-mass energy of √
s = 1.96 TeV were published by the CDF and DØ collaborations [5, 6] using integrated luminosities of 7.1 fb
−1and 8.6 fb
−1, respectively. At the Large Hadron Collider (LHC), the most precise measurement of W
±Z production has been reported by the ATLAS collaboration [7] using 20.1fb
−1of data collected at a centre-of-mass energy of 8 TeV. Measurements of W
±Z production at √
s = 13 TeV based on a small data set collected in 2015 were reported by the ATLAS [8] and CMS [9] collaborations.
Other W
±Z measurements in pp collisions, at centre-of-mass energies of 7 TeV and 8 TeV, have been reported previously by ATLAS and CMS [10, 11].
At a hadron collider, the polarisation of the W boson was previously measured in the decay of the top quark by the CDF and DØ [12–14], ATLAS [15] and CMS [16] collaborations, as well as in association with jets by ATLAS [17] and CMS [18]. Polarisation and several other related angular coe ffi cient meas- urements of a singly produced Z boson were published by the CDF [19], CMS [20] and ATLAS [21]
collaborations. The polarisation of W bosons was also measured in ep collisions by the H1 Collabora- tion [22]. Finally, for dibosons, first measurements of the W polarisation were performed by LEP exper- iments in W pair production [23, 24] and were used to set limits on anomalous triple gauge couplings (aTGC) in Ref. [25].
This note presents results obtained using proton–proton (pp) collisions recorded by the ATLAS detector at a centre-of-mass energy of √
s = 13 TeV in 2015 and 2016, corresponding to an integrated luminosity of 36.1 fb
−1. The W and Z bosons are reconstructed using their decay modes into electrons or muons. This paper uses a larger sample of data than previously published results and presents additional measurements.
The production cross section is measured in a fiducial phase space inclusively and as single di ff erential
cross sections as a function of various kinematic variables, including a measure of jet activity in W
±Z
events. The reported measurements are compared with the SM cross-section predictions at the next-to-
leading order (NLO) in QCD [26, 27] and with the recent calculations at next-to-next-to-leading order
(NNLO) in QCD [28, 29]. The ratio of the W
+Z / W
−Z cross sections, which is sensitive to the parton
distribution functions (PDF) is also measured. Finally, an analysis of angular distributions of lepton
decays of W and Z bosons is performed and integrated helicity fractions in the detector fiducial region
are measured for each of the W and Z bosons.
2 ATLAS detector
The ATLAS detector [30] is a multi-purpose detector with a cylindrical geometry1 and nearly 4π cover- age in solid angle. The collision point is surrounded by tracking detectors (collectively referred to as the inner detector), located within a superconducting solenoid providing a 2 T axial magnetic field, followed by a calorimeter system and a muon spectrometer. The inner detector (ID) consists of a high-granularity silicon pixel detector and a silicon microstrip tracker, together providing precision tracking in the pseu- dorapidity range |η | < 2.5, complemented by a straw-tube transition radiation tracker providing tracking and electron identification information for |η | < 2.0. The ID includes the insertable B-layer [31], a pixel layer close to the interaction point, which provides high-resolution measurements at small radius to improve the tracking performance. The electromagnetic calorimeter covers the region |η| < 3.2 and is based on a high-granularity, lead/liquid-argon (LAr) sampling technology. The hadronic calorimeter uses a steel / scintillator-tile sampling detector in the region |η | < 1.7 and a copper / LAr detector in the region 1.5 < |η | < 3.2. The most forward region of ATLAS, 3.1 < |η | < 4.9, is equipped with a forward calorimeter, measuring electromagnetic and hadronic energies in copper/LAr and tungsten/LAr modules.
The muon spectrometer (MS) comprises separate trigger and high-precision tracking chambers to meas- ure the deflection of muons in a magnetic field generated by three large superconducting toroids arranged with an eightfold azimuthal coil symmetry around the calorimeters. The high-precision chambers cover a range of |η | < 2.7 with three layers of monitored drift tubes, complemented by cathode strip chambers in the forward region, where the particle flux is highest. The muon trigger system covers the range |η| < 2.4 with resistive-plate chambers in the barrel and thin-gap chambers in the endcap regions. A two-level trig- ger system is used to select events in real time. It consists of a hardware-based first-level trigger that uses a subset of detector information to reduce the event rate to approximately 100 kHz, and a software-based high-level trigger system that reduces the event rate to about 1 kHz. The latter employs algorithms similar to those used o ffl ine to identify electrons, muons, photons and jets.
3 Phase space for cross section measurement
The fiducial phase space used to measure the W
±Z cross section is defined to follow closely the criteria that define the signal region described in Section 5. The phase space is based on the kinematics of particle-level objects as defined in Ref. [32]. These are final-state prompt2 leptons associated with the W and Z boson decays. The kinematics of the charged lepton after QED final-state radiation (FSR) are
“dressed” by adding to the lepton four-momentum contributions from photons with an angular distance
∆R ≡ p
( ∆η )
2+ ( ∆φ)
2< 0.1 from the lepton. Dressed leptons, and final-state neutrinos that do not originate from hadron or τ lepton decays, are matched to the W and Z boson decay products using a Monte Carlo generator-independent algorithm, called the “resonant shape” algorithm. This algorithm is based on the value of an estimator expressing the product of the nominal line shapes of the W and Z
1
ATLAS uses a right-handed coordinate system with its origin at the nominal interaction point (IP) in the centre of the detector and the z-axis along the beam direction. The x-axis points from the IP to the centre of the LHC ring, and the y-axis points upward. Cylindrical coordinates (r, φ) are used in the transverse (x, y) plane, φ being the azimuthal angle around the beam direction. The pseudorapidity is defined in terms of the polar angle θ as η = −ln[tan(θ/2)].
2
A prompt lepton is a lepton that is not produced in the decay of a hadron, a τ lepton, or their descendants.
resonances
P =
1 m
2(`+,`−)−
m
PDGZ 2+ i Γ
PDGZ
m
PDGZ2
×
1 m
2(`0,ν`0)−
m
PDGW 2+ i Γ
PDGW
m
PDGW2
, (1)
where m
PDGZ(m
WPDG) and Γ
PDGZ(Γ
WPDG) are the world average mass and total width of the Z (W ) boson, respectively, as reported by the Particle Data Group [33]. The input to the estimator is the invariant mass m of all possible pairs (`
+,`
−) and (`
0, ν
`0) satisfying the fiducial selection requirements defined in the next paragraph. The final choice of which leptons are assigned to the W or Z bosons corresponds to the configuration exhibiting the largest value of the estimator. Using this specific association algorithm, the gauge boson kinematics can be computed using the kinematics of the associated leptons independently of any internal Monte Carlo generator details.
The reported cross sections are measured in a fiducial phase space defined at particle level as follows:
the transverse momentum p
Tof the dressed leptons from the Z boson decay is above 15 GeV; the p
Tof the charged lepton from the W decay is above 20 GeV; the absolute value of the pseudorapidity of the charged leptons from the W and Z bosons is below 2.5; the invariant mass of the two leptons from the Z boson decay di ff ers by at most 10 GeV from the world average value of the Z boson mass m
PDGZ. The W transverse mass, defined as m
WT= q
2 · p
νT· p
`T· [1 − cos ∆ φ(`, ν)], where ∆ φ(`, ν) is the angle between the lepton and the neutrino in the transverse plane, must be greater than 30 GeV. In addition, it is required that the angular distance ∆R between the charged leptons from the W and Z decay is larger than 0.3, and that ∆R between the two leptons from the Z decay is larger than 0.2.
The fiducial cross section is extrapolated to the total phase space and corrected for the leptonic branching fractions of the W and Z bosons, 10.86 ± 0.09 % and 3.3658 ± 0.0023 % [33], respectively. The total phase space is defined by requiring the invariant mass of the lepton pair associated with the Z boson to be in the range 66 < m
``< 116 GeV.
For the jet multiplicity di ff erential measurement, particle-level jets are reconstructed from stable particles with a lifetime of τ > 30 ps in the simulation after parton showering, hadronisation, and the decay of particles with τ < 30 ps. Muons, electrons, neutrinos and photons associated with W and Z decays are excluded from the jet collection. The particle-level jets are reconstructed with the anti-k
talgorithm [34]
with a radius parameter R = 0.4 and are required to have a p
Tabove 25 GeV and an absolute value of pseudorapidity below 4.5.
4 Signal and background simulation
A sample of simulated W
±Z events is used to correct the signal yield for detector effects, to extrapolate from the fiducial to the total phase space, and to compare the measurements to the theoretical predictions.
The production of W
±Z pairs and the subsequent leptonic decays of the vector bosons are generated at
NLO in QCD using the Powheg-Box v2 [35–38] generator, interfaced to the Pythia 8.210 [39] parton
shower model using the AZNLO [40] set of tuned parameters. The CT10 [41] PDF set is used for the
hard-scattering process, while the CTEQ6L1 [42] PDF set is used for the parton shower. The sample
uses dynamic renormalization, µ
R, and factorization, µ
F, QCD scales equal to m
W Z/2, where m
W Zis
the invariant mass of the W Z system. An additional W
±Z sample is generated by interfacing P owheg -
B ox v2 matrix elements to the H erwig++ 2.7.1 [43] parton shower model and is used to estimate an
uncertainty due to the parton shower modelling. The P owheg+ H erwig sample uses the CT10 PDF set for the matrix elements and CTEQ6L1 for the parton showers. An alternative signal sample is generated at NLO QCD using the S herpa 2.2.2 generator [44]. Matrix elements contain all diagrams with four electroweak vertices. They are calculated for up to one parton at NLO and up to three partons at LO using Comix [45] and OpenLoops [46], and merged with the Sherpa parton shower [47] according to the ME + PS@NLO prescription [48]. The NNPDF3.0nnlo [49] PDF set is used in conjunction with the dedicated parton shower tuning developed by the Sherpa authors. Finally, the NLO QCD predictions from the MC@NLO v4.0 [50] MC generator interfaced to the Herwig parton shower model, using the CT10 PDF set are also used to estimate signal modelling uncertainties.
NNLO QCD cross sections for W
±Z production in the fiducial and total phase spaces are provided by the MATRIX computational framework [28, 29, 46, 51–55]. The calculation includes contributions from o ff -shell EW bosons and all relevant interference e ff ects. The renormalisation and factorisation scales are fixed to (m
Z+ m
W)/2, chosen following Ref. [28], and the NNPDF3.0nnlo PDF set is used.
The background sources in this analysis include processes with two or more electroweak gauge bosons, namely Z Z, W W and V V V (V = W , Z ); processes with top quarks, such as t¯ t and t tV ¯ , single top and t Z;
or processes with gauge bosons associated with jets or photons (Z + j and Z γ). MC simulation is used to estimate the contribution from background processes with three or more prompt leptons. Background processes with at least one misidentified lepton are evaluated using data-driven techniques and simulated events are used to assess the systematic uncertainties on these backgrounds.
q q-initiated ¯ Z Z processes are simulated with the S herpa 2.2.2 event generator, for up to one parton at NLO and up to three partons at LO using NNPDF3.0nnlo PDF set. A S herpa 2.1.1 Z Z sample is generated with the loop-induced gg-initiated process simulated at LO using CT10 PDF, with up to one additional parton. A k-factor of 1.67 ± 0.25 is applied to the cross section of the loop-induced gg- initiated process to account for the NLO corrections [56]. Triboson events are simulated at LO with the Sherpa 2.1.1 generator using the CT10 PDF set. The t¯ tV processes are generated at NLO with the Mad- G raph 5_ a MC@NLO [57] MC generator using the NNPDF3.0nlo PDF set interfaced to the P ythia 8.186 parton shower model. Finally, the t Z events are generated at LO with the M ad G raph 5_ a MC@NLO using the NNPDF2.3lo [58] PDF set interfaced with Pythia 6.428.
All generated MC events are passed through the ATLAS detector simulation [59], based on GEANT4 [60], and processed using the same reconstruction software as used for the data. The event samples include the simulation of additional proton–proton interactions (pile-up) generated with P ythia 8.186 [61] using the MSTW2008LO [62] PDF set and the A2 [63] set of tuned parameters for the underlying event and parton fragmentation. Scale factors are applied to simulated events to correct for the small di ff erences between data and MC simulation in the trigger, reconstruction, identification, isolation and impact parameter ef- ficiencies of electrons and muons [64, 65]. Furthermore, the electron energy and muon momentum in simulated events are smeared to account for small di ff erences in resolution between data and MC [65, 66].
5 Event selection
Only data recorded with stable beam conditions and with all relevant detector subsystems operational are considered. Candidate events are selected using triggers [67] that require at least one electron or muon.
The transverse momentum threshold of the leptons required by triggers in 2015 is 24 GeV for electrons
and 20 GeV for muons satisfying a loose isolation requirement based only on ID track information. Due to the higher instantaneous luminosity in 2016 the trigger threshold was increased to 26 GeV for both electrons and muons. Furthermore, tighter lepton isolation and tighter electron identification requirements were applied. Possible ine ffi ciencies for leptons with large transverse momentum are reduced by using additional triggers that do not include any isolation requirements. The transverse momentum thresholds for these triggers are p
T= 60 GeV and 50 GeV for electrons and muons respectively. Finally, a single- electron trigger requiring p
T> 120 GeV (in 2015) and p
T> 140 GeV (in 2016) with less restrictive electron identification criteria was used to increase the selection efficiency for high- p
Telectrons. The combined e ffi ciency of these triggers is close to 100%.
Events are required to have a primary vertex reconstructed from at least two charged particle tracks, which is compatible with the luminous region. If several such vertices are present in the event, the one with the largest sum of the p
2Tof the associated tracks is selected as the primary vertex of the W
±Z production.
All final states with three charged leptons (electrons e or muons µ) and E
Tmissfrom W
±Z leptonic decays are considered. In the following, the di ff erent final states are referred to as µ
±µ
+µ
−, e
±µ
+µ
−, µ
±e
+e
−and e
±e
+e
−, where the first label is from the charged lepton of the W decay, and the last two labels are for the Z decay. No requirement on the number of jets is applied.
Muon candidates are identified by tracks reconstructed in the muon spectrometer (MS) and matched to tracks reconstructed in the inner detector (ID). Muons are required to pass a “medium” identification se- lection, which is based on requirements on the number of hits in the ID and the MS [65]. The efficiency of this selection averaged over p
Tand η is larger than 98%. The muon momentum is calculated by combin- ing the MS measurement, corrected for the energy deposited in the calorimeters, and the ID measurement.
The p
Tof the muon must be greater than 15 GeV and its pseudorapidity must satisfy |η | < 2.5.
Electron candidates are reconstructed from energy clusters in the electromagnetic calorimeter matched to inner detector tracks. Electrons are identified using a discriminant that is the value of a likelihood function constructed with information on the shape of the electromagnetic showers in the calorimeter, the track properties and the quality of the track-to-cluster matching for the candidate [64]. Electrons must satisfy a “medium” likelihood requirement, which provides an overall identification efficiency of 90%.
The electron momentum is computed from the cluster energy and the direction of the track. The p
Tof the electron must be greater than 15 GeV and the pseudorapidity of the cluster must be in the ranges
|η | < 1.37 or 1.52 < |η | < 2.47 to be within the tracking system, but exclude the transition between the barrel and endcap sections of the detector.
Electron and muon candidates are required to originate from the primary vertex. Thus, the significance of the track’s transverse impact parameter calculated with respect to the beam line, | d
0/σ
d0| , must be smaller than 3 for muons and less than 5 for electrons. Furthermore, the longitudinal impact parameter, z
0(the di ff erence between the value of z of the point on the track at which d
0is defined and the longitudinal position of the primary vertex), is required to satisfy | z
0· sin(θ) | < 0.5 mm.
Electrons and muons are required to be isolated from other particles using both calorimeter-cluster and ID-track information. The isolation requirement for electrons is tuned for an e ffi ciency of at least 90%
for p
T> 25 GeV and at least 99% for p
T> 60 GeV [64], while fixed thresholds on the isolation variables are used for muons, providing an e ffi ciency above 90% for p
T> 15 GeV muons and at least 99% for p
T> 60 GeV [65].
Jets are reconstructed from clusters of energy deposition in the calorimeter [68] using the anti-k
tal-
gorithm [34] with a radius parameter R = 0.4. The energy of jets is calibrated using a jet energy cor-
rection derived from both simulation and in situ methods using data [69]. Jets with p
Tbelow 60 GeV and with |η | < 2.4 have to pass a requirement on the jet vertex tagger [70], a likelihood discriminant that uses a combination of track and vertex information to suppress jets originating from pile-up activity.
All jets must have p
T> 25 GeV and be reconstructed in the pseudorapidity range |η| < 4.5. Jets in the ID acceptance containing a b-hadron are identified with a multivariate algorithm [71, 72] that uses the impact parameter and reconstructed secondary vertex information of the tracks contained in the jets.
Jets initiated by b-quarks are selected by setting the algorithm’s output threshold such that a 77% b-jet selection efficiency is achieved in simulated t¯ t events. The flavour tagging efficiencies are corrected based on data-driven calibration analyses.
The transverse momentum of the neutrino is estimated from the missing transverse momentum in the event, E
Tmiss, calculated as the negative vector sum of the transverse momentum of all identified hard physics objects (electrons, muons, jets), with a contribution from an additional soft term. This soft term is calculated from ID tracks matched to the primary vertex and not assigned to any of the hard objects [73].
To avoid cases where the detector response to a single physical object is reconstructed as two di ff erent final-state objects, e.g. an electron reconstructed as both an electron and a jet, several steps are followed to remove such overlaps, as described in Ref. [74].
Events are required to contain exactly three lepton candidates satisfying the selection criteria described above. To ensure that the trigger e ffi ciency is well determined, at least one of the candidate leptons is required to have p
T> 25 GeV for 2015 and p
T> 27 GeV for 2016 data, as well as being geometrically matched to a lepton that was selected by the trigger.
To suppress background processes with at least four prompt leptons, events with a fourth lepton candidate satisfying looser selection criteria are rejected. For this looser selection, the p
Tof the leptons is lowered to p
T> 5 GeV and “loose” identification requirements [64, 65] are used for both the electrons and muons.
A less stringent requirement is applied for electron isolation and is based only on ID track information.
Candidate events are required to have at least one pair of leptons of the same flavour and of opposite charge, with an invariant mass that is consistent with the nominal Z boson mass [33] to within 10 GeV.
This pair is considered to be the Z boson candidate. If more than one pair can be formed, the pair whose invariant mass is closest to the nominal Z boson mass is taken as the Z boson candidate.
The remaining third lepton is assigned to the W boson decay. The transverse mass of the W candidate, computed using E
Tmissand the p
Tof the associated lepton, is required to be greater than 30 GeV.
Backgrounds originating from misidentified leptons are suppressed by requiring the lepton associated with the W boson to satisfy more stringent selection criteria. Thus, the transverse momentum of these leptons is required to be greater than 20 GeV. Furthermore, leptons associated with the W boson decay are required to pass the “tight” identification requirements, which results in an e ffi ciency between 90%
and 98% for muons and an overall efficiency of 85% for electrons. Finally, these muons must also pass a tighter isolation requirement, tuned for an efficiency of at least 90% (99%) for p
T> 25 (60) GeV.
6 Background estimation
The background sources are classified into two groups: events where at least one of the candidate leptons
is not a prompt lepton (reducible background) and events where all candidates are prompt leptons or are
produced in the decay of a τ (irreducible background). Candidates that are not prompt leptons are also called “misidentified” or “fake” leptons.
Events in the first group originate from Z + j, Z γ, t¯ t, and W W production processes and constitute about 40% of the total backgrounds. This reducible background is estimated with a data-driven method based on the inversion of a global matrix containing the efficiencies and the misidentification probabilities for prompt and fake leptons [7, 75]. The method exploits the classification of the leptons as loose or tight can- didates and the probability that a fake lepton is misidentified as a loose or tight lepton. Tight leptons are signal leptons as defined in Section 5. Loose leptons are leptons that do not meet the isolation and iden- tification criteria of signal leptons but satisfy only looser criteria. The misidentification probabilities for fake leptons are determined from data using dedicated control samples enriched in misidentified leptons from light- or heavy-flavour jets and from photon conversions. The lepton misidentification probabilities are applied to data samples of W
±Z candidate events where at least one and up to three of the leptons are loose. Then, using a matrix inversion, the number of events with at least one misidentified lepton, which represents the amount of reducible background in the W
±Z sample, is obtained. About 2% of this back- ground contribution arises from events with two fake leptons. The background from events with three fake leptons, e.g., from multijet processes, is negligible. Another independent method to assess the redu- cible background has been considered. This method estimates the amount of reducible background using MC simulations scaled to data by process-dependent factors determined from the data / MC agreement in dedicated control regions. A good agreement with the matrix method estimate was obtained.
The events contributing to the second group of background processes originate from Z Z, t¯ t + V , V V V (where V = Z or W) and t Z( j) events. The amount of irreducible background is estimated using MC simulations due to the small cross sections of the corresponding processes and the statistical limitations of estimates using data-driven methods. The dominant contribution in this second group is from Z Z production and represents about 70% of the irreducible background. The MC-based estimates of the Z Z and t¯ t + V backgrounds are validated by comparing the MC expectations with the event yield and several kinematic distributions of a data sample enriched in Z Z and t¯ t + V events, respectively.
The Z Z control sample is selected by requiring a Z candidate that meets all the analysis selection criteria accompanied by two additional leptons, satisfying the lepton criteria described in Section 5. The Z Z MC expectation needs to be rescaled by a factor of 1.12 in order to match the observed event yield of data in this control region. The shapes of the main kinematic variables are found to be well described by the MC expectations.
The t¯ t + V control sample is selected by requiring W
±Z events having at least two reconstructed b-jets.
The t¯ t + V MC expectation needs to be rescaled by a factor of 1.3 in order to match the observed event yield in data. Here again, the distributions of the main kinematic variables are found to be well described by the MC expectations.
7 Detector-level results
Table 1 summarises the predicted and observed numbers of events together with the estimated background
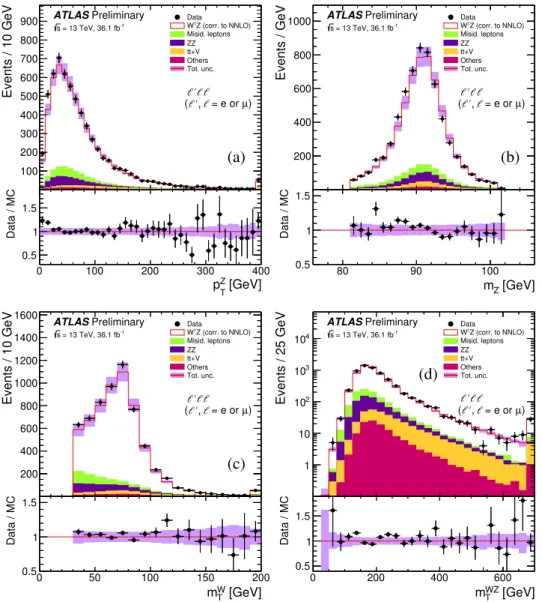
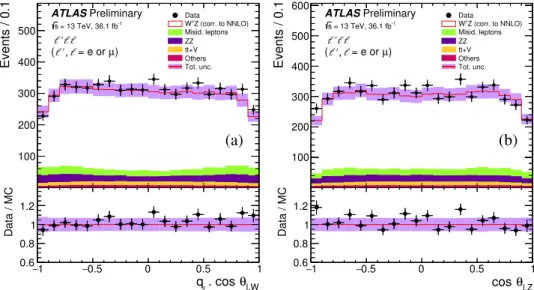
contributions. Only statistical uncertainties are quoted. Figure 1 shows the measured distributions of the
transverse momentum and the invariant mass of the Z candidate, the transverse mass of the W candidate,
and for the W Z system a variable m
W ZT. The variable m
W ZTis reconstructed as
m
W ZT= v u u t
* ,
X
3`=1
p
T`+ E
Tmiss+ -
2
−
* ,
X
3`=1
p
`x+ E
missx+ -
2
+ * ,
X
3`=1
p
`y+ E
missy+ -
2
. (2)
The Powheg+Pythia MC prediction is used for the W
±Z signal contribution. In Figure 1 and Table 1 this contribution is scaled by a global factor of 1.18 to match the NNLO cross section predicted by MATRIX. This scaling is only used for illustrative purposes in this figure and does not a ff ect the meas- urements. Figure 1 indicates that the MC predictions provide a fair description of the shapes of the data distributions.
Channel eee µee e µµ µµµ All
Data 1279 1281 1671 1929 6160
Total Expected 1221 ± 7 1281 ± 6 1653 ± 8 1830 ± 7 5986 ± 14
W Z 922 ± 5 1077 ± 6 1256 ± 6 1523 ± 7 4778 ± 12
Misid. leptons 138 ± 5 34 ± 2 193 ± 5 71 ± 2 436 ± 8
Z Z 86 ± 1 89 ± 1 117 ± 1 135 ± 1 426 ± 3
t t ¯ + V 50.0 ± 0.7 54 ± 0.7 56.1 ± 0.7 63.8 ± 0.8 225 ± 1 t Z 23.1 ± 0.4 24.8 ± 0.4 28.8 ± 0.4 33.5 ± 0.5 110 ± 1 V V V 2.5 ± 0.1 2.8 ± 0.1 3.2 ± 0.1 3.6 ± 0.1 12.0 ± 0.2
Table 1: Observed and expected numbers of events after the W
±Z inclusive selection described in Section 5 in each of the considered channels and for the sum of all channels. The expected number of W
±Z events from P owheg+ P ythia and the estimated number of background events from other processes are detailed. The P owheg+ P ythia MC prediction is scaled by a global factor of 1.18 to match the NNLO cross section predicted by MATRIX. The sum of background events containing misidentified leptons is labelled “Misid. leptons”. Only statistical uncertainties are reported.
8 Corrections for detector e ff ects and acceptance
For a given channel W
±Z → `
0±ν`
+`
−, where ` and `
0are either an electron or a muon, the integrated fiducial cross section that includes the leptonic branching fractions of the W and Z bosons is calculated as
σ
fid.W±Z→`0ν``
= N
data− N
bkgL · C
W Z× 1 − N
τN
all!
, (3)
where N
dataand N
bkgare the number of observed events and the estimated number of background events,
respectively, L is the integrated luminosity, and C
W Z, obtained from simulation, is the ratio of the num-
ber of selected signal events at detector level to the number of events at particle level in the fiducial
phase space. This factor corrects for detector e ffi ciencies and for QED final-state radiation e ff ects. The
contribution from τ lepton decays, amounting approximately to 4%, is removed from the cross-section
definition by introducing the term in parentheses. This term is computed using simulation, where N
τis
the number of selected events at detector level in which at least one of the bosons decays into a τ lepton
and N
allis the number of selected W Z events with decays into any lepton.
Events / 10 GeV
100 200 300 400 500 600 700 800
900 DataW±Z (corr. to NNLO)
Misid. leptons ZZ tt+V Others Tot. unc.
ℓ′ℓℓ ℓ′,ℓ µ) ( = e or ATLASPreliminary
= 13 TeV, 36.1 fb-1
s
[GeV]
Z
pT
0 100 200 300 400
Data / MC
0.5 1 1.5
(a)
Events / GeV
200 400 600 800
1000 DataW±Z (corr. to NNLO)
Misid. leptons ZZ tt+V Others Tot. unc.
ℓ′ℓℓ ℓ′,ℓ µ) ( = e or ATLASPreliminary
= 13 TeV, 36.1 fb-1
s
[GeV]
mZ
80 90 100
Data / MC
0.5 1 1.5
(b)
Events / 10 GeV
200 400 600 800 1000 1200 1400 1600
Data Z (corr. to NNLO) W±
Misid. leptons ZZ tt+V Others Tot. unc.
ℓ′ℓℓ ℓ′,ℓ µ) ( = e or ATLASPreliminary
= 13 TeV, 36.1 fb-1
s
[GeV]
W
mT
0 50 100 150 200
Data / MC
0.5 1 1.5
(c)
Events / 25 GeV
1 10 102
103
104
Data Z (corr. to NNLO) W±
Misid. leptons ZZ tt+V Others Tot. unc.
ℓ′ℓℓ ℓ′,ℓ µ) ( = e or ATLASPreliminary
= 13 TeV, 36.1 fb-1
s
[GeV]
WZ
mT
0 200 400 600
Data / MC
0.5 1 1.5
(d)
Figure 1: The distributions for the sum of all channels of the kinematic variables (a) p
TZ, (b) m
Z, (c) m
WTand (d) m
W ZT. The points correspond to the data, and the histograms correspond to the predictions of the di ff erent SM processes. All Monte Carlo predictions are scaled to the integrated luminosity of the data using the predicted MC cross sections of each sample. The sum of the background processes with misidentified leptons is labelled “Misid.
leptons”. The P owheg+ P ythia MC prediction is used for the W
±Z signal contribution. It is scaled by a global factor of 1.18 to match the NNLO cross section predicted by MATRIX. The open red histogram shows the total prediction; the shaded violet band is the total uncertainty of this prediction. The last bin contains the overflow.
The lower panels in each figure show the ratio of the data points to the open red histogram with their respective
uncertainties.
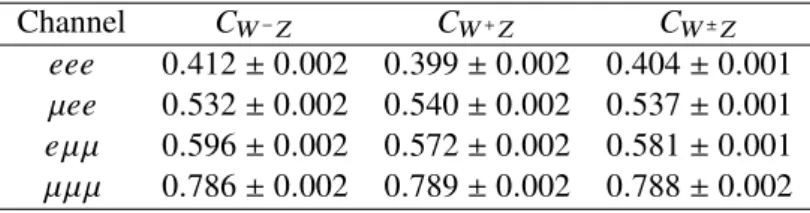
The C
W Zfactors for W
−Z , W
+Z , and W
±Z inclusive processes computed with P owheg+ P ythia for each of the four leptonic channels are shown in Table 2.
Channel C
W−ZC
W+ZC
W±Zeee 0.412 ± 0.002 0.399 ± 0.002 0.404 ± 0.001 µee 0.532 ± 0.002 0.540 ± 0.002 0.537 ± 0.001 eµµ 0.596 ± 0.002 0.572 ± 0.002 0.581 ± 0.001 µµµ 0.786 ± 0.002 0.789 ± 0.002 0.788 ± 0.002
Table 2: The C
W Zfactors for each of the eee, µee, eµµ, and µµµ inclusive channels. The P owheg+ P ythia MC event sample with the “resonant shape” lepton assignment algorithm at particle level is used. Only statistical uncertainties are reported.
The total cross section is calculated as
σ
tot.W±Z= σ
fid.W±Z→`0ν``
B
WB
ZA
W Z, (4)
where B
W= 10.86 ± 0.09 % and B
Z= 3.3658 ± 0.0023 % are the W and Z leptonic branching frac- tions [33], respectively, and A
W Zis the acceptance factor calculated at particle level as the ratio of the number of events in the fiducial phase space to the number of events in the total phase space as defined in Section 3.
A single acceptance factor of A
W Z= 0.343 ± 0.002 (stat.), obtained by averaging the acceptance factors computed in the µee and e µµ channels, is used since it has been verified that interference effects related to the presence of identical leptons in the final state, as in the eee and µµµ channels, are below 1%.
The use of the µee and e µµ channels for the computation of A
W Zavoids the ambiguity arising from the assignment at particle level of final-state leptons to the W and Z bosons.
The di ff erential detector-level distributions are corrected for detector resolution and for QED FSR e ff ects using an iterative Bayesian unfolding method [76], as implemented in the RooUnfold toolkit [77] within the fiducial phase space. The number of iterations used ranges from two to four, depending on the resolution in the unfolded variable. The width of the bins in each distribution is chosen according to the experimental resolution and to the statistical significance of the expected number of events in each bin. The fraction of signal MC events reconstructed in each bin is around 70% on average and always greater than 50%, except for the jet multiplicity distribution were it can go down to 40% for N
jets= 4.
Simulated signal events are used to obtain for each distribution a response matrix that accounts for bin- to-bin migration e ff ects between the detector-level and particle-level distributions. In the inclusive meas- urements, the P owheg+ P ythia signal sample is used since it provides a fair description of the data distri- butions. For differential measurements with jets, the Sherpa signal sample is used for the computation of the response matrix since this sample includes up to three partons in the matrix element calculation and therefore better describes the jet multiplicity of data.
9 Systematic uncertainties
The systematic uncertainties on the measured cross sections are due to uncertainties of experimental and
theoretical nature on the acceptance, on the correction procedure for detector e ff ects, on the background
estimate and on the luminosity.
The systematic uncertainties on the A
W Zand C
W Zfactors are evaluated by taking into account three sources of theoretical uncertainties related to the choice of PDF set, to the QCD renormalisation µ
Rand factorisation µ
Fscales, and to the parton showering simulation, respectively. The uncertainties due to the choice of PDF are computed using the CT10 eigenvectors and the envelope of the differences between the CT10 and CT14 [78], MMHT2014 [79] and NNPDF 3.0 [49] PDF sets, according to the PDF4LHC recommendations [80]. The QCD scale uncertainties are estimated by varying µ
Rand µ
Fby factors of two around the nominal scale m
W Z/2 with the constraint 0.5 ≤ µ
R/µ
F≤ 2, where m
W Zis the invariant mass of the W Z system. Uncertainties arising from the choice of parton shower model are estimated by interfacing Powheg with Pythia or Herwig and comparing the results. Among this three sources of theoretical uncertainty, only the choice of the parton shower model has an effect on the C
W Zfactors, of 0.5%. The uncertainty on the acceptance factor A
W Zis less than 0.5% due to the PDF choice, less than 0.7% due to the QCD scale choice, and on the order of 0.5% for the choice of parton shower model.
Uncertainties on the unfolding due to imperfect description of the data by the MC are evaluated using a data-driven method [81], where the MC di ff erential distribution is corrected to match the data distribution and the resulting weighted MC distribution at detector level is unfolded with the response matrix used in the actual data unfolding. The new unfolded distribution is compared to the weighted MC distribution at particle level and the di ff erence is taken as the systematic uncertainty.
The experimental systematic uncertainty on the C
W Zfactors and on the unfolding procedure includes uncertainties on the scale and resolution of the electron energy, muon momentum, jet energy and E
Tmiss, as well as uncertainties on the scale factors applied to the simulation in order to reproduce the trigger, reconstruction, identification and isolation efficiencies measured in data. The systematic uncertainties on the measured cross sections are determined by repeating the analysis after applying appropriate variations for each source of systematic uncertainty to the simulated samples. The uncertainties on the jet energy scale are obtained from √
s = 13 TeV simulations and in situ measurements, similar to the ones described in Ref. [82]. The uncertainty on the jet energy resolution is derived by extrapolating measurements in LHC Run-1 data to √
s = 13 TeV. The uncertainty on E
Tmissis estimated by propagating the uncertainties on the transverse momenta of hard physics objects and by applying momentum scale and resolution uncertainties to the track-based soft term [73]. The uncertainty associated with pile-up modelling is on the order of 1.3%. For the measurements of the W charge-dependent cross sections, an uncertainty arising from the charge misidentification of leptons is also considered. It affects only electrons and leads to an uncertainty of less than 0.15% on the ratio of W
+Z to W
−Z integrated cross sections determined by combining the four decay channels.
The dominant contribution among the experimental systematic uncertainties in the eee and µee channels is due to the uncertainty on the electron identification e ffi ciency, contributing at most 2.8% uncertainty to the integrated cross section, while in the e µµ and µµµ channels it originates from the muon reconstruction efficiency and is at most 2.8%.
The uncertainty on the amount of background from misidentified leptons takes into account the limited
number of events in the control regions as well as the mismatch in the background composition in the
control region used to determine the lepton misidentification rate and the control regions used to estimate
the yield in the signal region. This results in a total uncertainty of 30% on the misidentified leptons for
the integrated cross-section measurements and of 40% when the shape of the differential distributions of
the reducible background events is also considered.
An uncertainty of 12% is assigned as a global uncertainty on the amount of Z Z background predicted by the MC simulation based on the comparison with data in the Z Z control region. Similarly, a global uncertainty of 30% is assigned for the t¯ t + V background.
The uncertainty due to other irreducible background sources is evaluated by propagating the uncertainty on their MC cross sections. These are 20% for V V V [83] and 15% for t Z [7].
The uncertainty on the combined 2015 + 2016 integrated luminosity is 2.1%. It is derived, following a methodology similar to that detailed in Ref. [84], from a calibration of the luminosity scale using x- y beam-separation scans performed in August 2015 and May 2016. It is applied to the signal normalisation as well as to all background contributions that are estimated purely using MC simulations and has an effect of 2.4% on the measured cross sections.
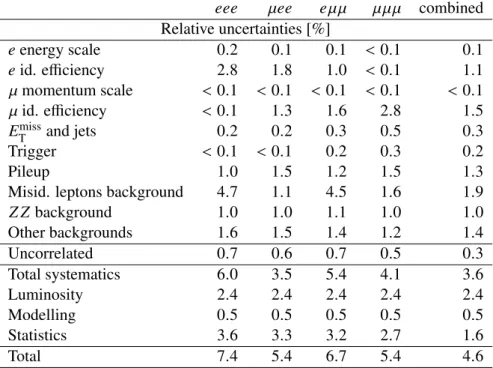
The total systematic uncertainty on the W
±Z fiducial cross section, excluding the luminosity uncertainty, varies between 4% and 6% for the four di ff erent measurement channels, and is dominated by the un- certainty on the reducible background estimate. Table 3 shows the statistical uncertainty and the main sources of systematic uncertainty on the W
±Z fiducial cross section for each of the four channels and their combination. The theory uncertainty on the measurements is dominated by the modelling of the parton shower.
eee µee e µµ µµµ combined
Relative uncertainties [%]
e energy scale 0.2 0.1 0.1 < 0.1 0.1
e id. e ffi ciency 2.8 1.8 1.0 < 0.1 1.1
µ momentum scale < 0.1 < 0.1 < 0.1 < 0.1 < 0.1
µ id. efficiency < 0.1 1.3 1.6 2.8 1.5
E
Tmissand jets 0.2 0.2 0.3 0.5 0.3
Trigger < 0.1 < 0.1 0.2 0.3 0.2
Pileup 1.0 1.5 1.2 1.5 1.3
Misid. leptons background 4.7 1.1 4.5 1.6 1.9
Z Z background 1.0 1.0 1.1 1.0 1.0
Other backgrounds 1.6 1.5 1.4 1.2 1.4
Uncorrelated 0.7 0.6 0.7 0.5 0.3
Total systematics 6.0 3.5 5.4 4.1 3.6
Luminosity 2.4 2.4 2.4 2.4 2.4
Modelling 0.5 0.5 0.5 0.5 0.5
Statistics 3.6 3.3 3.2 2.7 1.6
Total 7.4 5.4 6.7 5.4 4.6
Table 3: Summary of the relative uncertainties on the measured fiducial cross section σ
Wfid.±Zfor each channel and
for their combination. The uncertainties are reported as percentages. The decomposition of the total systematic
uncertainty into the main sources correlated between channels and the source uncorrelated between channels is
indicated in the first rows.
10 Cross-section measurements
10.1 Integrated cross sections
The measured fiducial cross sections in the four channels are combined using a χ
2minimisation method that accounts for correlations between the sources of systematic uncertainty a ff ecting each channel [85–
87]. The combination of the W
±Z cross sections in the fiducial phase space for the four channels yields a total χ
2per degree of freedom (n
do f) of χ
2/n
do f= 3.3/3. The combinations of the W
+Z and W
−Z cross sections separately yield χ
2/n
do f= 3.7/3 and 1.5/3, respectively.
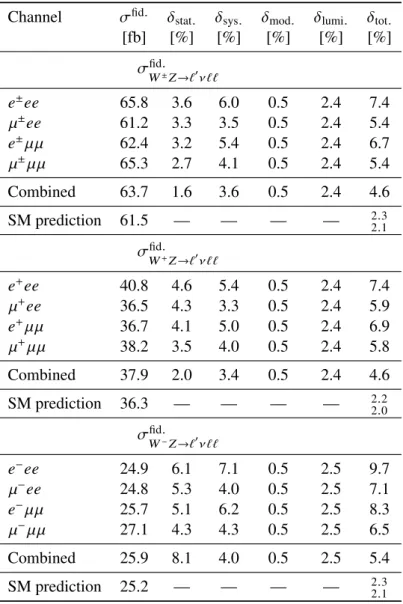
Combining the four channels to obtain a weighted mean value, the cross section of W
±Z production and decay to a single leptonic channel with muons or electrons in the fiducial phase space is
σ
fid.W±Z→`0ν``
= 63.7 ± 1.0 (stat.) ± 2.3 (sys.) ± 0.3 (mod.) ± 1.5 (lumi.) fb. (5) where the uncertainties correspond to statistical, systematic, modelling and luminosity uncertainties, re- spectively. The corresponding SM NNLO QCD prediction from MATRIX is 61.5
+−1.31.4fb, where the un- certainty corresponds to the QCD scale uncertainty estimated conventionally by varying the scales µ
Rand µ
Fby factors of two around the nominal value of (m
W+ m
Z)/2 with the constraint 0.5 ≤ µ
R/µ
F≤ 2.
This prediction is obtained by correcting the result for Born level leptons of Ref. [29] to dressed leptons by a factor of 0.96 which is estimated in the fiducial phase space using P owheg+ P ythia . The measured W
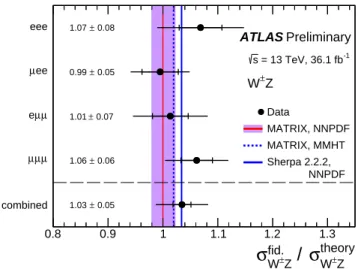
±Z production cross sections are compared to the SM NNLO prediction from MATRIX and NLO pre- dictions from S herpa 2.2.2 in Figure 2 and all results for W
±Z , W
+Z and W
−Z final states are reported in Table 4. The measured cross-sections are in good agreement with the NNLO SM predictions.
The ratio of the W
+Z to W
−Z production cross sections is σ
fid.W+Z→`0ν``
σ
fid.W−Z→`0ν``
= 1.47 ± 0.05 (stat.) ± 0.02 (sys.). (6)
Most of the systematic uncertainties, especially the luminosity uncertainty, cancel in the ratio, so that the measurement is dominated by the statistical uncertainty. The measured cross-section ratios, for each channel and for their combination, are compared in Figure 3 to the SM prediction of 1.44, which is calculated with MATRIX [29] and the NNDPF3.0nnlo. The cross-section ratio is also calculated with MATRIX using the MMHT ?? PDF set, yielding a value of 1.42 and shown in Figure 3
The combined fiducial cross section is extrapolated to the total phase space. The result is
σ
Wtot.±Z= 51.0 ± 0.8 (stat.) ± 1.8 (sys.) ± 0.9 (mod.) ± 1.2 (lumi.) pb, (7) where the theoretical uncertainty accounts for the uncertainties on the A
W Zfactor due to the choice of PDF set, QCD scales and the parton shower model.
The NNLO SM prediction calculated with MATRIX [28] is 49.1
+−1.01.1(scale) pb, which is in good agree-
ment with the present measurement. As the MATRIX calculation does not include effects of QED final-
state radiation, a correction factor of 0.99, as estimated from P owheg+ P ythia , is applied to it to obtain
the above prediction.
Channel σ
fid.δ
stat.δ
sys.δ
mod.δ
lumi.δ
tot.[fb] [%] [%] [%] [%] [%]
σ
fid.W±Z→`0ν``
e
±ee 65.8 3.6 6.0 0.5 2.4 7.4
µ
±ee 61.2 3.3 3.5 0.5 2.4 5.4
e
±µµ 62.4 3.2 5.4 0.5 2.4 6.7
µ
±µµ 65.3 2.7 4.1 0.5 2.4 5.4
Combined 63.7 1.6 3.6 0.5 2.4 4.6
SM prediction 61.5 — — — —
2.32.1σ
fid.W+Z→`0ν``
e
+ee 40.8 4.6 5.4 0.5 2.4 7.4
µ
+ee 36.5 4.3 3.3 0.5 2.4 5.9
e
+µµ 36.7 4.1 5.0 0.5 2.4 6.9
µ
+µµ 38.2 3.5 4.0 0.5 2.4 5.8
Combined 37.9 2.0 3.4 0.5 2.4 4.6
SM prediction 36.3 — — — —
2.22.0σ
fid.W−Z→`0ν``
e
−ee 24.9 6.1 7.1 0.5 2.5 9.7
µ
−ee 24.8 5.3 4.0 0.5 2.5 7.1
e
−µµ 25.7 5.1 6.2 0.5 2.5 8.3
µ
−µµ 27.1 4.3 4.3 0.5 2.5 6.5
Combined 25.9 8.1 4.0 0.5 2.5 5.4
SM prediction 25.2 — — — —
2.32.1Table 4: Fiducial integrated cross section in fb, for W
±Z, W
+Z and W
−Z production, measured in each of the
channels eee, µee, eµµ, and µµµ and for all four channels combined. The statistical (δ
stat.), total systematic (δ
sys.),
modelling (δ
mod.), luminosity (δ
lumi.) and total (δ
tot.) uncertainties are given in percent. The NNLO SM predictions
from MATRIX are also reported.
theory
±Z
σ
W fid./
±Z
σ
W0.8 0.9 1 1.1 1.2 1.3
combined µ µ µ
µ µ e µee eee
ATLAS Preliminary
Data
MATRIX, NNPDF MATRIX, MMHT Sherpa 2.2.2, NNPDF = 13 TeV, 36.1 fb-1
s
±
Z W
0.08
± 1.07
0.05
± 0.99
0.07
± 1.01
0.06
± 1.06
0.05
± 1.03
Figure 2: Ratio of the measured W
±Z integrated cross sections in the fiducial phase space to the NNLO SM pre- diction from MATRIX in each of the four channels and for their combination. The inner and outer error bars on the data points represent the statistical and total uncertainties, respectively. The NNLO SM prediction from MATRIX using the NNPDF3.0nnlo PDF set is shown as the red line; the shaded violet band is the QCD scale uncertainty on this prediction. The prediction from MATRIX using the MMHT PDF set and the NLO prediction from S herpa 2.2.2 are also displayed as a dashed-blue line and a blue line, respectively.
Z W
σ
fid.Z
/
W
σ
fid.1.1 1.2 1.3 1.4 1.5 1.6 1.7 1.8 1.9 combined
µ µ µ
µ µ e µee eee
+
-
ATLAS Preliminary
Data
MATRIX, NNPDF MATRIX, MMHT = 13 TeV, 36.1 fb-1
s 0.13
± 1.64
0.10
± 1.47
0.10
± 1.43
0.08
± 1.41
0.05
± 1.47
Figure 3: Measured ratio σ
fid.W+Z/σ
fid.W−Zof W
+Z and W
−Z integrated cross sections in the fiducial phase space in each of the four channels and for their combination. The error bars on the data points represent the total uncertain- ties, which are dominated by the statistical uncertainties. The NNLO SM prediction from MATRIX is shown as the red line. The shaded violet band represent PDF uncertainties estimated using the P owheg+ P ythia NLO calculation.
The MATRIX prediction using the MMHT PDF set is also displayed as the dashed-blue line.
10.2 Di ff erential cross sections
For the measurements of the di ff erential distributions, all four decay channels, eee, e µµ, µee, and µµµ, are added together. The resulting distributions are unfolded with a response matrix computed using a Powheg+Pythia MC signal sample that includes all four topologies and is divided by four such that cross sections refer to final states where the W and Z decay in a single leptonic channel with muons or electrons.
[fb/GeV]Z T p∆ /fid.σ∆
1
10−
Data MATRIX Sherpa 2.2.2
1.18 Powheg+Pythia × ATLASPreliminary
= 13 TeV, 36.1 fb-1
s
ν Z → W± ℓ′ ℓℓ
[fb]fidσ∆
10
[GeV]
Z
pT
0 100 200
Ratio to MATRIX 0.8 1 1.2
∞
[ ]
(a)
[fb/GeV]W T p∆ /fid.σ∆
1
10−
1
Data MATRIX Sherpa 2.2.2
1.18 Powheg+Pythia ×
ATLASPreliminary = 13 TeV, 36.1 fb-1
s
ν Z → W± ℓ′ ℓℓ
[fb]fidσ∆
1 10
[GeV]
W
pT
0 100 200
Ratio to MATRIX 0.8 1 1.2
∞
[ ]
(b)
[fb/GeV]WZ T m∆ /fid.σ∆
3
10− 2
10− 1
10−
1
Data MATRIX Sherpa 2.2.2
1.18 Powheg+Pythia ×
ATLASPreliminary = 13 TeV, 36.1 fb-1
s
ν Z → W± ℓ′ ℓℓ
[fb]fidσ∆
1
10−
1 10 102
[GeV]
WZ
mT
0 200 400 600
Ratio to MATRIX
0.5 1 1.5
[ ]
∞ (c)
(W,Z) [fb]φ∆ /fid.σ∆
10 102
Data MATRIX Sherpa 2.2.2
1.18
× Powheg+Pythia ATLASPreliminary
= 13 TeV, 36.1 fb-1
s
ν Z → W± ℓ′ ℓℓ
(W,Z) [rad]
φ
∆
0 1 2 3
Ratio to MATRIX 0.8 1 1.2
(d)
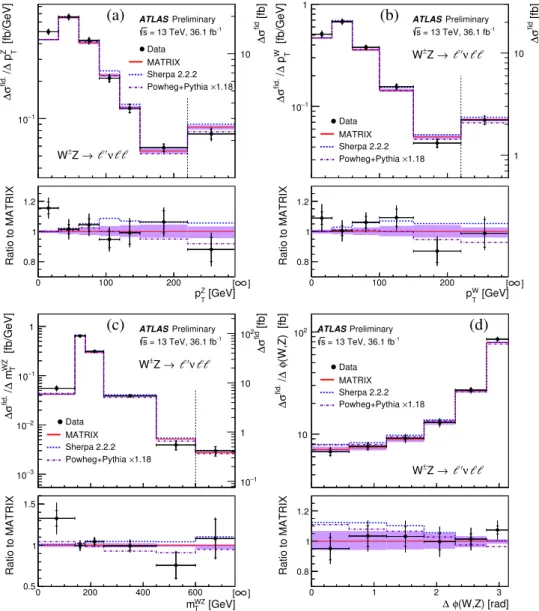
Figure 4: The measured W
±Z di ff erential cross section in the fiducial phase space as a function of p
TZ(a), p
WT(b), m
W ZT
(c) and ∆φ(W, Z ) (d). The inner and outer error bars on the data points represent the statistical and
total uncertainties, respectively. The measurements are compared to the NNLO prediction from MATRIX (red
line, see text for details). The violet band represents the QCD scale uncertainties of the NNLO predictions. The
predictions from the P owheg+ P ythia and S herpa MC generators are also indicated by dotted-dashed and dashed
lines, respectively. In (a), (b) and (c), the right y-axis refers to the last cross-section point, separated from the others
by a vertical dashed line, as this last bin is integrated up to the maximum value reached in the phase space.
The W
±Z production cross section is measured as a function of several variables: the transverse mo- mentum of the Z and W boson, p
TZand p
WT, the transverse mass of the W
±Z system m
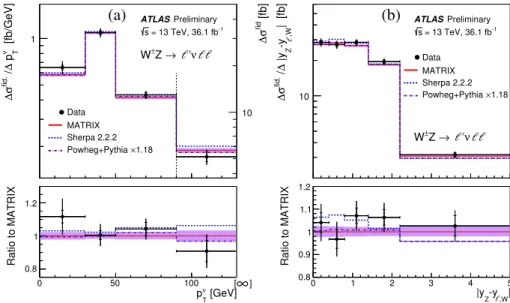
W ZTand the azimuthal angle between the W and Z bosons in Figure 4; as a function of the p
Tof the neutrino associ- ated with the decay of the W boson, p
νT, and the absolute di ff erence between the rapidities of the Z boson and the charged lepton from the decay of the W boson, | y
Z− y
`,W| in Figure 5.
In order to derive p
WTand p
νTfrom data events, the assumption is made that the whole E
Tmissof the events arises from the neutrino of the W boson decay. This assumption was verified to be valid for SM W Z events using MC samples.
[fb/GeV]ν T p∆ /fid.σ∆ 1
Data MATRIX Sherpa 2.2.2
1.18 Powheg+Pythia ×
ATLASPreliminary = 13 TeV, 36.1 fb-1
s
ν Z → W± ℓ′ ℓℓ
[fb]fidσ∆
10
[GeV]
ν
pT
0 50 100
Ratio to MATRIX
0.8 1 1.2
∞
[ ]
(a)
fid.| [fb]-y |y∆ /σ∆ ,WZ 10Data MATRIX Sherpa 2.2.2
1.18 Powheg+Pythia × ATLASPreliminary
= 13 TeV, 36.1 fb-1
s
ν Z → W± ℓ′ ℓℓ
ℓ
,W|
Z-y
|y
0 1 2 3 4 5
Ratio to MATRIX
0.8 0.9 1 1.1 1.2
ℓ
(b)
Figure 5: The measured W
±Z differential cross section in the fiducial phase space as a function of (a) p
νTand (b)
| y
Z−y
`,W|. The inner and outer error bars on the data points represent the statistical and total uncertainties, respect- ively. The measurements are compared to the NNLO prediction from MATRIX (red line, see text for details). The violet band represents the QCD scale uncertainties of NNLO predictions. The predictions from the P owheg+ P ythia and S herpa MC generators are also indicated by dotted-dashed and dashed lines, respectively. In (a), the right y-axis refers to the last cross-section point, separated from the others by a vertical dashed line, as this last bin is integrated up to the maximum value reached in the phase space.
The measured di ff erential cross sections in Figures 4 and 5 are compared to the predictions at NNLO in QCD from the MATRIX computational framework. The predictions from MATRIX are corrected from Born-level leptons to dressed leptons using binned correction factors determined using P owheg+ P ythia . The correction factors are found to be mostly constant over the ranges of all di ff erential distributions, with a mean value of 0.96. A good description of the measured cross sections is observed. The measurements are also compared to NLO MC predictions from P owheg+ P ythia , after a rescaling of its predicted integ- rated fiducial cross section to the NNLO cross section, and to S herpa 2.2.2 without rescaling its prediction.
A good agreement of the shapes of the measured distributions with the predictions of P owheg+ P ythia and S herpa 2.2.2 is observed. The ∆φ(W, Z ) distribution which is sensitive to QCD higher-order perturbative e ff ects is better described by MATRIX than P owheg+ P ythia or S herpa 2.2.2.
As shown in previous publications, the high energy tails of p
TZ[10] and m
W ZT[7] observables are sens-
itive to aTGC, p
TZhaving the disadvantage of being more subject to higher-order perturbative effects in
QCD [88] and EW theory [89]. This is seen also here with larger NNLO QCD scale uncertainties pre- dicted by MATRIX for p
TZthan for m
W ZT. No excess of data events in the tails of these distributions is observed.
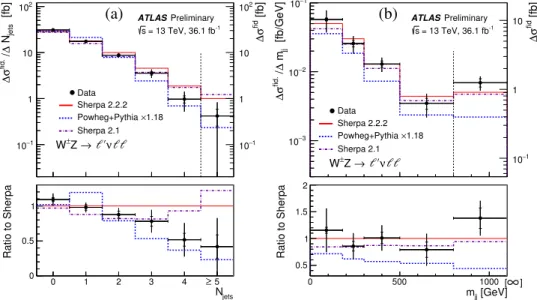
The exclusive multiplicity of jets with a p
Tthreshold of 25 GeV unfolded at particle level is presented in Figure 6(a). The measurements are compared with predictions from S herpa 2.2.2, S herpa 2.1 and P owheg+ P ythia . The S herpa predictions provide a better description of the ratio of 0-jet to 1-jet event cross sections than Powheg+Pythia. However the Sherpa 2.2.2 prediction tends to overestimate the cross section of events with two jets or more. Finally, the measured W
±Z differential cross section as a function of the invariant mass, m
j j, of the two leading jets with p
T> 25 GeV is presented in Figure 6(b). The measurement is better described by the Sherpa predictions.
[fb]jets N∆ /fid.σ∆
1
10−
1 10 102
Data Sherpa 2.2.2
1.18 Powheg+Pythia × Sherpa 2.1
ATLASPreliminary = 13 TeV, 36.1 fb-1
s
ν Z → W± ℓ′ ℓℓ
[fb]fidσ∆
1
10−
1 10 102
Njets
0 1 2 3 4 5
Ratio to Sherpa
0 0.5 1
≥
(a)
[fb/GeV]jj m∆ /fid.σ∆
3
10− 2
10− 1
10−
Data Sherpa 2.2.2
1.18 Powheg+Pythia × Sherpa 2.1
ATLASPreliminary = 13 TeV, 36.1 fb-1
s
ν Z → W± ℓ′ ℓℓ
[fb]fidσ∆
1
10−
1 10
[GeV]
mjj
0 500 1000
Ratio to Sherpa
0.5 1 1.5 2
[ ]