ATLAS-CONF-2012-128 11September2012
ATLAS NOTE
ATLAS-CONF-2012-128
September 11, 2012
Measurement of the inclusive jet cross section in pp collisions at
√ s = 2.76 TeV and comparison to the inclusive jet cross section at
√ s = 7 TeV using the ATLAS detector
The ATLAS Collaboration
Abstract
The inclusive jet cross section has been measured in proton-proton collisions at a centre- of-mass energy of
√s=
2.76 TeV using the ATLAS detector at the Large Hadron Collider at CERN. The measurement is performed using a dataset with a total integrated luminosity of 0.20 pb
−1collected in 2011. The anti-k
talgorithm is used to identify jets with two jet distance parameters,
R=0.4 and
R=0.6. The inclusive single-jet double-differential cross section is presented as a function of the jet transverse momentum
pTand rapidity
y, inthe range of 20
≤pT<430 GeV and
|y|<4.4. The ratio of the measured cross section is taken to the inclusive jet cross section measurement at
√s=
7 TeV published by the ATLAS collaboration. Due to the cancellation of correlated uncertainties in the two measurements, the systematic uncertainties are significantly reduced in the jet cross section ratio. Results are compared to predictions from next-to-leading order perturbative QCD, corrected for non- perturbative effects. The measured jet cross section and the published ATLAS jet cross section at
√s=
7 TeV are analysed together within a framework of next-to-leading order perturbative QCD.
c Copyright 2012 CERN for the benefit of the ATLAS Collaboration.
Reproduction of this article or parts of it is allowed as specified in the CC-BY-3.0 license.
1 Introduction
Collimated jets of hadrons are a dominant feature of high-energy particle interactions. In Quantum Chromodynamics (QCD) they can be interpreted in terms of the fragmentation of quarks and gluons produced in a hard scattering process. The inclusive jet production cross section provides information on the strong coupling and the structure of the proton and can test the validity of perturbative QCD (pQCD) down to the shortest accessible distances.
The inclusive jet cross section has been measured in electron-proton collisions at HERA with a centre-of-mass energy of
√s
=300 GeV and
√s
=319 GeV [1–8], in proton-antiproton ( pp) collisions with
√s
=546 GeV and
√s
=630 GeV at the SPS [9–12], and with
√s
=546 GeV,
√s
=630 GeV,
√
s
=1.8 TeV and
√s
=1.96 TeV at the Tevatron [13–28].
The Large Hadron Collider (LHC) at CERN allows the production of jets with transverse momenta in the TeV regime, colliding protons on protons (pp) with a centre-of-mass energy of
√s
=7 or 8 TeV.
The ATLAS collaboration presented early measurements of the inclusive jet cross section at
√s
=7 TeV based on a dataset with an integrated luminosity of 17 nb
−1for jets with a transverse momentum of 60
≤p
T<600 GeV and a rapidity of
|y
|<2.8 [29], and for the entire dataset of 37 pb
−1taken in 2010 for jets with 20
≤p
T<1500 GeV and
|y
|<4.4 [30]. The CMS collaboration presented results in the kinematic range of 18
≤p
T<1100 GeV and
|y
|<3 in a datasets of 34 pb
−1[31], and 35
≤p
T<150 GeV and 3.2
<|y
|<4.7 using 3.1 pb
−1[32]. These data are found to be generally well described by next-to- leading order (NLO) pQCD calculations corrected for non-perturbative effects.
At the start of the 2011 data taking period of the LHC, the ATLAS experiment collected pp colli- sion data at
√s
=2.76 TeV corresponding to an integrated luminosity of 0.20 pb
−1. This dataset allows measurements close to the maximum
√s reached in pp collisions. Moreover, measurements with the same detector at different center-of-mass energies provide stringent tests of the theory, since the dom- inant systematic uncertainties are correlated. These correlations can be explored in a common fit to the measurements at different
√s or by taking ratios of the double-differential cross sections, which can significantly reduce the uncertainty. Such ratios were reported by previous experiments, UA2 [10], UA1 [11], CDF [14] and D0 [18].
In this note the double-differential inclusive jet cross section is measured for 20
≤p
T<430 GeV and rapidities of
|y
|<4.4 at
√s
=2.76 TeV. Moreover, the cross section ratio to the previously measured data at
√s
=7 TeV [30] is determined as a function of p
Tas well as a function of the dimensionless quantity x
T=2p
T/√s [33]. For the ratio as a function of p
T, many experimental systematic uncertainties cancel, while for the ratio measured as a function of x
Ttheoretical uncertainties are reduced. This allows for a precise test of NLO pQCD calculations.
The outline of the note is as follows. The definition of jet cross section is given in the next section, followed by a brief description of the ATLAS detector (Section 3) and the dataset (Section 4). The Monte Carlo simulation, the theoretical predictions and the uncertainties on the predictions are described in Sections 5, 6, followed by the event selection (Section 7) and the jet reconstruction and calibration (Section 8). The unfolding for detector effects and the systematic uncertainties are discussed in Sections 9 and 10, followed by the results of the inclusive jet cross section at
√s
=2.76 TeV in Section 11. The results of the ratio measurement, including the discussion of its uncertainties, are presented in Section 12.
In Section 13 the results of an NLO pQCD fit to these data are discussed. The conclusion is given in
Section 14.
2 Definition of the measured variables
2.1 Inclusive single-jet cross section
Jets are identified using the anti-k
talgorithm [34] implemented in the F
ASTJ
ET[35,36] software package.
Two different values of the distance parameter, R
=0.4 and R
=0.6, are used. Inputs to the jet algorithm can be partons in the NLO pQCD calculation, stable particles after the hadronisation process in the Monte Carlo simulation or energy deposits in the calorimeter in data.
Throughout this note, the jet cross section refers to the cross section of jets built from stable particles, defined by having a proper lifetime of cτ
>10 mm. Muons and neutrinos from decaying hadrons are included in this definition.
The double-differential inclusive single-jet cross section,
d pd2σTdy
, is measured as a function of the jet transverse momentum p
Tin bins of rapidity y. The kinematic range of the measurement is 20
≤p
T<430 GeV and
|y
|<4.4.
The jet cross section is also measured as a function of the dimensionless quantity x
T. For a pure 2
→2 central scattering of the partons, x
Tgives the momentum fraction of the initial state partons with respect to the proton beam.
2.2 Ratio of jet cross sections at different centre-of-mass energies
The double-differential inclusive jet cross section can be related to the invariant cross section according to
E d
3σd p
3 =1
2π p
Td
2σd p
Tdy
.(1)
The dimensionless scale-invariant cross section F
(y,x
T)can be defined as [37]:
F
(y,x
T) =p
4TE d
3σd p
3 =p
3T2π d
2σd p
Tdy
=s
8π x
3Td
2σdx
Tdy
.(2)
In the simple quark parton model, F(y,x
T)does not depend on the centre-of-mass energy as follows from dimensional analysis. In QCD, however, effects lead to a violation of the
√s scaling. The main effects are the scale dependence of the parton distribution functions (PDFs) and the strong coupling constant
αs. The cross section ratio,
ρ(y,x
T), of the invariant jet cross section measured at √s
=2.76 TeV to the one measured at
√s
=7 TeV is then denoted as:
ρ(y,xT) =
F(y,x
T)√s=2.76 TeVF
(y,x
T)√s=7 TeV =2.76 TeV 7 TeV
3
·σ(y,
p
T=2.76 TeV
·x
T/2)σ(y,
p
T=7 TeV
·x
T/2) ,(3) where
σ(y,p
T)is
d pd2σTdy
in a bin
(y,p
T). It is extracted as a function ofx
Tby measuring the inclusive jet cross sections at the two centre-of-mass energies in the same x
Tranges. Therefore, the p
Tbinning for the inclusive jet cross section at
√s
=2.76 TeV is chosen such that it corresponds to the same x
Tranges obtained from the p
Tbins of the jet cross section measurement at
√s
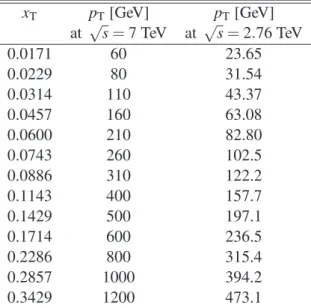
=7 TeV. The bin boundaries are listed in Table 1.
The ratio of double-differential inclusive cross sections is also measured as a function of p
T, where the same p
Tbinning is used for both centre-of-mass energies. The cross section measured at
√s
=2.76 TeV is divided by the one measured at
√s
=7 TeV in each
(y,p
T)bin. This ratio is denoted as
ρ(y,p
T).Since the uncertainty due to the jet energy scale is the dominant experimental uncertainty at a given p
T,
the experimental systematic uncertainty is significantly reduced by taking the cross section ratio in the
same p
Tbins.
Table 1: Bin boundaries in the variable x
Tused in the extraction of
ρ(y,xT), the cross section ratio as afunction of x
Tat different centre-of-mass energies. Also shown are the corresponding jet p
Tvalues at each centre-of-mass energy.
x
Tp
T[GeV] p
T[GeV]
at
√s
=7 TeV at
√s
=2.76 TeV
0.0171 60 23.65
0.0229 80 31.54
0.0314 110 43.37
0.0457 160 63.08
0.0600 210 82.80
0.0743 260 102.5
0.0886 310 122.2
0.1143 400 157.7
0.1429 500 197.1
0.1714 600 236.5
0.2286 800 315.4
0.2857 1000 394.2
0.3429 1200 473.1
3 The ATLAS detector
The ATLAS detector consists of a tracking system (Inner Detector) in a 2 T solenoidal magnetic field up to a pseudorapidity
1|η|=2.5, sampling electromagnetic and hadronic calorimeters up to
|η|=4.9, and muon chambers in a toroidal magnetic field. A detailed description of the ATLAS experiment can be found elsewhere [38].
The Inner Detector consists of layers of silicon pixel detectors, silicon microstrip detectors and tran- sition radiation tracking detectors. It is used in this analysis to identify candidate collision events by con- structing vertices from tracks. Jets are reconstructed using the energy deposits in the ATLAS calorimeter, whose granularity and material varies as a function of
η. The electromagnetic calorimeters consist of thehigh granularity liquid argon (LAr) sampling calorimeters using lead as an absorber. It is composed of a barrel (
|η|<1.475) and an end-cap (1.375
<|η|<3.2) region. The hadronic calorimeter is divided into three distinct regions: the barrel region (
|η|<0.8) and the extended barrel region (0.8
<|η|<1.7) instrumented with a tile scintillator/steel calorimeter; the hadronic end-cap region (1.5
<|η|<3.2) using LAr/copper calorimeter modules, and finally the forward calorimeter region (3.1
<|η|<4.9) in- strumented with LAr/copper and LAr/tungsten modules to provide electromagnetic and hadronic energy measurements, respectively.
The ATLAS trigger system is composed of three consecutive levels: level 1, level 2 and event filter, each with increasing budget of computing time, access to higher granularity and a number of considered detector systems. For jet triggering, the relevant systems are the minimum bias trigger scintillators (MBTS), located in front of the end-cap cryostats, as well as calorimeter triggers for central jets, covering
|η|<
3.2, and for forward jets, covering 3.1
<|η|<4.9, respectively.
1The ATLAS Coordinate System is a right-handed system with thex-axis pointing to the centre of the LHC ring, thez-axis η
4 Data taking
The proton-proton collision data at
√s
=2.76 TeV were collected at the start of the 2011 data taking period of the LHC. The total integrated luminosity of the collected data is 0.20 pb
−1. The proton bunches were grouped in 9 bunch trains. The time interval between two consecutive bunches was 525 ns. The average number of interactions per bunch crossing is found to be
µ =0.24. Only events with good operational status of the relevant detector components for jet measurements are considered in this mea- surement.
5 Monte Carlo simulation
Events used in the simulation of the detector response are generated by the P
YTHIA6.423 generator [39], using the MRST 2007 LO* PDFs [40]. The generator utilises leading-order (LO) pQCD matrix elements for 2
→2 processes, along with a leading-logarithmic p
T-ordered parton shower [41], an underlying event simulation with multiple parton interactions [42], and the Lund string model for hadronisation [43].
The event generation uses the ATLAS Minimum Bias Tune 1 (AMBT1) set of parameters [44].
Additional proton-proton collisions occurring in the same bunch crossing are generated using mini- mum bias events from P
YTHIA. These events are mixed with the jet signal events according to a Poisson distribution with
hn
MBi=0.4, where
hn
MBiis the averaged number of added events. Although
hn
MBiis slightly higher than
µin data (see Section 4), no significant impact with respect to data is expected on the Monte Carlo simulation.
The H
ERWIG++ 2.5.1 [45, 46] generator is used in addition to P
YTHIAin the evaluation of non- perturbative effects. It is based on the 2
→2 LO pQCD matrix elements and leading-logarithmic angular- ordered parton showers [47]. The cluster model [48] is used to model the hadronisation and an underlying event simulation is based on the eikonal model [49].
The G
EANTsoftware toolkit [50] within the ATLAS simulation framework [51] simulates the prop- agation of the generated particles through the ATLAS detector and their interactions with the detector material.
6 Theoretical predictions
6.1 NLO pQCD prediction
The NLO pQCD predictions are calculated using the NLOJET++ 4.1.2 [52] program. For fast and flexible calculations with various PDFs and factorisation and renormalisation scales, the APPL
GRIDsoftware [53] is interfaced with NLOJET++. The renormalisation scale,
µR, and the factorisation scale,
µF, are chosen for each event as
µR =µF =p
maxT (yi), wherep
maxT (yi)is the maximum jet transverse momentum found in a rapidity bin y
i. If jets are present in different rapidity bins, several scales within the event are used.
The default calculation uses the CT10 [54] PDF set. The predictions using the PDF sets MSTW 2008 [55], NNPDF 2.1 (100) [56, 57] and HERAPDF 1.5 [58] are also calculated for comparison. The value for
αsis taken from the corresponding PDF set.
Three sources of uncertainty on the NLO pQCD calculation are considered, namely the uncertainty
on the PDF sets, the choice of factorisation and renormalisation scales and the uncertainty of the value
of the strong coupling,
αs. The PDF uncertainty is defined at 68% confidence level (CL) and evaluated
following the prescriptions given for each PDF set. The uncertainty of the scale choice is evaluated by
varying the renormalisation scale and the factorisation scale by a factor of two with respect to the original
choice in the calculation. The considered variations are
(
f
µR,f
µF) = (0.5,1),
(2,1),(1,0.5), (1,2),
(0.5,0.5),(2,2),(4) where f
µRand f
µFare factors for the variation of renormalisation and factorisation scales, hence
µR=f
µR·p
maxTand
µF =f
µF·p
maxT. The envelope of the resulting variations is taken as the scale uncertainty.
The uncertainty reflecting the
αsmeasurement precision is evaluated following the recommendation of the CTEQ group [59], by calculating the cross section using series of PDFs which are derived with various fixed
αsvalues. Electroweak corrections are not included in the theory predictions and may be non-negligible [60].
The theoretical predictions for the cross section ratios at the two different energies,
ρ(y,xT)or
ρ(y,p
T), are also obtained from the NLO pQCD calculations. The evaluation of the prediction at√s
=7 TeV is given in [30], and the procedure is identical to the one used for
√s
=2.76 TeV in the present anal- ysis. Hence, the uncertainty for the ratio is determined using the same variation in each component of the considered uncertainties simultaneously for both
√s
=2.76 TeV and
√s
=7 TeV cross section predictions.
6.2 Predictions from NLO matrix elements with parton shower Monte Carlo
The measured jet cross section is also compared to predictions from P
OWHEG[61], an NLO generator.
P
OWHEGuses the P
OWHEGBOX package [62–64], which can be interfaced to either P
YTHIAor H
ER-
WIG
[65]+J
IMMY[66] to shower partons, hadronise them, and model the underlying event. The ATLAS underlying event tunes, AUET2B [67] for P
YTHIAand AUET2 [68] for H
ERWIG, are used, as well as Perugia 2011 for P
YTHIA. The tunes are derived from the standalone versions of these event generators, with no optimisation for the P
OWHEGpredictions. The showering portion of P
OWHEGuses the PDFs from P
YTHIAor H
ERWIGas part of the specific tune chosen.
In the P
OWHEGalgorithm, each event is built by first producing a QCD 2
→2 partonic scattering.
The renormalisation and factorisation scales are set to be equal to the transverse momentum of the out- going partons, p
BornT, before proceeding to generate the hardest partonic emission in the event. The CT10 NLO PDF set is used in this step of simulation. Then the event is evolved to the hadron level using a parton shower event generator, where the radiative emissions in the parton showers are required to be softer than the hardest partonic emission generated by P
OWHEG.
The coherent simulation of the parton showering, hadronisation, and the underlying event with the NLO matrix element is expected to produce a more accurate theoretical prediction. However, ambiguities in the matching procedure and non-optimal tuning of P
YTHIAand H
ERWIGshowering parameters may introduce additional theoretical uncertainties.
6.3 Non-perturbative corrections
The fixed-order NLO pQCD calculations, described in Section 6.1, predict the parton-level cross section,
which must be corrected for non-perturbative effects to be comparable with the measurement at parti-
cle level. The corrections are derived by using LO Monte Carlo event generators complemented with
leading-logarithmic parton shower by evaluating the bin-wise ratio of the cross section with and without
hadronisation and the underlying event. Each bin of the NLO pQCD cross section is then multiplied
by the corresponding correction to non-perturbative effects. The baseline correction factors are obtained
from P
YTHIA6.425 [39] with the AUET2B CTEQ6L1 tune [67]. The uncertainty is estimated as the en-
velope of the correction factors obtained from a series of different generators and tunes: P
YTHIA6.425
using the tunes AUET2B LO** [67], AUET2 LO** [69], AMBT2B CTEQ6L1 [67], AMBT1 [70], P
E-
with tune UE7000-2 [67]. The AMBT2B CTEQ6L1 and AMBT1 tunes, which are based on observables sensitive to the modelling of minimum bias interactions, are included to provide a systematically different estimate of the underlying event activity.
The NLO pQCD prediction for the cross section ratio also needs corrections for non-perturbative effects. The same procedure is used to evaluate non-perturbative corrections for the cross section at
√
s
=7 TeV using the same series of generator tunes. A ratio of corrections at
√s
=2.76 TeV and
√
s
=7 TeV is calculated for each generator tune. As for the cross section, P
YTHIA6.425 with the AUET2B CTEQ6L1 tune is used as the central value of the correction factor for the cross section ratio and the envelope of the correction factors from the other tunes is taken as uncertainty.
6.4 Prediction for the inclusive jet cross section at √
s = 2.76 TeV
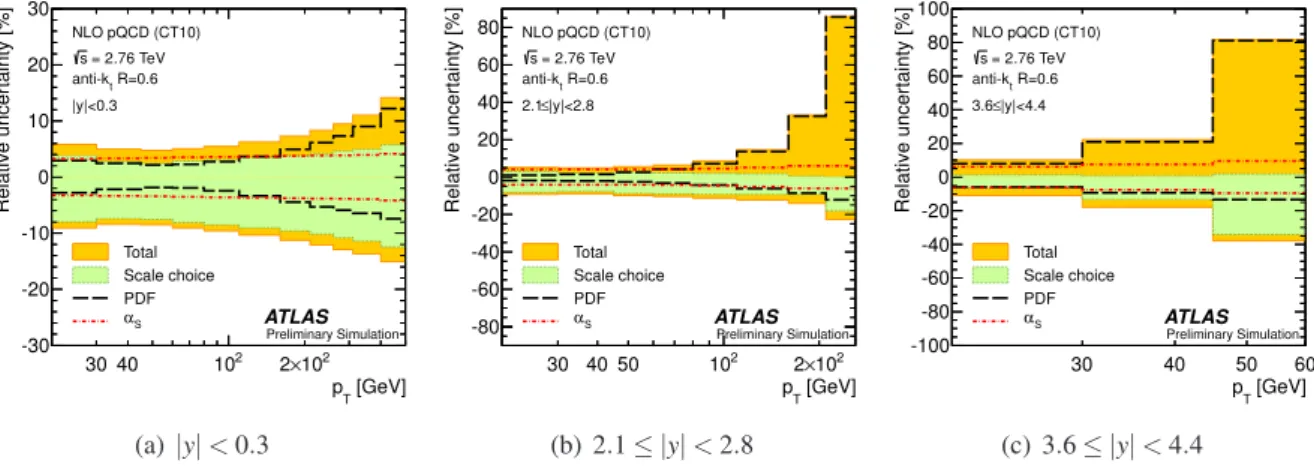
The evaluated relative uncertainties of the NLO pQCD calculation for the inclusive jet cross section at
√
s
=2.76 TeV are shown in Figure 1 as a function of the jet p
Tfor representative rapidity bins. In the central rapidity region, the uncertainties are about 5% for p
T.100 GeV, increasing to about 15% at the highest jet p
T. In the most forward region, they are 15% at the lowest p
Tbin and up to 80% at the highest p
Tbin. In the higher p
Tregion, the upper bound of the uncertainty is driven by the PDF uncertainty, while the lower bound and the uncertainty at low p
Tare dominated by the scale choice.
[GeV]
pT
30 40 102 2×10²
Relative uncertainty [%]
-30 -20 -10 0 10 20 30
ATLAS Total
Scale choice PDF
αS
NLO pQCD (CT10)
= 2.76 TeV s
R=0.6 anti-kt
|y|<0.3
Preliminary Simulation
(a)|y|<0.3
[GeV]
pT
30 40 50 102 2×10²
Relative uncertainty [%]
-80 -60 -40 -20 0 20 40 60 80
ATLAS Total
Scale choice PDF
αS
NLO pQCD (CT10)
= 2.76 TeV s
R=0.6 anti-kt
|y|<2.8
≤ 2.1
Preliminary Simulation
(b) 2.1≤ |y|<2.8
[GeV]
pT
30 40 50 60
Relative uncertainty [%]
-100 -80 -60 -40 -20 0 20 40 60 80 100
ATLAS Total
Scale choice PDF
αS
NLO pQCD (CT10)
= 2.76 TeV s
R=0.6 anti-kt
|y|<4.4
≤ 3.6
Preliminary Simulation
(c) 3.6≤ |y|<4.4
Figure 1: The uncertainty on the NLO pQCD prediction of the inclusive jet cross section at
√s
=2.76 TeV, calculated using NLOJET++ with the CT10 PDF set, for anti-k
tjets with R
=0.6 shown in three representative rapidity bins as a function of the jet p
T. In addition to the total uncertainty, the uncertainties from the scale choice, the PDF set and the strong coupling constant,
αS, are shown separately.
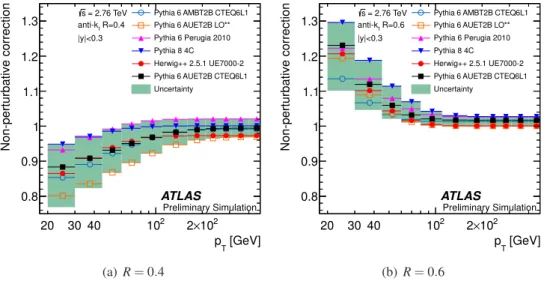
The correction factors for non-perturbative effects and their uncertainties are shown in Figure 2 for the inclusive jet cross section at
√s
=2.76 TeV in the central rapidity bin. For jets with R
=0.4, the correction is about
−10% at the lowest p
Tbin, while for jets with R
=0.6, it is about
+20% as a resultof the interplay of the hadronisation and the underlying event for the different jet sizes. In the high p
Tregion, the corrections are almost unity for the both jet distance parameters, and the uncertainty is on the level of
±2%.
6.5 Predictions for the cross section ratio
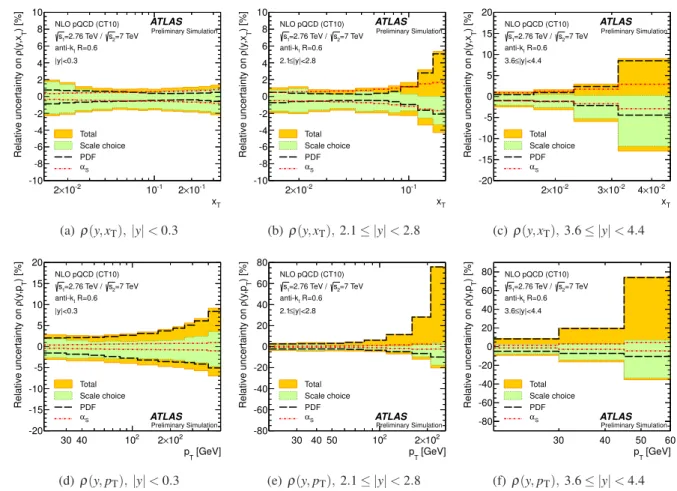
Figure 3(a)-(c) shows the uncertainty of the NLO pQCD calculation of
ρ(y,xT)in representative rapidity
bins. They are significantly reduced, compared to the uncertainties of the cross sections, to a level of
[GeV]
pT
20 30 40 102 2×10²
Non-perturbative correction
0.8 0.9 1 1.1 1.2 1.3
ATLAS
Preliminary Simulation Pythia 6 AMBT2B CTEQ6L1 Pythia 6 AUET2B LO**
Pythia 6 Perugia 2010 Pythia 8 4C Herwig++ 2.5.1 UE7000-2 Pythia 6 AUET2B CTEQ6L1 Uncertainty
= 2.76 TeV s
R=0.4 anti-kt
|y|<0.3
(a)R=0.4
[GeV]
pT
20 30 40 102 2×10²
Non-perturbative correction
0.8 0.9 1 1.1 1.2 1.3
ATLAS
Preliminary Simulation Pythia 6 AMBT2B CTEQ6L1 Pythia 6 AUET2B LO**
Pythia 6 Perugia 2010 Pythia 8 4C Herwig++ 2.5.1 UE7000-2 Pythia 6 AUET2B CTEQ6L1 Uncertainty
= 2.76 TeV s
R=0.6 anti-kt
|y|<0.3
(b)R=0.6
Figure 2: Non-perturbative correction factors for the inclusive jets cross section for anti-k
tjets with R
=0.4 (a) and R
=0.6 (b) in the jet rapidity
|y
|<0.3 as a function of the jet p
Tfor Monte Carlo simulations
with various tunes. The correction factor derived from P
YTHIA6 with the AUET2B CTEQ6L1 tune (full-
square) is used as the correction factors for the NLO prediction in this measurement, with the uncertainty
indicated by the shaded area.
a few percent in the central rapidity region. The dominant uncertainty is the uncertainty on the renor- malisation and factorisation scale choice. The NLO pQCD calculation of
ρ(y,p
T)has an uncertainty of below
±5% for p
Tup to 200 GeV in the central rapidity region, as shown in Figure 3(d). The uncertainty increases for higher jet p
Tmostly due to the uncertainties on the PDFs, which are below 10% for central jets. In the forward region, it reaches up to 80% in the highest p
Tbins, as shown in the Figures 3(e),(f).
xT
10-2
×
2 10-1 2×10⁻¹
) [%] T(y,xρRelative uncertainty on
-10 -8 -6 -4 -2 0 2 4 6 8 10
ATLAS
Total Scale choice PDF
αS
NLO pQCD (CT10)
=7 TeV s2
=2.76 TeV / s1
R=0.6 anti-kt
|y|<0.3
Preliminary Simulation
(a)ρ(y,xT),|y|<0.3
xT
10-2
×
2 10-1
) [%] T(y,xρRelative uncertainty on
-10 -8 -6 -4 -2 0 2 4 6 8 10
ATLAS
Total Scale choice PDF
αS
NLO pQCD (CT10)
=7 TeV s2
=2.76 TeV / s1
R=0.6 anti-kt
|y|<2.8
≤ 2.1
Preliminary Simulation
(b)ρ(y,xT),2.1≤ |y|<2.8
xT
10-2
×
2 3×10⁻² 4×10⁻²
) [%]T(y,xρRelative uncertainty on
-20 -15 -10 -5 0 5 10 15 20
ATLAS
Total Scale choice PDF
αS
NLO pQCD (CT10)
=7 TeV s2
=2.76 TeV / s1
R=0.6 anti-kt
|y|<4.4
≤ 3.6
Preliminary Simulation
(c)ρ(y,xT),3.6≤ |y|<4.4
[GeV]
pT
30 40 102 2×10²
) [%] T(y,pρRelative uncertainty on
-20 -15 -10 -5 0 5 10 15 20
ATLAS Total
Scale choice PDF
αS
NLO pQCD (CT10)
=7 TeV s2
=2.76 TeV / s1
R=0.6 anti-kt
|y|<0.3
Preliminary Simulation
(d)ρ(y,pT),|y|<0.3
[GeV]
pT
30 40 50 102 2×10²
) [%] T(y,pρRelative uncertainty on
-80 -60 -40 -20 0 20 40 60 80
ATLAS Total
Scale choice PDF
αS
NLO pQCD (CT10)
=7 TeV s2
=2.76 TeV / s1
R=0.6 anti-kt
|y|<2.8
≤ 2.1
Preliminary Simulation
(e)ρ(y,pT),2.1≤ |y|<2.8
[GeV]
pT
30 40 50 60
) [%]T(y,pρRelative uncertainty on
-80 -60 -40 -20 0 20 40 60 80
ATLAS Total
Scale choice PDF
αS
NLO pQCD (CT10)
=7 TeV s2
=2.76 TeV / s1
R=0.6 anti-kt
|y|<4.4
≤ 3.6
Preliminary Simulation
(f) ρ(y,pT),3.6≤ |y|<4.4
Figure 3: The uncertainty on the NLO pQCD prediction of the cross section ratio
ρ(y,xT)((a)-(c)) and
ρ(y,p
T)((d)-(f)), calculated using NLOJET++ with the CT10 PDF set, for anti-k
tjets with R
=0.6 shown in three representative rapidity bins as a function of the jet x
Tand of the jet p
T, respectively.
In addition to the total uncertainty, the uncertainties from the scale choice, the PDF set and the strong coupling constant,
αS, are shown separately.
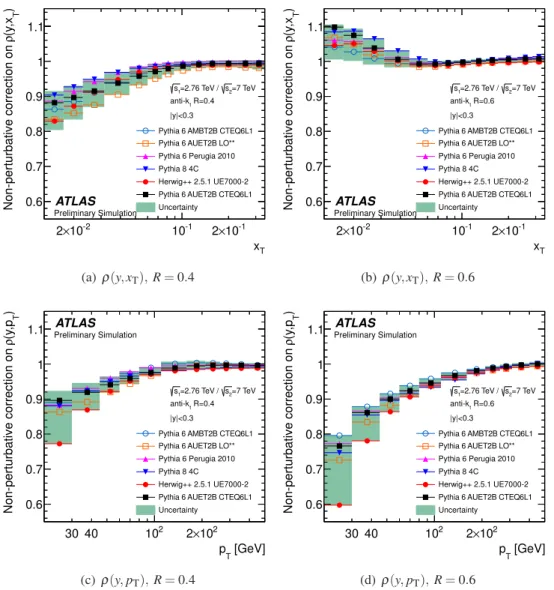
Non-perturbative corrections on
ρ(y,xT)show different x
Tdependence for jets with R
=0.4 and R
=0.6, as shown in Figure 4(a) and 4(b). Since p
7 TeVT =7/2.76
·p
2.76 TeVTin the same x
Tbins (Table 1), and since the non-perturbative correction is almost flat in the high p
Tregion, the behaviour of
ρ(y,xT)is driven by the corrections for the cross section at
√s
=2.76 TeV. For jets with R
=0.4, the correction is
−10% in the lowest x
Tbin. For R
=0.6, the correction in this region has the opposite direction, increasing the prediction by
+10%. The uncertainty in the lowestx
Tbin for both distance parameters is
∼ ±
10%. The non-perturbative corrections on
ρ(y,p
T)are shown in Figure 4(c) and (d). They amount to
−10% for jets with R
=0.4 and
−25% for jets with R
=0.6 in the lowest p
Tbins. This is due to the larger correction factors for the NLO pQCD prediction at
√s
=7 TeV [30] with respect to
√s
=2.76
TeV. Corrections obtained from P
YTHIAwith various tunes are in general within 5% for central jets,
while the non-perturbative corrections from H
ERWIG++ deviate from the ones of the P
YTHIAtunes by
more than 10% in the lowest p
Tbin.
xT
10-2
×
2 10-1 2×10⁻¹
) T(y,xρNon-perturbative correction on 0.6
0.7 0.8 0.9 1 1.1
ATLAS
Preliminary Simulation
Pythia 6 AMBT2B CTEQ6L1 Pythia 6 AUET2B LO**
Pythia 6 Perugia 2010 Pythia 8 4C Herwig++ 2.5.1 UE7000-2 Pythia 6 AUET2B CTEQ6L1 Uncertainty
=7 TeV s2
=2.76 TeV / s1
R=0.4 anti-kt
|y|<0.3
(a)ρ(y,xT),R=0.4
xT
10-2
×
2 10-1 2×10⁻¹
) T(y,xρNon-perturbative correction on 0.6
0.7 0.8 0.9 1 1.1
ATLAS
Preliminary Simulation
Pythia 6 AMBT2B CTEQ6L1 Pythia 6 AUET2B LO**
Pythia 6 Perugia 2010 Pythia 8 4C Herwig++ 2.5.1 UE7000-2 Pythia 6 AUET2B CTEQ6L1 Uncertainty
=7 TeV s2
=2.76 TeV / s1
R=0.6 anti-kt
|y|<0.3
(b)ρ(y,xT),R=0.6
[GeV]
pT
30 40 102 2×10² ) T(y,pρNon-perturbative correction on 0.6
0.7 0.8 0.9 1
1.1 ATLAS
Preliminary Simulation
Pythia 6 AMBT2B CTEQ6L1 Pythia 6 AUET2B LO**
Pythia 6 Perugia 2010 Pythia 8 4C Herwig++ 2.5.1 UE7000-2 Pythia 6 AUET2B CTEQ6L1 Uncertainty
=7 TeV s2
=2.76 TeV / s1
R=0.4 anti-kt
|y|<0.3
(c)ρ(y,pT),R=0.4
[GeV]
pT
30 40 102 2×10² ) T(y,pρNon-perturbative correction on 0.6
0.7 0.8 0.9 1
1.1 ATLAS
Preliminary Simulation
Pythia 6 AMBT2B CTEQ6L1 Pythia 6 AUET2B LO**
Pythia 6 Perugia 2010 Pythia 8 4C Herwig++ 2.5.1 UE7000-2 Pythia 6 AUET2B CTEQ6L1 Uncertainty
=7 TeV s2
=2.76 TeV / s1
R=0.6 anti-kt
|y|<0.3
(d)ρ(y,pT),R=0.6
Figure 4: Non-perturbative correction factors for the cross section ratios,
ρ(y,x
T)and
ρ(y,p
T), for anti-k
tjets with R
=0.4 or R
=0.6 shown for a jet rapidity of
|y
|<0.3 for Monte Carlo simulations with various tunes as a function of the jet x
Tand of the jet p
T, respectively. The correction factor derived from P
YTHIA6 with the AUET2B CTEQ6L1 tune (full-square) is used as the correction factors for the NLO prediction in this measurement, with the uncertainty indicated by the shaded area.
7 Event selection
Events are selected online using various trigger definitions according to the p
Tand the rapidity y of the
jets [73]. In the lowest p
Tregion (p
T<35 GeV for
|y
|<2.1, p
T<30 GeV for 2.1
≤ |y
|<2.8, p
T<28
GeV for 2.8
≤ |y
|<3.6 and p
T<26 GeV for 3.6
≤ |y
|<4.4), a trigger requiring two hits in the MBTS
is used. For the higher p
Tregion, jet-based triggers are used, which select events that contain a jet with
sufficient transverse energy at the electromagnetic scale
2. Only triggers that are
>99% efficient for a given jet p
Tvalue are used. In the region 2.8
<|y
|<3.6, both a central and a forward jet trigger are used in combination to reach an efficiency of
>99%. Events are required to have at least one well reconstructed event vertex, required in turn to have at least three associated tracks.
8 Jet reconstruction and calibration
The reconstruction procedure and the calibration factors for the jet cross section measurement at
√s
=2.76 TeV are the same as those used for the measurement at
√s
=7 TeV with 2010 data [30] with few exceptions explicitly specified below.
Jets are reconstructed with the anti-k
talgorithm using topological clusters [74,75] of energy deposits in the calorimeters, calibrated at the electromagnetic scale, as input objects. The four momentum of the reconstructed jets are corrected event by event using the actual vertex position. A jet energy scale (JES) correction is then applied to correct for detector effects such as energy loss in dead material in front of or in between the calorimeters and to compensate for the lower calorimeter response to hadrons than to electrons or photons [74, 75]. Due to the low number of interactions per bunch crossing, the offset correction accounting for additional energy from pile-up effects is not applied in this measurement.
The estimation of the uncertainty on the jet energy measurement uses single-hadron calorimeter response measurements [76] and systematic Monte Carlo simulation variations. An uncertainty of about 2.5% in the central calorimeter region over a wide momentum range of 60
.p
T<800 GeV is obtained [75]. For jets with lower p
Tand for forward jets the uncertainties are larger.
All reconstructed jets with p
T>20 GeV and
|y
|<4.4 and a positive decision from the trigger that is used in the corresponding jet kinematic region are considered in this analysis. Jets are furthermore required to pass jet quality selections to reject fake jets reconstructed from non-collision signals, such as beam-related background, cosmic rays or detector noise. The applied selections were established with the
√s
=7 TeV data in 2010 [30, 75] and are validated in the
√s
=2.76 TeV data by studying distributions of the selection variables with similar techniques as in Ref. [75]. The rate of fake jets after the jet selection is negligible.
The efficiency of the jet selections was measured using a tag-and-probe method [75]. The largest inefficiency was found to be below 4% for jets with p
T=20 GeV. The measured efficiency is in good agreement with the efficiency previously measured for
√s
=7 TeV data in 2010 at the agreement level of 0.5%. Because of the larger event statistics in the 2010 data at
√s
=7 TeV, the jet selection efficiency from the 2010 data is taken.
The data are tested using the expected invariance of the jet cross section as a function of
φ, continuity as a function of
ηand p
T, and stability of the jet yield over time. No statistically significant problems are detected. The basic kinematic variables are described by the Monte Carlo simulation within the systematic uncertainties.
9 Unfolding for detector effects
Corrections for the detector inefficiencies and resolutions are performed to extract the particle-level cross section, based on a transfer matrix that relates the particle-level and the reconstruction-level jet p
T. The Iterative, Dynamically Stabilised (IDS) unfolding method [77] is performed separately for each rapidity
2The electromagnetic scale is the basic calorimeter signal scale for the ATLAS calorimeters. It has been established using test-beam measurements for electrons and muons to give the correct response for the energy deposited in electromagnetic showers, while it does not correct for the lower response of the calorimeter to hadrons.
bin, since migrations across p
Tare significant. The migrations across rapidity bins, which are much smaller, are taken into account using the bin-by-bin unfolding.
The Monte Carlo simulation to derive the transfer matrix is described in Section 5. The Monte Carlo samples are reweighted on a jet-by-jet basis as a function of jet p
Tand rapidity obtained from the ratio of calculated cross sections using the MSTW 2008 NLO PDF set [55] with respect to the MRST 2007 LO* PDF set [40]. This improves the description of the jet p
Tdistribution in data. Additionally, a jet selection similar to the jet quality criteria in data is applied to simulated low p
Tjets in Monte Carlo at
|η| ∼
1.
The transfer matrix for the jet p
Tis derived by matching a particle-level jet to a reconstructed jet based on a geometrical criteria, in which a particle-level jet and a reconstructed jet should be closest to each other within a radius of R
′=0.3 in the
(η,φ)-plane. The spectra of unmatched particle-level andreconstructed jets are used to provide the matching efficiencies, obtained from the p
Tspectrum of the matched jets divided by the one of all jets including unmatched jets, both for particle level jets,
εpart, and for reconstructed jets,
εreco.
The data are unfolded to particle level using a three step procedure, namely, correction for match- ing inefficiency at reconstructed level, unfolding for detector effects and then correction for matching inefficiency at particle level. The final results is given by the equation:
N
ipart=∑
j
N
recoj ·εrecojA
i j /εipart,(5) where i and j are the particle-level and reconstructed bin indices, respectively, N
kpartand N
krecoare the number of particle-level jets and the number of reconstructed jets in bin k, and A
i jis an unfolding matrix, which is determined using the IDS method. The number of iterations is chosen such that the bias in the closure test (see below) is small and at most at the percent level. In this measurement, it is achieved after one iteration.
The precision of the unfolding technique has been studied using a data-driven closure test [77].
In this study the particle-level spectrum in the Monte Carlo simulation is reweighted and convolved through the folding matrix, which gives the probability for a particle-level jet with a certain particle-level p
Tto have a given reconstructed-level p
T. The weights are chosen such that a significantly improved agreement between the resulting reconstructed spectrum and data is attained. The reconstructed spectrum in this reweighted Monte Carlo simulation is then unfolded using the same procedure as for the data.
Comparison of the spectrum obtained from the unfolding with the original reweighted particle-level spectrum provides an estimation of the bias, which is interpreted as the systematic uncertainty.
As an estimation of further systematic uncertainties, the unfolding procedure is repeated using dif- ferent transfer matrices created with tighter and looser matching criteria of R
′=0.2 and R
′=0.4. The deviations of the results from the nominal unfolding result are considered as an additional uncertainty of the unfolding procedure.
The statistical uncertainties are propagated through the unfolding by performing pseudo-experiments.
An ensemble of pseudo-experiments is created in which each bin of the transfer matrix is varied accord- ing to its statistical uncertainty from the Monte Carlo samples. A separate set of pseudo-experiments is performed in which the data spectrum is fluctuated according to the statistical uncertainty taking cor- relation between jets produced in the same event into account. The unfolding is then applied to each pseudo-experiment, and the resulting ensembles are used to calculate the covariance matrix of the cor- rected spectrum, from which the uncertainties are obtained.
The unfolding procedure is repeated for the propagation of the uncertainties on the jet energy and
angle measurements, as described in the next section.
10 Systematic uncertainties on the cross section measurement
The following sources of systematic uncertainty are considered in this measurement: the trigger effi- ciency, jet reconstruction and calibration, the unfolding procedure and the luminosity measurement.
An uncertainty on the trigger efficiency of 1% is chosen for most of the kinematic region (
|y
|<2.8, p
T>45 GeV in 2.8
≤ |y
|<3.6 and p
T >30 GeV in 3.6
≤ |y
|<4.4), since triggers with an efficiency higher than 99 % for a given jet p
Tare used. A 2% systematic uncertainty is assigned for jets with p
T≤45 GeV in the region 2.8
≤ |y
|<3.6 or with p
T≤30 GeV in the region 3.6
≤ |y
|<4.4, as the triggers are used for p
Tclose to the lowest p
Tpoint with 99% efficiency for these jets.
The uncertainty on the jet reconstruction efficiency is the same as in the previous measurement at
√s
=7 TeV [30] and is 2% for p
T <30 GeV and 1% for p
T >30 GeV. It is evaluated using jets reconstructed from tracks [75]. Though the jet selection efficiency previously measured at
√s
=7 TeV has very small uncertainty, the uncertainty on the jet selection efficiency is assigned as 0.5%. It accounts for the level of agreement in the efficiency measurements at the different centre-of-mass energies. If the uncertainty from the
√s
=7 TeV data is larger than 0.5%, the larger uncertainty is used.
The uncertainties on the jet energy calibration are evaluated using the same uncertainty sources as for the previous measurement. Effects from the systematic uncertainty sources are propagated through the unfolding procedure to provide the uncertainties on the measured cross sections. The JES uncertainty reflects 14 sources and is described in detail in Ref. [75]. The JES applied to the reconstructed jets in Monte Carlo simulation is varied separately for each JES uncertainty source both up and down by one standard deviation. The resulting p
Tspectra are unfolded using the nominal unfolding matrix. The relative shifts with respect to the nominal unfolded spectrum are taken as uncertainties on the cross section.
The uncertainty on the jet energy resolution (JER) is assigned by considering the difference between data and Monte Carlo simulation in the estimated JER using in situ techniques. The effect of this un- certainty on the cross section measurement is evaluated by smearing the energy of reconstructed jets such that the resolution is worsened by one standard deviation of the uncertainty. Then a new transfer matrix is constructed and used to unfold the data spectra. The relative difference of the cross sections unfolded with the modified transfer matrix and with the nominal one is taken as the uncertainty in the measurement.
The jet angular resolution is estimated using the Monte Carlo simulation. A new transfer matrix with angular resolution deteriorated by 10% is constructed and is used for the data unfolding. The relative difference to the nominal unfolded result is assigned as the resulting uncertainty.
The uncertainties of the unfolding procedure are described in Section 9. The closure test and the variation of the matching criteria used to construct the transfer matrix are examined. The impact of a possible mis-modelling of the jet p
Tspectrum in the Monte Carlo simulation is assessed in the closure test of the unfolding procedure.
The integrated luminosity is calculated by measuring interaction rates with several ATLAS devices.
The absolute calibration is derived using van der Meer scans [78] [79]. Two scans were performed during the collection of the datasets used in this measurement. The uncertainty of the luminosity calibration comes from three contributions: the van-der-Meer scan, the bunch charge measurement and the long- term consistency of the different algorithms to measure the instantaneous luminosity in ATLAS. Due to modifications in the hardware for the bunch current measurements, the uncertainty has been improved with respect to the 2010 calibration [80]. The total uncertainty of the luminosity determination is 2.8%, compared to 3.4% for the 2010 measurement.
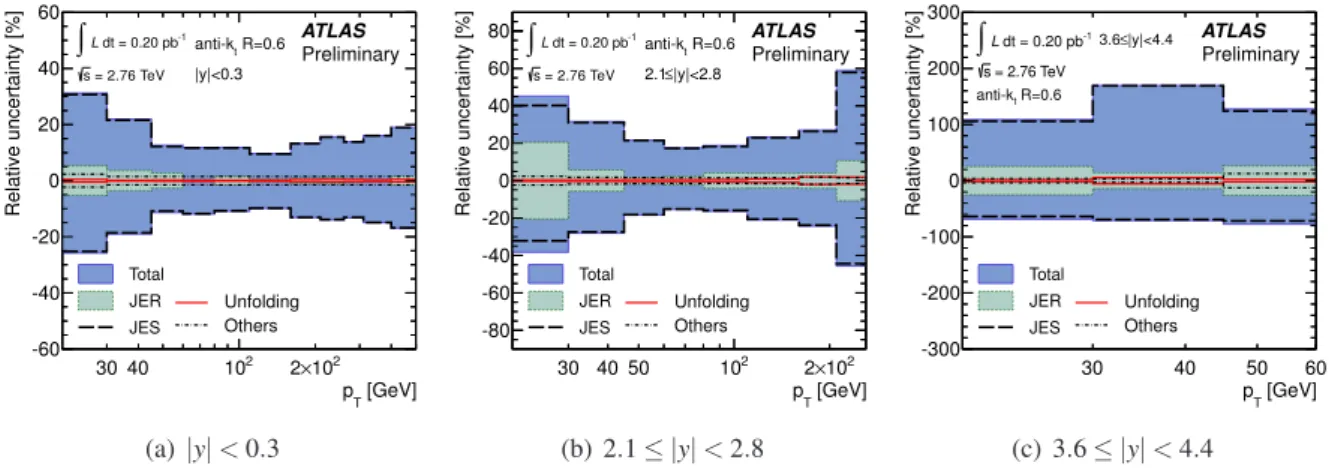
The evaluated systematic uncertainties on the measured cross section are added in quadrature and
shown in Figure 5 for representative rapidity bins. The largest systematic uncertainty for this measure-
ment is driven by the uncertainties of the JES. The very steeply falling jet p
Tspectrum, especially for
large rapidity, translates even relatively modest uncertainties on the transverse momentum into large changes of the measured cross section. The uncertainty on the jet energy resolution also has a sizable effect on the total systematic uncertainty of the measurement in the low p
Tbins. Other systematic un- certainty sources are found to have smaller impact on the results.
[GeV]
pT
30 40 102 2×10²
Relative uncertainty [%]
-60 -40 -20 0 20 40 60
ATLAS
Total JER JES
Unfolding Others dt = 0.20 pb-1
∫L = 2.76 TeV s
R=0.6 anti-kt
|y|<0.3
Preliminary
(a)|y|<0.3
[GeV]
pT
30 40 50 102 2×10²
Relative uncertainty [%]
-80 -60 -40 -20 0 20 40 60
80 ATLAS
Total JER JES
Unfolding Others dt = 0.20 pb-1
∫L = 2.76 TeV s
R=0.6 anti-kt
|y|<2.8
≤ 2.1
Preliminary
(b) 2.1≤ |y|<2.8
[GeV]
pT
30 40 50 60
Relative uncertainty [%]
-300 -200 -100 0 100 200 300
ATLAS
Total JER JES
Unfolding Others dt = 0.20 pb-1
∫L = 2.76 TeV s
R=0.6 anti-kt
|y|<4.4
≤ 3.6
Preliminary
(c) 3.6≤ |y|<4.4
Figure 5: The systematic uncertainty on the inclusive jet cross section measurement for anti-k
tjets with R
=0.6 in three representative rapidity bins, as a function of the jet p
T. In addition to the total uncertainty, the uncertainties from the jet energy scale (JES), the jet energy resolution (JER), the unfolding procedure and the other systematic sources are shown separately. The statistical uncertainty and the uncertainty of the luminosity measurement are not shown.
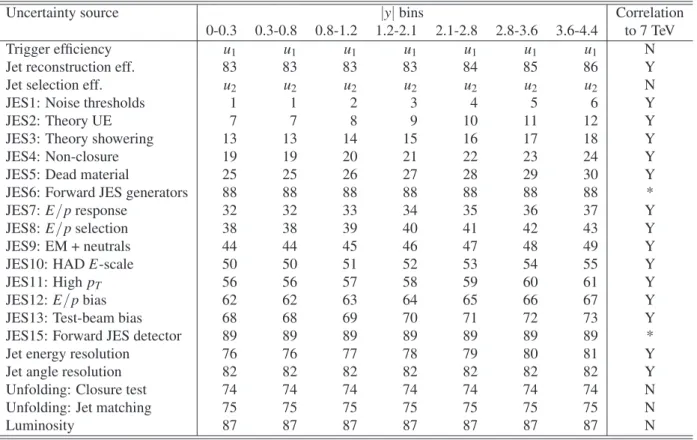
In total 22 independent sources of systematic uncertainty have been considered. The correlations of the systematic uncertainties across p
Tand y are examined and summarised in Table 2. In the table, 88 independent nuisance parameters describe the correlations of systematic uncertainties over the whole phase space. The systematic effect on the cross section measurement associated with each nuisance parameter is treated as completely correlated in p
Tand y. The table also shows the correlation with respect to the previous
√s
=7 TeV measurement using 2010 data, which is used in the extraction of the cross section ratio in Section 12.
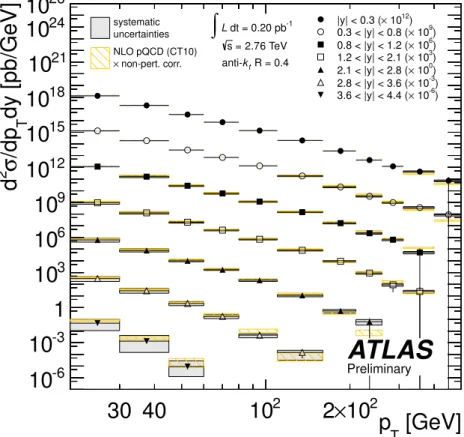
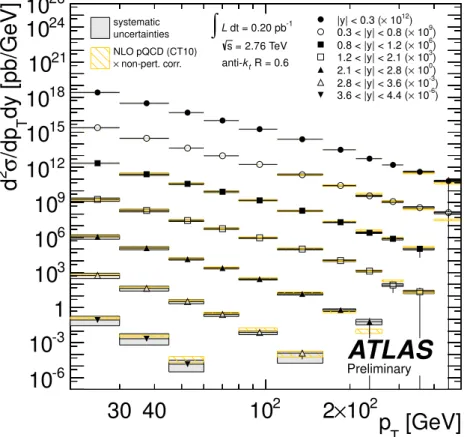
11 Inclusive jet cross section at √
s = 2 . 76 TeV
The inclusive jet double-differential cross section is shown in Figures 6 and 7 for jets reconstructed with the anti-k
talgorithm with R
=0.4 and R
=0.6, respectively. The measurement extends from the jet transverse momentum of 20 GeV to 430 GeV in the rapidity region of
|y
|<4.4, covering 7 orders of magnitude in cross section. The results are compared to NLO pQCD predictions calculated with NLOJET++ using the CT10 PDF set corrected for non-perturbative effects.
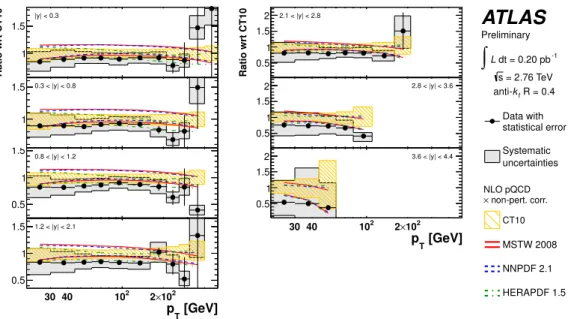
The measured cross section is presented in terms of the ratio with respect to the NLO pQCD predic- tions using the CT10 PDF set in Figures 8 and 9 for jets with R
=0.4 and R
=0.6, respectively. The results are also compared to the predictions obtained using the PDF sets MSTW 2008, NNPDF 2.1 and HERAPDF 1.5. The measurement is consistent with all the theory predictions using different PDF sets within their systematic uncertainties for jets with both distance parameters. However, the data for jets with R
=0.4 have systematically lower cross section than any of the theory predictions, while such a tendency is only seen in the forward rapidity regions in the measurement for jets with R
=0.6.
The comparison of the data with the P
OWHEGprediction, using the CT10 NLO PDF set, is shown
Table 2: Description of the bin-to-bin uncertainty correlation in the measurement of the inclusive jet cross section at
√s
=2.76 TeV. Each number corresponds to a nuisance parameter for which the corresponding uncertainty is fully correlated in jet p
T. Bins with the same nuisance parameter are treated as fully correlated, while bins with different nuisance parameters are uncorrelated. Numbers are assigned to be the same as in the previous publication [30]. The sources indicated by u
iare sources uncorrelated in the jet p
Tand y. The correlation to the previous cross section measurement at
√s
=7 TeV [30] is indicated in the last column, where full correlation is indicated by a Y and no correlation by a N. The description of the JES uncertainty sources can be found in Refs. [75, 76]. JES14 is a source due to pile-up correction and is not considered in this measurement. The sources JES6 and JES15 were merged together in the previous measurement and the sum of the two uncertainties added in quadrature is fully correlated to the JES6 in the previous measurement, indicated by the symbol ”*” in the table. The nuisance parameter label 31 is skipped in order to be able to keep the same numbers for corresponding nuisance parameters in the two jet cross section measurements.
Uncertainty source |y|bins Correlation
0-0.3 0.3-0.8 0.8-1.2 1.2-2.1 2.1-2.8 2.8-3.6 3.6-4.4 to 7 TeV
Trigger efficiency u1 u1 u1 u1 u1 u1 u1 N
Jet reconstruction eff. 83 83 83 83 84 85 86 Y
Jet selection eff. u2 u2 u2 u2 u2 u2 u2 N
JES1: Noise thresholds 1 1 2 3 4 5 6 Y
JES2: Theory UE 7 7 8 9 10 11 12 Y
JES3: Theory showering 13 13 14 15 16 17 18 Y
JES4: Non-closure 19 19 20 21 22 23 24 Y
JES5: Dead material 25 25 26 27 28 29 30 Y
JES6: Forward JES generators 88 88 88 88 88 88 88 *
JES7:E/presponse 32 32 33 34 35 36 37 Y
JES8:E/pselection 38 38 39 40 41 42 43 Y
JES9: EM + neutrals 44 44 45 46 47 48 49 Y
JES10: HADE-scale 50 50 51 52 53 54 55 Y
JES11: HighpT 56 56 57 58 59 60 61 Y
JES12:E/pbias 62 62 63 64 65 66 67 Y
JES13: Test-beam bias 68 68 69 70 71 72 73 Y
JES15: Forward JES detector 89 89 89 89 89 89 89 *
Jet energy resolution 76 76 77 78 79 80 81 Y
Jet angle resolution 82 82 82 82 82 82 82 Y
Unfolding: Closure test 74 74 74 74 74 74 74 N
Unfolding: Jet matching 75 75 75 75 75 75 75 N
Luminosity 87 87 87 87 87 87 87 N