c Owned by the authors, published by EDP Sciences, 2016
Proton structure and parton distribution functions from HERA
Vladimir Chekelian1. On behalf of the H1 and ZEUS Collaborations.
1Max Planck Institute for Physics, Munich.
Abstract. The H1 and ZEUS collaborations at the electron-proton collider HERA col- lected e±p scattering data corresponding to an integrated luminosity of about 1 fb−1. The data were taken at proton beam energies of 920, 820, 575 and 460 GeV and an electron beam energy of 27.5 GeV, with different electric charges and longitudinal polarisation of the electron beam. Using these data inclusive neutral and charged current deep inelastic cross sections were measured over six orders of magnitude in negative four-momentum- transfer squared, Q2, and Bjorken x. A combination of all inclusive cross sections, pub- lished by the H1 and ZEUS collaborations at HERA, was performed. Using these com- bined HERA data and the individual H1 and ZEUS data taken using the polarised electron beams, the proton structure functions F2, F2γZ, xFγZ3 and FLwere obtained, and scaling violations, electroweak unification, and polarisation effects in the charged current process were demonstrated. The combined cross sections were used as a sole input to QCD anal- yses at leading, next-to-leading and next-to-next-to-leading orders, providing a new set of parton distribution functions, denoted as HERAPDF2.0. An extension of the analysis by including HERA data on charm and jet production allowed a simultaneous determination of parton distributions and the strong coupling.
1 Introduction
Deep inelastic scattering (DIS) of electrons1on protons at the electron-proton collider HERA has been central to the exploration of proton structure and quark–gluon dynamics as described by perturbative Quantum Chromodynamics (pQCD). HERA was operated in two phases: HERA I, from 1992 to 2000, and HERA II, from 2002 to 2007, with an electron beam energy of Ee = 27.5 GeV. During HERA I and II running, the H1 and ZEUS collaborations collected total integrated luminosities of approximately 500 pb−1 each, shared about equally between e+p and e−p scattering. This includes data taken with proton beam energies of Ep=920, 820, 575 and 460 GeV corresponding to centre-of- mass energies of√s=318, 300, 251 and 225 GeV. During the HERA II period, the electron beam was longitudinally polarised with left-handed and right-handed polarisations in about equal proportion.
For this period, the H1 and ZEUS collaborations published both polarised cross sections, measured using data with the longitudinally polarised electron beams, and unpolarised cross sections, obtained using data with both polarisations taken together and corrected for small residual polarisation.
The combination of all H1 and ZEUS inclusive neutral (NC) and charged current (CC) unpolarised deep inelastic e±p cross section data was performed [1]. The correlated systematic uncertainties and
1The word “electron" in the paper refers to both electrons and positrons, unless otherwise stated.
global normalisations were treated such that one coherent HERA data set was obtained. The results published in [1] comprise the core of this paper.
Using these combined unpolarised HERA I and HERA II and polarised HERA II cross section data, the proton structure functions F2, FγZ2 , xFγZ3 and FL were obtained, and scaling violations, electroweak unification as well as polarisation effects in CC were demonstrated.
The dependences of the combined NC and CC inclusive DIS cross sections from HERA on Bjorken x and negative four-momentum-transfer squared, Q2, were analysed in the pQCD frame- work to determine a new set of quark and gluon momentum distributions in the proton, denoted as HERAPDF2.0. An inclusion of the HERA data on charm and jet production to the analysis allowed a simultaneous determination of the parton distributions and the strong coupling.
2 NC and CC cross sections and parton distributions
The neutral current e±p deep inelastic scattering cross section, after correction for QED radiative effects, can be written in the reduced form as
σ±r,NC= d2σeNC±p dxdQ2
xQ4 2πα2
1 Y+
=F˜2∓Y− Y+
x ˜F3− y2 Y+
F˜L. (1)
Here, x is the Bjorken scaling variable, andycharacterizes the inelasticity of the interaction. The helicity dependences are contained in Y±=1±(1−y)2. The generalised proton structure functions, F˜2,3, occurring in Eq. 1, may be written as linear combinations of the hadronic structure functions F2, F2,3γZ, and F2,3Z , containing information on the QCD parton dynamics as well as the electroweak couplings of the quarks to the neutral vector bosons. The function F2is associated with pure photon exchange terms, FγZ2,3correspond to photon–Z interference and F2,3Z correspond to pure Z exchange terms. The longitudinal structure function ˜FLmay be similarly decomposed. ˜FLis important only at highyand is expected to be negligible at large x and Q2.
The generalised proton structure functions depend on the electric charge of the lepton beam and on the lepton beam polarisation2, P, on the Z-boson mass MZ and on sin2θW, with θW being the electroweak mixing angle.
F˜±2 =F2+κ(−ve∓Pae)F2γZ+κ2(v2e+a2e±2Pveae)FZ2, x ˜F±3 =κ(−ae∓Pve)xFγZ3 +κ2(2veae±P(v2e+a2e))xF3Z.
(2) Here,κ=(4 sin2θWcos2θW)−1Q2/(Q2+MZ2) determines the relative amount of Z toγexchange. The quantitiesve=−1/2+2 sin2θWand ae=−1/2 are the vector and axial-vector couplings of the electron to the Z-boson in the Standard Model. At leading order in QCD the hadronic structure functions are related to linear combinations of sums and differences of the quark and anti-quark momentum distributions xq(x,Q2) and x ¯q(x,Q2) of the proton:
(F2, FγZ2 , FZ2)=xX
(e2q,2eqvq, v2q+a2q)(q+¯q), (xF3γZ,xFZ3)=2xX
(eqaq, vqaq)(q−¯q),
(3) wherevqand aqare the vector and axial-vector couplings of the light quarks to the Z-boson, and eqis the charge of the quark of flavor q.
2The longitudinal polarisation is defined as P=(NR−NL)/(NR+NL) with NR(NL) being the number of right-handed (left-handed) leptons in the beam.
The charged current e±p cross section of longitudinally polarised leptons and unpolarised protons can be expressed in the reduced form as
˜
σ±r,CC≡2πx G2F
M2W+Q2 M2W
2d2σeCC±p dxdQ2 = 1
2(1±P)
Y+W2±∓Y−xW3±−y2WL±
, (4)
where GF is the Fermi constant defined using the weak boson masses MW and MZ. This equation shows that the cross section has a linear dependence on the longitudinal polarisation of the lepton beam. In the QPM WL± ≡ 0, and the structure functions W2±and xW3± are expressed as the flavor- dependent sum and difference of the quark and anti-quark momentum distributions. Only positively charged quarks contribute to W−mediated scattering, and only negatively charged quarks couple to the exchanged W+boson: W2−=x(U+D), W2+=x(U+D), xW3−=x(U−D), xW3+=x(D−U). Below the b-quark mass threshold, the U,U and D,D distributions represent the sums of up-type and down-type quark densities: U=u+c, U=¯u+¯c, D=d+s, D=d¯+¯s.
The combination of NC and CC measurements makes it possible to determine both the valence- quark distributions, xuv=x(U−U) and xdv=x(D−D), and the sea-quark distributions, xU and xD.
The parton distribution functions (PDFs) are determined by a fit to the x and Q2dependence of data using the linear DGLAP equations [2] at leading order (LO), next-to-leading order (NLO) or next-to- next-to-leading order (NNLO) in pQCD. The experimentally measured scaling violations determine the gluon distribution in the fit.
3 Combination of all inclusive NC and CC cross section data at HERA
In order to combine all inclusive unpolarised NC and CC cross section measurements published by H1 and ZEUS, they were translated onto common x, Q2grids and averaged [1]. In total 41 data sets from H1 and ZEUS entered into this combination. The references to individual data sets can be found in [1]. Separate measurements from the same data set were not translated to the same grid point and the vast majority of grid points accumulated data from both H1 and ZEUS measurements; the typical case is six measurements from six different data sets. The translation of the original measurements to the nearest grid points was performed using results of the QCD and fractal fits to the combined data;
for details see [1]. The procedure applied for the combination follows very closely to the one used for the previously published combination of the HERA I data [3] and for the combination of the HERA I data and preliminary HERA II results [4].
3.1 Averaging cross sections
The averaging of the data points was performed using the HERAverager [5] tool which is based on aχ2minimisation method [6]. This method imposes that there is one and only one correct value for the cross section of each process at each point of the phase space. These values are estimated by opti- mising a vector, mi, which is the result of the averaging for the cross sections. Theχ2definition used takes into account the correlated and uncorrelated systematic uncertainties of the H1 and ZEUS cross- section measurements and allows for shifts of the data to accommodate the correlated uncertainties.
Theχ2function involves all measurements from all data sets and can be approximated by
χ2tot≈χ2min+ X
i=1,NM
hmi−P
jγijmib′j−µii2
δ2i,statµi mi−P
jγijmib′j +
δi,uncormi2 +X
j
(b′j)2, (5)
where χ2min is the minimum of χ2tot, NM is the number of combined measurements, µi is the aver- age value at point i, andγij,δi,statandδi,uncorare its relative correlated systematic, relative statistical
H1 and ZEUS
0 0.2 0.4 0.6 0.8 1 1.2 1.4 1.6 1.8
1 10 102 103 104 105
σr, NC
Q2/GeV2
+ HERA NC e+p 0.5 fb–1
√s = 318 GeV ZEUS HERA II ZEUS HERA I H1 HERA II H1 HERA I xBj = 0.0002
xBj = 0.002
xBj = 0.008
xBj = 0.032
xBj = 0.08
xBj = 0.25 xBj = 0.008 xBj = 0.08
H1 and ZEUS
0 0.2 0.4 0.6 0.8 1 1.2
103 104
σr, NC–
Q2/GeV2 HERA NC e –p 0.4 fb–1
HERA I
√s = 318 GeV xBj = 0.008
xBj = 0.032
xBj = 0.08
xBj = 0.25
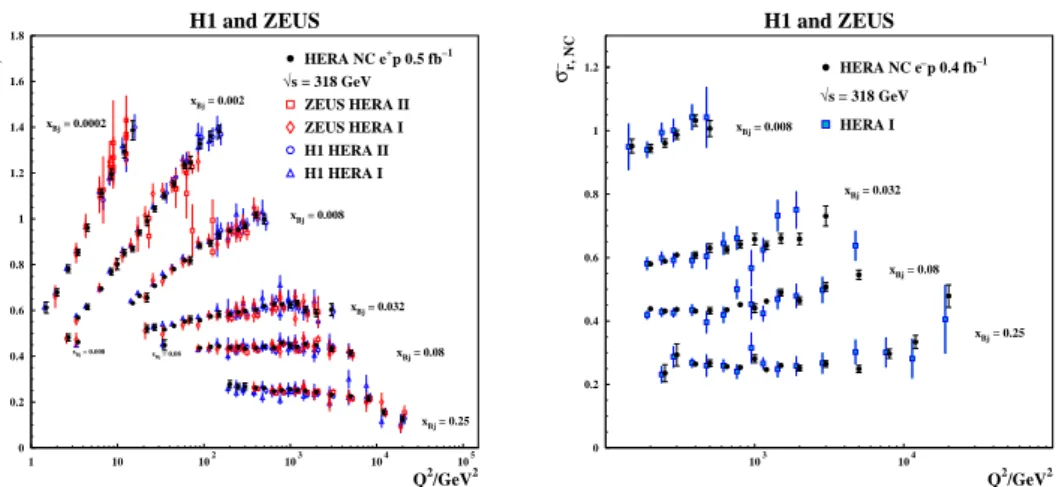
Figure 1. Left: The combined HERA data for the inclusive NC e+p reduced cross sections as a function of Q2 for six selected values of x, compared to the individual H1 and ZEUS data. Right: The combined HERA data for the inclusive NC e−p reduced cross section as a function of Q2for four selected values of x, compared to the previously published combined results from HERA I alone.
and relative uncorrelated systematic uncertainties, respectively. The shifts b′j, also called nuisance parameters, are related to the original correlated shifts bjof the cross sections in units of sigma of the respective correlated systematic uncertainties through an orthogonal transformation, which is also used to determineγij[3]. The average valuesµiand systematic shifts bjare determined analytically from a system of linear equations∂χ2tot/∂mi=0 and∂χ2tot/∂bj =0. An iterative procedure is used to determine the average of the data. It converges after two iterations.
3.2 Combined neutral and charged current cross sections at HERA
The 2927 published cross sections from the 41 data sets were combined to become 1307 combined cross-section measurements. For the resulting 1620 degrees of freedom, aχ2min=1687 was obtained, indicating consistency of the input data. It was also checked that the pull distributions for the different data sets and in different corners of the phase space showed good consistency of all data.
In Fig. 1 (left) the individual H1 and ZEUS and the HERA combined reduced cross sections for NC e+p scattering at √
s = 318 GeV are shown as a function of Q2 for selected values of x.
The improvement due to combination is clearly visible. In Fig. 1 (right) a comparison between the combined HERA data and the combination of HERA I data alone [3] for NC e−p scattering is shown.
The integrated luminosity for e−p scattering was very limited for the HERA I period, therefore, the improvements due to the new combination are even more substantial than for e+p scattering.
The combined reduced cross sections for NC and CC e±p scattering are obtained together with their statistical, uncorrelated and correlated systematic uncertainties. At the proton beam energy of Ep=920 GeV, corresponding to the highest centre-of-mass energy of √
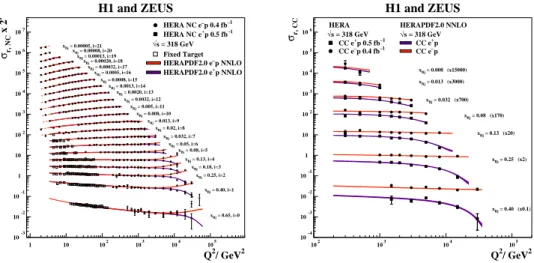
s=318 GeV, they are shown in Fig. 2 for NC (left) and CC (right) as a function of Q2 for different values of x. The total un- certainties for NC are below 1.5 % over the Q2 range of 3 ≤ Q2 ≤ 500 GeV2 and below 3 % up to Q2 = 3000 GeV2. Cross sections are provided for values of Q2 between Q2 =0.045 GeV2 and Q2=50000 GeV2and for values of x between x=6×10⁻⁷and x=0.65.
H1 and ZEUS
xBj = 0.00005, i=21 xBj = 0.00008, i=20
xBj = 0.00013, i=19 xBj = 0.00020, i=18
xBj = 0.00032, i=17 xBj = 0.0005, i=16
xBj = 0.0008, i=15 xBj = 0.0013, i=14
xBj = 0.0020, i=13 xBj = 0.0032, i=12
xBj = 0.005, i=11 xBj = 0.008, i=10
xBj = 0.013, i=9 xBj = 0.02, i=8
xBj = 0.032, i=7 xBj = 0.05, i=6
xBj = 0.08, i=5 xBj = 0.13, i=4
xBj = 0.18, i=3 xBj = 0.25, i=2
xBj = 0.40, i=1
xBj = 0.65, i=0
Q2/ GeV2 σr, NC x 2i
HERA NC e+p 0.5 fb–1 HERA NC e– p 0.4 fb–1
√s = 318 GeV Fixed Target HERAPDF2.0 e+p NNLO HERAPDF2.0 e– p NNLO
10-3 10-2 10-1 1 10 102 103 104 105 106 107
1 10 102 103 104 105
H1 and ZEUS
xBj = 0.008 (x15000) xBj = 0.013 (x3000)
xBj = 0.032 (x700) xBj = 0.08 (x170)
xBj = 0.13 (x20)
xBj = 0.25 (x2)
xBj = 0.40 (x0.1)
Q2/ GeV2 σr, CC
HERA
√s = 318 GeV HERAPDF2.0 NNLO
√s = 318 GeV CC e+p 0.5 fb–1
CC e –p 0.4 fb–1
CC e+p CC e– p
10-4 10-3 10-2 10-1 1 10 102 103 104 105 106
102 103 104 105
Figure 2. Left (Right): The combined HERA data for the inclusive NC (CC) e+p and e−p reduced cross sections at √
s = 318 GeV together with fixed-target data and the predictions of HERAPDF2.0 NNLO. The bands represent the total uncertainties on the predictions.
The combined NC and CC cross sections were integrated to obtain the single-differential cross sections dσ/dQ2. The integration over x was performed in the regiony < 0.9, using the shapes as predicted from HERAPDF2.0. All correlated and uncorrelated uncertainties were taken into account.
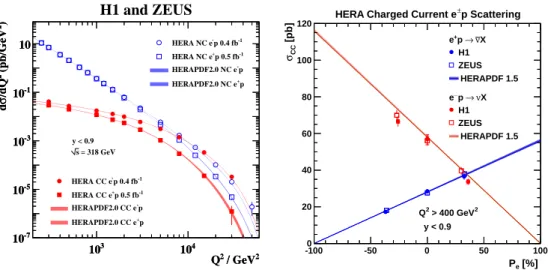
The cross-sections dσ/dQ2are shown in Fig. 3 (left) for NC and CC e−p and e+p scattering together with predictions from HERAPDF2.0 NLO. Whereas the NC cross sections are three orders of mag- nitude larger at low Q2 ≈100 GeV2, where they are dominated by virtual photon exchange, the NC and CC cross sections become similar in magnitude at Q2 ≈ 10000 GeV2, i.e. at around the mass- scale squared of the electroweak bosons, demonstrating the success of electroweak unification in the Standard Model.
The total CC cross sectionsσeCC±p measured by H1 and ZEUS in the range Q2 > 400 GeV2 and y <0.9 are shown in Fig. 3 (right) as a function of the electron beam polarisation. The cross sections were obtained using the HERA II CC data with left-handed and right-handed electron beam polarisa- tions [7, 8] and using CC data from HERA I with unpolarised electron beams [9]. The measurements are compared to expectations of the Standard Model based on the HERAPDF1.5[4] parameterisation of the parton densities of the proton. The measurements exhibit the expected linear dependence as a function of the polarisation and are consistent with the axiomatic absence of right-handed charged currents in the Standard Model.
3.3 Scaling violations ofF2and the proton structure functionFγZ
2
The dominant contribution to the NC cross section is due to ˜F2, see Eqs. 1-3. Therefore, the combined reduced NC cross sections in Fig. 2 (left) reveal the main properties of the proton structure function F˜2. At x≃0.1 they are independent of Q2 demonstrating scaling of ˜F2in this region. At higher and lower values of x one observes scaling violations due to emission of gluons from quarks and splitting of gluons into quark-antiquark pairs, respectively. Values of the structure function ˜F2 determined
/ GeV2
Q2
103 104
)2 (pb/GeV2/dQσd
10-7
10-5
10-3
10-1
10
H1 and ZEUS
y < 0.9 = 318 GeV s
p 0.4 fb-1 HERA NC e-
p 0.5 fb-1 HERA NC e+
-p HERAPDF2.0 NC e
+p HERAPDF2.0 NC e
p 0.4 fb-1 HERA CC e-
p 0.5 fb-1 HERA CC e+
-p HERAPDF2.0 CC e
+p HERAPDF2.0 CC e
/ GeV2
Q2
103 104
)2 (pb/GeV2/dQσd
10-7
10-5
10-3
10-1
10
[%]
Pe
-100 -50 0 50 100
[pb]CCσ
0 20 40 60 80 100
120 HERA Charged Current e±p Scattering
> 400 GeV2 Q2 y < 0.9
νX
→ +p e
νX
→
p e
HERAPDF 1.5 HERAPDF 1.5
H1 ZEUS H1 ZEUS
Figure 3. Left: The combined HERA NC and CC e−p and e+p cross sections, dσ/dQ2, together with predictions from HERAPDF2.0 NLO. Right: The dependence of the total e+p and e−p CC cross sections in the region Q2>400 GeV2andy <0.9 on the electron beam polarisation Pe, together with the Standard Model predictions based on HERAPDF1.5.
from the reduced cross sections in the phase space, where corrections due to both x ˜F3 and ˜FL are small, are displayed as a function of x at fixed Q2 in Fig. 4 (left) together with HERAPDF2.0 NLO predictions. Here, the scaling violations manifest themselves by the rise towards low values of x, which is becoming steeper as Q2increases.
The polarisation effects in NC allow the parity violating component of the proton structure func- tion ˜F2, namely FγZ2 , to be determined. For a given electron charge the difference of the left (L) and right (R) polarised NC cross sections can be written as
σ±r,NC(P±L)−σ±r,NC(P±R) P±L−P±R =κ
"
∓aeF2γZ+Y− Y+
vexF3γZ−Y− Y+
κ(v2e+a2e)xF3Z
#
. (6)
Subtracting the differences for the e−p and e+p interactions, the terms proportional to xF3γZand xFZ3 cancel, and F2γZ can be directly extracted from the cross section data. H1 performed such measure- ments [7] for Q2 ≥ 200 GeV2using HERA II data with the polarised electron beams. Only a weak Q2dependence is expected, and therefore the measurements were transformed to a common Q2value of 1500 GeV2using the H1PDF 2012 fit [7] and were averaged in each x bin. The parity violating structure function FγZ2 measured for the first time is displayed in Fig. 4 (right).
3.4 Electron charge dependence of the NC cross section and determination ofxFγZ
3
The different charges of electrons and positron beams allow the structure function x ˜F3to be measured due to difference in the sign in front of the x ˜F3contribution in Eq. 1. The differences in the combined e+p and e−p NC reduced cross sections are clearly visible at high Q2 in Fig. 2 (left). The structure function x ˜F3 was extracted by subtracting the combined NC e+p from the combined NC e−p cross sections at HERA for Q2 ≥1000 GeV2. The dominant contribution to x ˜F3arises from theγZ inter- ference, which allows xFγZ3 to be determined using Eq. 2. The structure function xF3γZis non-singlet
H1 and ZEUS
Q2 = 6.5 GeV2
F2~
Q2 = 12 GeV2 Q2 = 120 GeV2
Q2 = 1200 GeV2
xBj HERA NC e+p 0.5 fb–1
√s = 318 GeV HERAPDF2.0 NLO
0 0.2 0.4 0.6 0.8 1 1.2 1.4 1.6
10-4 10-3 10-2 10-1
10-1 1
0 0.5 1
H1 Collaboration
HERA II
= 1500 GeV2
Transformed to Q 2 γZ
F2
x H1
H1PDF 2012
Figure 4. Left: The structure function ˜F2as extracted from the HERA combined reduced NC cross sections for four values of Q2 together with predictions using HERAPDF2.0 NLO. Right: The structure function F2γZ as a function of x at Q2=1500 GeV2compared to predictions based on H1PDF 2012.
and shows little dependence on Q2. The measured xF3γZ at different Q2values can thus be averaged taking into account the small Q2dependence. The averaged values of xFγZ3 [1], determined for a Q2 value of 1000 GeV2, are shown in Fig. 5 (left). The measurement directly probes the valence-quark content of the proton and is well described by HERAPDF2.0 NLO.
3.5 Measurement of the longitudinal structure functionFL
The longitudinal structure function FLis obtained at HERA [10, 11] in a model independent way using measurements at fixed x and Q2 but differenty. This is achieved by H1 and ZEUS using data from
xBj
10-1 1
Zγ 3xF
0 0.5
1 H1 and ZEUS
= 1000 GeV2
Q2 HERA 1 fb-1
HERAPDF2.0 NLO
1 10 102 103
-0.2 0 0.2 0.4
4 10⋅x 0.28 0.43 0.59 0.88 1.29 1.69 2.24 3.19 4.02 5.40 6.87 9.58 12.1 15.7 24.3 30.3 40.2 54.1 73.6 98.6 184
H1 and ZEUS FL
2] [GeV Q2 HERAPDF1.5 NNLO CT10 NNLO MSTW08 NNLO
ABM12 NNLO NNPDF2.3 NNLO JR09 NNLO
H1 ZEUS H1 ZEUS H1 ZEUS
1 10 102 103
-0.2 0 0.2 0.4
Figure 5. Left: The structure function xF3γZfor ten values of Q2together with predictions from HERAPDF2.0 NLO. Right: The H1 and ZEUS measurements of FL(Q2). The resulting x values of the averaged FLare given on top for each point in Q2. The data are compared to NNLO predictions based on a selection of PDF sets as indicated.
running periods with reduced (460 GeV and 575 GeV) and nominal (920 GeV) proton beam energies.
According to Eq. 1, the FLcontribution to the reduced cross section is proportional to f (y)=y2/[1+ (1−y)2]. Therefore, the FLvalues can be determined as slopes of straight-line fits of the measured σr,NC(x,Q2, y) values as a function of they-dependent factor f (y). More sophisticated procedures to determine FL and F2 were applied by H1 and ZEUS to take into account correlations of data points due to systematic uncertainties. The H1 and ZEUS measurements of FL(x,Q2) were averaged at fixed Q2, and the resulting values of FL(Q2) are shown in Fig. 5 (right). The H1 measurements generally lie above the ZEUS results. The differences were examined in the common Q2 range, 9 ≤ Q2 ≤ 110 GeV2. Taking into account both the correlations between the H1 and between the ZEUS measurements, aχ2 of 11 was obtained for 8 degrees of freedom. This corresponds to a p- value of 20%, indicating consistency of the H1 and ZEUS FLresults. The data are reasonably well reproduced by theoretical predictions at NNLO. The measurements of FLwere used to determine the ratio R = FL/(F2−FL). For 1.5 ≤ Q2 ≤ 800 GeV2 the ratio R measured by H1 showed constant behaviour yielding the averaged value of R = 0.23±0.04 [10]. The corresponding ZEUS result is R=0.105+0.055−0.037[11] in the range 9≤Q2≤110 GeV2.
4 QCD analysis of the combined inclusive cross sections at HERA
The combined inclusive e±p NC and CC cross section data [1] were used as the sole input in the pQCD analysis, resulting in the PDF set called HERAPDF2.0 [1]. This analysis was performed within the HERAFitter framework [12] by fitting the predictions obtained by solving the DGLAP evolution equations at LO, NLO and NNLO in the MS scheme [13] to the combined HERA data.
The DGLAP equations yield the PDFs at all scalesµ2f and x, if they are provided as functions of x at some starting scale. In variable-flavour-number schemes, this scale has to be below the charm-quark mass parameter, Mc, squared. It was chosen to be 1.9 GeV2. The renormalisation and factorisation scales were taken to be Q2. The heavy-quark coefficient functions were calculated in the general- mass variable-flavour-number scheme called RTOPT [14] for the NC structure functions. For the CC structure functions, the zero-mass approximation was used, since all HERA CC data have Q2 ≫Mb2, where Mbis the beauty-quark mass parameter in the calculation. The value of Mcand Mbwere chosen after performingχ2scans of NLO and NNLO pQCD fits to the combined inclusive data together with the HERA combined charm data [15] or with data on beauty production from ZEUS [16] and H1 [17].
The value of the strong coupling constant was taken to beαs(MZ2) =0.118 [18] at NLO and NNLO andαs(MZ2)=0.130 [19] for the LO fit.
In the approach of HERAPDF, the PDFs of the proton, x f , are generically parameterised at the starting scale as x f (x)=AxB(1−x)C(1+Dx+E x2) . The PDFs parameterised are the gluon distribution, xg, the valence-quark distributions, xuv, xdv, and the u-type and d-type anti-quark distributions, x ¯U, x ¯D. The relations x ¯U=x ¯u and x ¯D=x ¯d+x ¯s are assumed at the starting scale.
The central parameterisation is
xg(x) =AgxBg(1−x)Cg−A′gxB′g(1−x)C′g, (7) xuv(x)=AuvxBuv(1−x)Cuv
1+Euvx2
, xdv(x)=AdvxBdv(1−x)Cdv, x ¯U(x)=AU¯xBU¯(1−x)CU¯ 1+DU¯x, x ¯D(x)=AD¯xBD¯(1−x)CD¯.
In the gluon distribution, xg, an additional term of the form A′gxB′g(1−x)C′gwas subtracted at NLO and NNLO to allow more flexibility for the gluon distribution. The fits without this term are marked by adding “AG” (alternative gluon) to the fit notation, e.g. HERAPDF2.0AG LO for the fit at LO.
To safely remain in the kinematic region where pQCD is expected to be applicable, only cross sections for Q2starting from Q2min =3.5 GeV2were used in the analysis. In the kinematic region of the fits, target-mass corrections and large-x higher-twist corrections are expected to be negligible.
0.2 0.4 0.6 0.8 1
10-4 10-3 10-2 10-1 1
HERAPDF2.0 NNLO uncertainties:
experimental model parameterisation HERAPDF2.0AG NNLO
x
xf 2 = 10 GeV2
µf
xuv
xdv
0.05)
× xS (
0.05)
× xg (
H1 and ZEUS
0.5 1 1.5 2 2.5
10-4 10-3 10-2 10-1 1
HERAPDF2.0 NNLO HERAPDF2.0HiQ2 NNLO HERAPDF2.0 NNLO HERAPDF2.0HiQ2 NNLO
x
xf 2
= 10000 GeV
2
µf
xuv
xdv
0.05)
× xS (
0.05)
× xg (
H1 and ZEUS
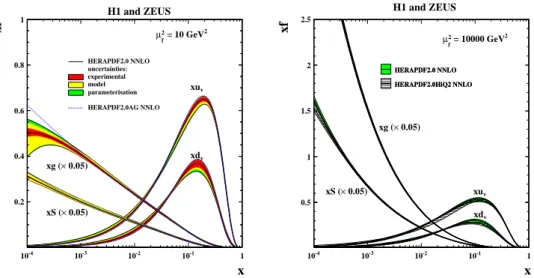
Figure 6. The parton distribution functions xuv, xdv, xS =2x( ¯U+D) and xg; the gluon and sea distributions¯ are scaled down by a factor 20. Left: HERAPDF2.0 NNLO atµ2f =10 GeV2. The experimental, model and pa- rameterisation uncertainties are shown. The dotted lines represent HERAPDF2.0AG NNLO with the alternative gluon parameterisation. Right: HERAPDF2.0 NNLO atµ2f =10000 GeV2with Q2min =3.5 GeV2compared to HERAPDF2.0HiQ2 NNLO with Q2min=10 GeV2. The bands represent the total uncertainties.
Experimental uncertainties were determined using the Hessian method with the criterion∆χ2=1, justified by the consistency of the input HERA data. In addition to experimental uncertainties, model and parameterisation uncertainties were also considered. The uncertainties on HERAPDF2.0 due to the choice of model settings and the form of the parameterisation were evaluated by varying the as- sumptions. Two kinds of parameterisation uncertainties were considered, the variation of the starting scale and the addition of terms with parameters D and E; see the generic form of parameterisation above. The only significant difference from the 14-parameter central fit came from the 15-parameter fit, for which Duvwas non zero. The final parameterisation uncertainty for a given quantity is taken as the largest of the uncertainties. The total PDF uncertainty is obtained by adding in quadrature the experimental, the model and the parameterisation uncertainties. The setup used in this QCD analysis follows closely to the one established earlier for HERAPDF1.0 [3] for fitting the combined HERA I data [3].
4.1 HERAPDF2.0 and its variants
Using the standard settings discussed above, the HERAPDF2.0 sets of PDS were determined at NLO and NNLO. A summary of HERAPDF2.0 NNLO is shown in Fig. 6 (left) at the scaleµ2f =10 GeV2. The experimental, model and parameterisation uncertainties are shown separately. The distribution of HERAPDF2.0AG NNLO with the alternative gluon parameterisation is shown as well. At NNLO, the gluon distribution of HERAPDF2.0 ceases to rise at low x in contrast to HERAPDF2.0AG NNLO.
It was observed that theχ2per degree of freedom in the fit is decreasing and getting closer to unity with increasing value of Q2min. This continues up to Q2min =10 GeV2, remaining about the same for higher values of Q2min. This could be caused by non-perturbative contributions missing in the theory used in the fit. A question may arise whether including data from the kinematic region of low x and low
Q2, i.e. below 10 GeV2, in the PDF fits could introduce a bias on predictions for high x and high Q2. To answer this, the HERAPDF2.0HiQ2 NLO and NNLO fits were performed with Q2min =10 GeV2 and the same other settings as for HERAPDF2.0. At NLO, the gluon distributions of HERAPDF2.0 and HERAPDF2.0HiQ2 were found to be compatible within uncertainties. At NNLO, the two gluon distributions differ significantly. Using the higher Q2minat NNLO causes the gluon distribution to turn over at low x. Nevertheless, it was demonstrated that at the high scale ofµ2f = 10000 GeV2, the PDFs resulting from the two fits are very similar, see Fig. 6 (right). This confirms that the value of Q2min =3.5 GeV2is safe for pQCD fits to HERA data and no bias was introduced for applications at higher scales like cross-section predictions for the LHC.
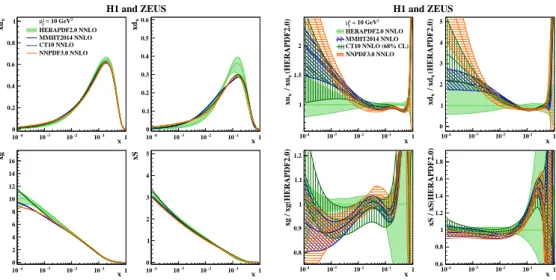
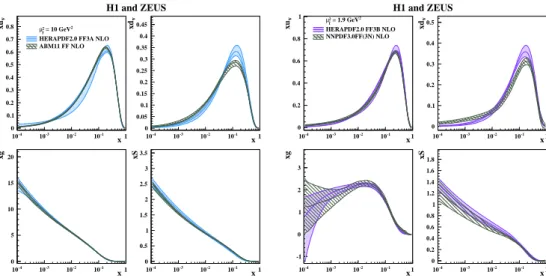
The PDFs of HERAPDF2.0 NNLO are directly compared in Fig. 7 to the PDFs of MMHT2014 [20], for which the same heavy-flavour scheme, i.e. RTOPT, was used. Also com- parisons to the PDFs of CT10 [21], for which a heavy-flavour-scheme based on ACOT was used, and NNPDF3.0 [22], for which the FONLL scheme was used, are shown. All PDFs are compatible taking into account full uncertainties. The largest relative discrepancy (≈2.5σ) is found in the shape of the xuv distribution at x ≈ 0.4. The variants of the QCD fit, HERAPDF2.0FF3A and HERA- PDF2.0FF3B, obtained using fixed-flavour-number schemes are compared in Fig. 8 to the PDFs of ABM11 FF(3N) [23] and NNPDF3.0 FF(3N) [22] with similar flavour schemes. The gluon distribu- tions are quite similar. Some differences are observed in the xuvand xdvvalence distributions.
An extension of the analysis by including HERA data on charm and jet production, denoted as HERAPDF2.0Jets, made a simultaneous determination of parton distributions and the strong coupling at the scale MZ2possible. A full uncertainty analysis was performed including model and parameter- isation uncertainties as well as additional hadronisation uncertainties on the jet data. Theχ2 and the resulting PDFs of the HERAPDF2.0Jets fit are very close to the values for the fit with fixed
x 10 -4 10 -3 10 -2 10 -1 1 xuv
0 0.2 0.4 0.6 0.8
1 µf2 = 10 GeV2 HERAPDF2.0 NNLO MMHT2014 NNLO CT10 NNLO NNPDF3.0 NNLO
x 10 -4 10 -3 10 -2 10 -1 1 xdv
0 0.1 0.2 0.3 0.4 0.5 0.6
x 10 -4 10 -3 10 -2 10 -1 1
xg
0 2 4 6 8 10 12 14 16
x 10 -4 10 -3 10 -2 10 -1 1
xS
0 1 2 3 4 5
H1 and ZEUS
x 10 -4 10 -3 10 -2 10 -1 1 xu / xu (HERAPDF2.0)vv
1 1.5 2
= 10 GeV2 f
µ2
HERAPDF2.0 NNLO MMHT2014 NNLO CT10 NNLO (68% CL) NNPDF3.0 NNLO
x 10 -4 10 -3 10 -2 10 -1 1 xd / xd (HERAPDF2.0)vv
0 1 2 3 4 5
x 10 -4 10 -3 10 -2 10 -1 1
xg / xg(HERAPDF2.0)
0.8 0.9 1 1.1 1.2
x 10 -4 10 -3 10 -2 10 -1 1
xS / xS(HERAPDF2.0)
0.6 0.8 1 1.2 1.4 1.6 1.8
H1 and ZEUS
Figure 7. The parton distribution functions xuv, xdv, xgand xS = 2x( ¯U+D) of HERAPDF2.0 NNLO at¯ µ2f =10 GeV2 compared to those of MMHT2014, CT10 and NNPDF3.0. The left panel shows the distribution with uncertainties only for HERAPDF2.0. The right panel shows the PDFs normalised to HERAPDF2.0 and with uncertainties for all PDFs.
-4 x
10 10-3 10-2 10-1 1
xuv
0 0.1 0.2 0.3 0.4 0.5 0.6 0.7
0.8 µf2 = 10 GeV2 HERAPDF2.0 FF3A NLO ABM11 FF NLO
-4 x
10 10-3 10-2 10-1 1
xdv
0 0.05 0.1 0.15 0.2 0.25 0.3 0.35 0.4 0.45
x 10-4 10-3 10-2 10-1 1
xg
0 5 10 15 20
x 10-4 10-3 10-2 10-1 1
xS
0 0.5 1 1.5 2 2.5 3 3.5
H1 and ZEUS
-4 x
10 10-3 10-2 10-1 1
xuv
0 0.2 0.4 0.6 0.8
1 = 1.9 GeV2 f µ2
HERAPDF2.0 FF3B NLO NNPDF3.0FF(3N) NLO
-4 x
10 10-3 10-2 10-1 1
xdv
0 0.1 0.2 0.3 0.4 0.5
x 10-4 10-3 10-2 10-1 1
xg
-1 0 1 2 3
x 10-4 10-3 10-2 10-1 1
xS
0 0.2 0.4 0.6 0.8 1 1.2 1.4 1.6 1.8
H1 and ZEUS
Figure 8. The parton distribution functions xuv, xdv, xgand xS = 2x( ¯U+D). Left: HERAPDF2.0FF3A at¯ µ2f =10 GeV2compared to ABM11 FF. Right: HERAPDF2.0FF3B at the starting scaleµ2f
0=1.9 GeV2compared to NNPDF3.0FF (3N).
αs(M2Z)=0.118, because the HERAPDF2.0Jets fit with freeαs(M2Z) yields a very similar value of αs(MZ2)=0.1183±0.0009(exp)±0.0005(model/param.)±0.0012(hadron.)+0.0037−0.0030(scale) . The uncertainty onαs(M2Z) due to scale uncertainties was evaluated by varying the renormalisation and factorisation scales by a factor of two, both separately and simultaneously, and taking the maximal positive and negative deviations. The result onαs(MZ2) is compatible with the world average [18] and it is competitive with other determinations at NLO.
5 Summary and Conclusion
The H1 and ZEUS collaborations measured inclusive e±p scattering cross sections at HERA from 1994 to 2007, collecting a total integrated luminosity of about 1 fb−1at four different centre-of-mass energies, with two different detectors changing and improving over time. All inclusive data were combined to create one consistent set of NC and CC cross-section measurements for unpolarised e±p scattering, spanning six orders of magnitude in both negative four-momentum-transfer squared, Q2, and Bjorken x. Combined cross sections are provided for values of Q2between Q2=0.045 GeV2and Q2 = 50000 GeV2and values of x between x =6×10⁻⁷and x =0.65. They are the most precise measurements ever published for ep scattering over such a large kinematic range. Using the combined HERA data and the individual data taken by H1 and ZEUS with longitudinal beam polarisation, the proton structure functions F2, F2γZ, xFγZ3 and FLwere obtained, and scaling violations, electroweak unification and polarisation effects in CC were demonstrated.
The combined inclusive cross sections were used as input to a QCD analysis within the DGLAP formalism. The resulting parton distribution functions are denoted HERAPDF2.0 and are available at LO, NLO and NNLO using variable-flavour-number scheme. Two variants, HERAPDF2.0 FF3A and FF3B, using fixed-flavour number schemes, are also available at NLO. Other variants of the fit were