ATLAS-CONF-2013-055 28May2013
ATLAS NOTE
ATLAS-CONF-2013-055
May 27, 2013
ATLAS measurements of the 7 and 8 TeV cross sections for Z → 4` in pp collisions
ATLAS Collaboration
Abstract
This note presents measurements of singly-resonant
Zdecay to four leptons (e
+e−e+e−,
µ+µ−µ+µ−, and
e+e−µ+µ−) in proton-proton collisions at 7 TeV and 8 TeV with the ATLAS detector. The single resonant peak from
Z →4` provides a practical test of the detector response to a four-lepton resonance similar to the Higgs boson decay
H→ZZ∗→4`. Data samples of proton-proton collisions with integrated luminosities of 4.6 fb
−1at
√s =
7 TeV and 20.7 fb
−1at
√s =
8 TeV are used to select 21 and 141 candidate events, respectively.
The background contamination is estimated to be less than 1%. The cross sections in the phase-space defined by dilepton and four-lepton invariant masses of
M`+`− ≥4 GeV and 76
≤ M4` ≤106 GeV are measured to be 114
±27 (stat)
±7 (syst)
±2 (lumi) fb at 7 TeV and 150
±13 (stat)
±7 (syst)
±5 (lumi) fb at 8 TeV. A branching fraction for the
Zboson decay to 4` in the above phase-space is derived from the cross-section measurements to be (4.2
±0.4)
×10
−6, consistent with the Standard Model prediction of (4.37
±0.03)
×10
−6.
c
Copyright 2013 CERN for the benefit of the ATLAS Collaboration.
Reproduction of this article or parts of it is allowed as specified in the CC-BY-3.0 license.
1 Introduction
This note presents the first measurement in ATLAS of the rare production of four leptons: e
+e
−e
+e
−(4e), µ
+µ
−µ
+µ
−(4µ), and e
+e
−µ
+µ
−(2e2µ) at the Z resonance,
pp
→Z/Z
∗Z
∗→`
+1`
−1`
2+`
−2,
(denoted Z
→4` from here on) via an s-channel diagram such as Figure
1(a) where two pairs ofoppositely-charged and same-flavour leptons are produced by radiative Z/γ
∗decay or a t-channel di- agram such as Figure
1(b) (also calledZ
∗Z
∗). The Z
→4` process is predicted by the Standard Model (SM), but is only now being clearly observed and carefully measured at the LHC [1–3]. This production and decay is especially important as a companion to other, even rarer, multilepton final states such as from the decay of a Higgs boson [4,
5]. This note describes the measurement of theZ
→4` production cross section and determination of a branching fraction as well as studies of the line shape and the mass scale of the resonance by ATLAS.
Z/γ
∗Z
∗/γ
∗¯ q q
`
+`
+`
−`
−Z
∗/γ
∗Z
∗/γ
∗¯ q q
`
+`
−`
+`
−(a) (b)
Figure 1: (a) The Feynman diagram of Z
→4` and (b) four lepton production via the non-resonant t-channel production of two Z
∗/γ
∗. The t-channel production is estimated to contribute 8.0% to 8.8% in the 4` mass range 76 to 106 GeV.
Throughout this work Z
→4` cross sections are measured in a kinematic region defined by con- straints on the dilepton and four-lepton invariant masses, M
`+`− ≥4 GeV (for all same-flavour `
+`
−) and 76
≤M
4` ≤106 GeV, referred to as “the phase-space.” The Z
→4` process is included in the NLO calculations of MCFM [6,
7] and Powheg[8–11] Monte Carlo (MC) programs. Powheg is used in this analysis to generate MC events with full detector simulations to determine the signal acceptance.
The SM predictions and uncertainties are calculated using both P
owhegand MCFM. The CT10 PDF (parton density functions) set [12] and QCD normalisation and factorisation scales of µ
R, µ
F =M
4`are used. Table
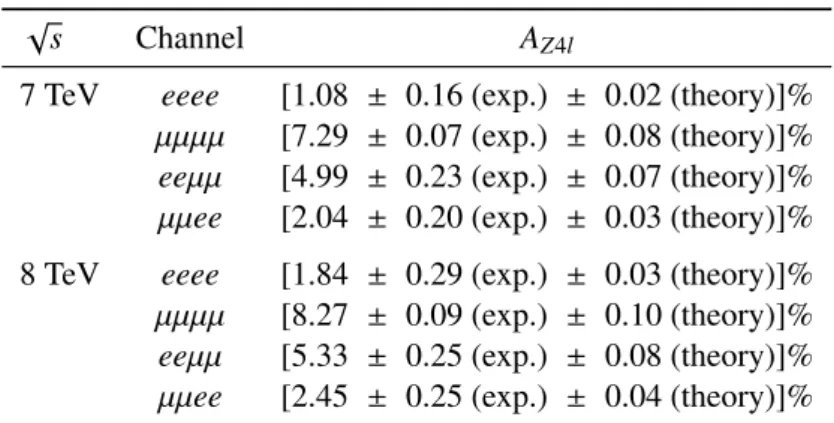
1shows the SM predictions of the Z production cross section and the four-lepton resonance cross section within the mass window of 76 to 106 GeV. Generator-level distributions of the four-lepton invariant mass are shown in Figure
2. The figure shows the contribution from the non-resonantt-channel contribution of Figure
1(b) and the total 4`production. This t-channel contribution, estimated with P
owhegMC calculations, is 8.0% and 8.8% within the mass window of 76 to 106 GeV for same-flavour (4e, 4µ) and mixed-flavour (2e2µ) final states.
The measurements presented in this note are based on proton-proton collision data collected by the
ATLAS detector in 2011 (4.6 fb
−1at 7 TeV) and 2012 (20.7 fb
−1at 8 TeV). The ATLAS detector has been
described in detail elsewhere [13]. Since only electrons and muons are used in this measurement, the
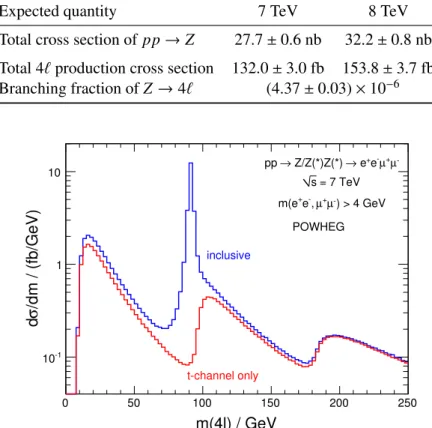
Table 1: The cross section of pp
→Z in a mass window of 76 to 106 GeV, and the cross section of the total 4` (e
+e
−e
+e
−, µ
+µ
−µ
+µ
−, e
+e
−µ
+µ
−) production in both s-channel and t-channel in a mass phase- space of M
`+`− ≥4 GeV (for all same-flavour `
+`
−) and 76
≤M
4` ≤106 GeV. The quoted uncertainties include the QCD scale and PDF uncertainties.
Expected quantity 7 TeV 8 TeV
Total cross section of pp
→Z 27.7
±0.6 nb 32.2
±0.8 nb Total 4` production cross section 132.0
±3.0 fb 153.8
±3.7 fb Branching fraction of Z
→4` (4.37
±0.03)
×10
−6m(4l) / GeV
0 50 100 150 200 250
/dm / (fb/GeV)σd
10-1
1 10
µ-
µ+
e-
e+
Z/Z(*)Z(*) → pp →
= 7 TeV s
POWHEG ) > 4 GeV µ-
µ+ -,
+e m(e
inclusive
t-channel only
Figure 2: Generator-level distributions of the four-lepton invariant mass as calculated by Powheg. The lower curve includes only the t-channel Z
(∗)Z
(∗)→4` contributions and this is combined with the singly resonant s-channel contribution to form the upper curve.
important components for this analysis are the inner tracking detector, the electromagnetic calorimeter, the muon spectrometer, and the lepton triggers.
The results are measurements of the total Z
→4` production cross section carried out separately for the 7 TeV and 8 TeV datasets. The resonance shape and mass are compared to fully simulated Powheg MC events. Except for the muon p
T, this work uses lepton identification requirements identical to those used in the H
→ZZ
∗→4` analysis [2] so that they may be compared. Muon p
Tand dilepton invariant mass requirements are loosened to increase the acceptance for the Z
→4` process. The backgrounds are very small and arise mainly from t¯ t and Z
+jets events, which are estimated using data-driven techniques and cross checked with MC simulation. Other backgrounds, such as W
±Z, and Z
+γ, and single-resonant decays involving τ leptons, are estimated from MC simulation to be negligible.
The 4` cross-section measurements are interpreted as a measurement of the Z
→4` branching fraction by subtracting the expected t-channel contributions, ignoring the very small interference e
ffect between s-channel and t-channel, and taking the ratio to the total Z boson production cross section.
The CMS collaboration has observed the Z
→4` decay in
√s
=7 TeV data and determined a branching fraction of
B(Z →4`)
=4.2
+−0.80.9(stat.)
±0.2 (syst.)
×
10
−6, in agreement with the SM
prediction of 4.45
×10
−6[1]. The phase-space of the CMS result is the region M
`+`−> 4 GeV for
all pairs of leptons and 80 < M
4`< 100 GeV. This is a slightly tighter M
4`requirement than this
work, which selects events in 80 < M
4`< 100 GeV but corrects to a phase-space cross section of 76 < M
4`< 106 GeV.
This note is organised as follows. Section
2briefly describes the dataset used in this analysis and the MC simulation used to estimate the signal expectation and to cross check the background estimation.
The event selection is discussed in Section
3, and the signal acceptance and uncertainties are describedin Section
4. The background estimation is given in Section5. The cross section and line-shape resultsare presented in Section
6. Conclusions are given in Section7.2 Dataset and Monte Carlo simulation
Events were selected using single and dilepton triggers, the same set as in the H
→ZZ
∗ →4` anal- ysis [2]. The transverse momentum thresholds of these triggers vary from 20 to 24 GeV in the single- lepton triggers and from 8 to 13 GeV in the dilepton triggers, depending on flavour and period. Because of the higher instantaneous luminosity running in 2012 than in 2011 many of the triggers for this period also include an isolation requirement. Data flagged with quality problems that a
ffect the lepton recon- struction are removed. After data quality cuts, the total integrated luminosity used in the analysis is 4.6 fb
−1at 7 TeV and 20.7 fb
−1at 8 TeV.
The overall uncertainty in the integrated luminosity for the 2011 dataset is
±1.8% and is describedin Ref. [14]. For the 2012 dataset the corresponding preliminary uncertainty is
±3.6% and is determinedusing a method similar to that described in Ref. [14], updated for 2012 data-taking and 8 TeV.
The signal acceptance is determined from a detailed Monte Carlo simulation. The NLO generator P
owhegwith NLO PDF set CT10 is used to model Z
→4` events. The simulation includes the interfer- ence terms between the s-channel and the t-channel as well as the interference terms between the Z and the γ
∗diagrams. P
owhegis interfaced to P
ythia[15] for showering and hadronization.
The contributions from background processes are estimated from the data and are validated with predictions from MC simulations. MC@NLO [16] is used to model t¯ t and single top-quark events.
A
lpgen[17] is used to model W
±or Z boson production in association with jets. P
ythiaand S
herpa[18]
are used to model the diboson processes W
+W
−, W
±Z, and Zγ. P
owhegis used to model Z
→4` decays involving τ leptons, which are treated as background.
The detector response is simulated [19] with a program based on GEANT4 [20]. The mean number of pp collisions per bunch crossing is between 1 and 40 for the 2011 and the 2012 data used in this analysis. Additional inelastic pp interactions (referred to as ‘pile-up’) are included in the simulation, and the generated events are re-weighted to reproduce the observed distribution of the average number of collisions per bunch-crossing in the data.
3 Event selection
Muons are identified by tracks (or track segments) reconstructed in the muon spectrometer and are matched to tracks reconstructed in the inner detector. They are required to have p
T> 4 GeV and
|η|< 2.7.
Because the four-lepton final state has very few backgrounds, the muon acceptance is increased by al- lowing looser identification for one muon. This may be a “stand-alone” muon identified by only a muon spectrometer track with p
T> 4 GeV in 2.5 <
|η|< 2.7 (beyond the inner detector acceptance), or it may be a “calorimeter-tagged” muon identified by an inner detector track with p
T> 15 GeV associated with an appropriate calorimeter energy deposit in
|η|< 0.1 (where the muon spectrometer acceptance is low).
In order to reject muons from the decays of heavy quarks, isolated muons are selected by requiring the scalar sum of the transverse momenta (
Pp
T) of other tracks inside a cone of
∆R
= p∆
η
2+ ∆φ
2 =0.2
around the muon to be less than 15% of the muon p
T. In addition, the scalar sum of the transverse energy
(
PE
T) deposited in calorimeter cells inside a cone of
∆R
=0.2 around the muon is required to be less than 30% of the muon p
T(or 15% for stand-alone muons).
Electrons are reconstructed from energy deposits in the electromagnetic calorimeter matched to a track in the inner detector. Electron candidates are required to have p
T> 7 GeV and
|η|< 2.47. They are required to be isolated using the same criteria as for muons except that the calorimeter isolation fraction must be less than 20% in 2012 data.
The impact parameter significance, d
0/σ
d0, is required to be less than 3.5 for all muons and less than 6 for all electrons. The electron impact parameter distribution is a
ffected by bremsstrahlung and is thus broader.
The candidate quadruplet is formed by selecting two opposite sign, same flavour dilepton pairs in an event. The four leptons of the quadruplets are required to be well separated,
∆R > 0.1. The leading three leptons must have p
T> 20, 15, and 8 GeV, and if the third (p
T-ordered) lepton is an electron it must have p
T> 10 GeV. The dilepton pair with invariant mass closest to the nominal Z boson mass is called the leading dilepton pair or Z
1, while the second pair is called Z
2. The dilepton masses must satisfy M
Z1> 20 GeV and M
Z2> 5 GeV. For M
4`near M
Z, typical values of M
Z1are
≈60 GeV while M
Z2is quite low, as seen in Figures
3(e) and3(f) in Section6. In the same-flavour channels the alternatepairings of same-flavour and opposite-sign leptons are required to have M
`+`−> 5 GeV. This vetos the background events from J/ψ decays.
The invariant mass of the lepton quadruplet is restricted to 80
≤M
4` ≤100 GeV. With the above event selection 21 and 141 Z
→4` events are observed in the 7 TeV and 8 TeV datasets, respectively.
The number of events observed in each channel is shown in Table
4. The 4`resonant peak is clearly observed in all channels, as shown in Figure
4in Section
6.4 Signal acceptance and uncertainties
The overall acceptance and efficiency for observing SM production of 4` events in the M
`+`− ≥4 GeV and 76
≤M
4`≤106 GeV phase-space is denoted A
Z4land is calculated using P
owhegMC samples. The quantity A
Z4lincludes the extrapolation from the measured region of M
`+`− ≥5 GeV and 80
≤M
4` ≤100 GeV to the phase-space. The MC lepton identification and trigger efficiencies are corrected with data control samples. The energy and momentum scales and resolutions of the MC events are calibrated to reproduce data from Z
→`
+`
−and J/ψ
→`
+`
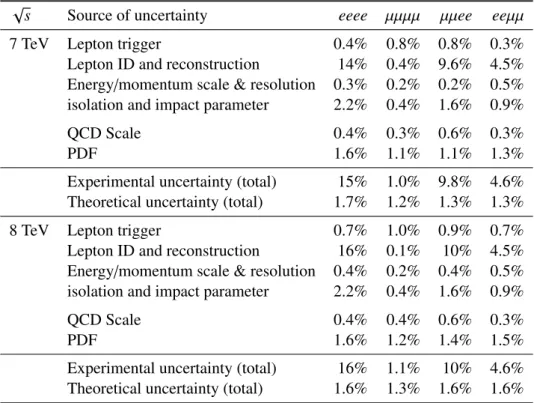
−. The A
Z4lvalues, along with experimental and theoretical uncertainties, are listed in Table
2for each channel and data period. In the channel’s naming, the first two leptons stand for the dilepton pair of Z
1and the last two leptons for the dilepton pair of Z
2. The highest event selection e
fficiency is for 4µ events and the lowest is for 4e events.
The experimental signal detection acceptance uncertainties are determined by varying the nominal calibrations by
±1σ(standard deviations), including lepton energy and momentum resolutions, lepton energy and momomentum scales, and the trigger and reconstruction identification e
fficiencies. These uncertainties are determined by using the MC samples of pp
→Z
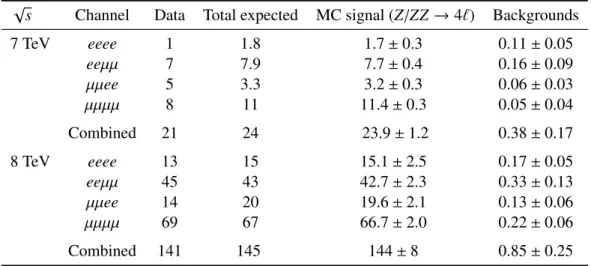
→4` events to evaluate the accep- tance changes when varying the experimental calibrations from their nominal values. A summary of the important uncertainties is given in Table
3. The total experimental uncertainty for each channel is aquadratic sum of each independent source of uncertainty. We note that the main uncertainties come from the electron identification and reconstruction scale factors for efficiency calculations. The experimental uncertainties in signal acceptance are similar for 2011 and 2012 data analysis. The uncertainties in 2012 are slightly larger due to larger pile-up.
The overall theoretical uncertainties on acceptance are about 1.5%. They are evaluated using P
owhegMC samples. The theoretical uncertainties reflect uncertainties from the choice of QCD scales and PDF.
The QCD scales include the renormalisation scale (µ
R) and factorisation scale (µ
F). They are varied from
0.5 to 2 times the nominal µ
R, µ
F =M
4`scale. The nominal PDF for cross section calculations is CT10
√
s Channel A
Z4l7 TeV eeee [1.08
±0.16 (exp.)
±0.02 (theory)]%
µµµµ [7.29
±0.07 (exp.)
±0.08 (theory)]%
eeµµ [4.99
±0.23 (exp.)
±0.07 (theory)]%
µµee [2.04
±0.20 (exp.)
±0.03 (theory)]%
8 TeV eeee [1.84
±0.29 (exp.)
±0.03 (theory)]%
µµµµ [8.27
±0.09 (exp.)
±0.10 (theory)]%
eeµµ [5.33
±0.25 (exp.)
±0.08 (theory)]%
µµee [2.45
±0.25 (exp.)
±0.04 (theory)]%
Table 2: The overall acceptance and e
fficiency of the Z
→4` signal, A
Z4l, as well as the experimental and theoretical uncertainties. Updates to electron identification substantially increased four-electron efficiency in 8 TeV data, for more details see Ref. [2].
in this analysis. The PDF uncertainties are determined by comparing the nominal CT10 PDF to its 52 eigenvectors (yielding the largest contribution to the theoretical uncertainty) as well as comparing to an alternative set, MSTW2008 [21].
5 Background estimation
The backgrounds to the Z
→4` process are small. The major background sources come from leptonically decaying Z
+jets and t¯ t events. These events contain two isolated leptons from Z or W
±decays, but additional activity such as heavy flavour jets or misidentified components of jets may yield leptons in reconstruction. At least two leptons must be reconstructed from this additional activity to mimic the Z
→4` signal, making these backgrounds rare. The reducible backgrounds are smaller than in the Higgs analysis near M(4`)
=125 GeV in large part because Z
+X processes are inhibited in the event selection region where the four-lepton invariant mass must be below 100 GeV.
Backgrounds from W
±Z, external conversions of the ISR photon in Z
+γ, and Z
→2e2τ, 2µ2τ, 4τ are estimated with MC simulation to be negligible. In MC simulations, the only backgrounds passing all analysis cuts are from Zb b ¯ and t¯ t productions. Therefore b-jets are expected to be the main source of backgrounds for this analysis. The reducible backgrounds involving pairs of misidentified or non-isolated leptons are estimated using data control samples as described in the following.
A background-enriched control sample containing four-lepton objects is formed by selecting events with two leptons that pass all the standard lepton selection requirements (denoted `) and two lepton objects with some relaxed and inverted requirements (denoted “anti-identified” or x
b). All other event requirements are unchanged. These ``
+x
bx
bevents are used to estimate the number of background events in the signal region via transfer factors,
N
background = X``+xb,1xb,2event
f (x
b,1) f (x
b,2), where f is a transfer factor which depends on the lepton flavour and p
T.
Jet-enriched samples from t¯ t
→e
±µ
∓+b b ¯
+E
missTand from Z(→ `
+`
−)
+jets are selected to determinethe transfer factors. The t¯ t sample is tagged by a high p
T, isolated eµ pair with large E
missT. The Z
+jets
sample is tagged by Z
→`
+`
−. In addition to these tagged leptons, at least one additional lepton-like
object (denoted as x) should be found in the control samples. The same selection requirements for ` or
Table 3: Experimental and theoretical uncertainties for signal acceptance.
√
s Source of uncertainty eeee µµµµ µµee eeµµ
7 TeV Lepton trigger 0.4% 0.8% 0.8% 0.3%
Lepton ID and reconstruction 14% 0.4% 9.6% 4.5%
Energy
/momentum scale & resolution 0.3% 0.2% 0.2% 0.5%
isolation and impact parameter 2.2% 0.4% 1.6% 0.9%
QCD Scale 0.4% 0.3% 0.6% 0.3%
PDF 1.6% 1.1% 1.1% 1.3%
Experimental uncertainty (total) 15% 1.0% 9.8% 4.6%
Theoretical uncertainty (total) 1.7% 1.2% 1.3% 1.3%
8 TeV Lepton trigger 0.7% 1.0% 0.9% 0.7%
Lepton ID and reconstruction 16% 0.1% 10% 4.5%
Energy/momentum scale & resolution 0.4% 0.2% 0.4% 0.5%
isolation and impact parameter 2.2% 0.4% 1.6% 0.9%
QCD Scale 0.4% 0.4% 0.6% 0.3%
PDF 1.6% 1.2% 1.4% 1.5%
Experimental uncertainty (total) 16% 1.1% 10% 4.6%
Theoretical uncertainty (total) 1.6% 1.3% 1.6% 1.6%
for x
bare applied to these lepton-like objects, and f is determined from the ratio, f
=N(`)/N( x
b). This is done separately for t¯ t and Z
+jet tagged events, in p
Tbins, and for electrons and muons.
The anti-identified electrons, x
b, pass the same track hit, kinematic, and geometric requirements as standard electrons. They pass loosened impact parameter and isolation requirements, but they fail ei- ther the remaining identification requirements or the standard isolation requirement. The anti-identified muons, x
b, pass the same kinematic and geometric cuts as standard muons. They also pass relaxed re- quirements on the impact parameter and isolation, but they fail both of the standard track and calorimetry isolation requirements.
The numbers of t¯ t tagged events in the control region are about 1300 and 35000 from the 7 TeV and the 8 TeV datasets, respectively. Using MC simulation, it is estimated that this sample is dominanted by t¯ t (>92%) and the extra contributions from EW processes are subtracted when the transfer factors are computed. The number of Z
+jets tagged events in the control region is about 146,000 and 850,000 for 7 TeV and 8 TeV datasets, respectively. There are very small contributions from the EW diboson processes (WZ and ZZ) that are subtracted o
ffbefore the transfer factors are computed.
The electron transfer factors are derived from the Z
+x control samples and the muon transfer fac- tors are derived from the t¯ t control samples. To estimate the systematic uncertainties for electrons the nominal transfer factors were compared to those derived from the t¯ t control samples. For the systematic uncertainties on the muon transfer factors the nominal results were compared to those obtained using an alternate definition of anti-identified, x
0b(with the same t¯ t control sample). In this alternate definition the x
0bmuons fail only one of the track or calorimeter isolations.
The resulting background estimates, itemised by channel and dataset, are summarised in the last
column of Table
4. The uncertainties range from 35% to 85% for the 7 TeV analysis and from 23% to40% for the 8 TeV analysis.
6 Results
Comparisons of the observed Z
→4` events to predictions from simulated signal events and data- driven background estimates are presented in Sections
6.1and
6.2. The numbers of selected events andestimated background events are used in the cross section calculations of Section
6.3. In Section6.4the resonance mass and width are compared with fits to data and MC simulation.
6.1 Summary of observed and predicted events
The observed data, MC signal predictions, and background estimation from data, separated by channel and dataset, are shown in Table
4. A total of 21 and 141 events are selected in 7 TeV and 8 TeV datasets,respectively. The numbers of signal events predicted by MC simulation are 23.9 and 144 for 7 TeV and 8 TeV, respectively. The backgrounds are expected to contribute about 1% of the events in the signal region. Observed data and MC predictions are in good agreement.
Table 4: The number of events observed in data, predicted for signal from MC simulation, and estimated for background using data-driven techniques for 7 TeV and 8 TeV data.
√
s Channel Data Total expected MC signal (Z/ZZ
→4`) Backgrounds
7 TeV eeee 1 1.8 1.7
±0.3 0.11
±0.05
eeµµ 7 7.9 7.7
±0.4 0.16
±0.09
µµee 5 3.3 3.2
±0.3 0.06
±0.03
µµµµ 8 11 11.4
±0.3 0.05
±0.04
Combined 21 24 23.9
±1.2 0.38
±0.17
8 TeV eeee 13 15 15.1
±2.5 0.17
±0.05
eeµµ 45 43 42.7
±2.3 0.33
±0.13
µµee 14 20 19.6
±2.1 0.13
±0.06
µµµµ 69 67 66.7
±2.0 0.22
±0.06
Combined 141 145 144
±8 0.85
±0.25
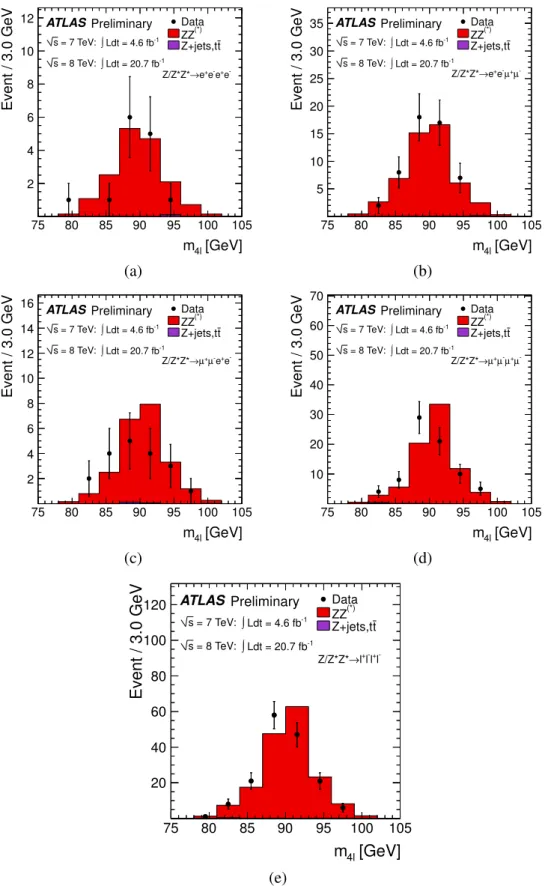
6.2 Comparison of kinematic distributions between data and simulated MC events Comparisons of data to expected distributions after all selections are applied are shown in Figures
3and
4.The lepton p
Tdistributions are shown in Figure
3as well as the two-lepton invariant mass distributions.
Figure
4shows the four-lepton mass distributions for each channel and with all channels combined. Data and simulation are consistent within uncertainties in all the distributions.
6.3 Measurement of the cross section
The cross section of 4` production near the Z
→4` resonance is calculated using σ( pp
→Z/Z
∗Z
∗→4`)
=N
obs.−N
bL ×
A
Z4l, (1)
where N
obs.is the number of observed events and N
bis the number of estimated background (both
are given in Table
4); Lis the integrated luminosity; A
Z4lis the total signal acceptance including the
geometric and kinematic acceptances as well as event selection efficiencies.
[GeV]
l1
pT
0 20 40 60 80 100
Event / 5 GeV
20 40 60
80 ATLASPreliminary
= 7 TeV:
s = 8 TeV:
s
∫
∫ Ldt = 4.6 fb-1
Ldt = 20.7 fb-1
Data(*)
ZZ t Z+jets,t
l-
l+
l-
l+
Z/Z*Z*→
[GeV]
l2
pT
0 10 20 30 40 50 60
Event / 5 GeV
10 20 30 40 50 60 70 80
90 ATLASPreliminary
= 7 TeV:
s = 8 TeV:
s
∫
∫ Ldt = 4.6 fb-1
Ldt = 20.7 fb-1
Data(*)
ZZ t Z+jets,t
l-
l+
l-
l+
Z/Z*Z*→
(a) (b)
[GeV]
l3
pT
0 10 20 30 40 50 60
Event / 5 GeV
20 40 60 80
100 ATLASPreliminary
= 7 TeV:
s = 8 TeV:
s
∫
∫ Ldt = 4.6 fb-1
Ldt = 20.7 fb-1
Data(*)
ZZ t Z+jets,t
l-
l+
l-
l+
→ Z/Z*Z*
[GeV]
l4
pT
0 5 10 15 20 25 30 35 40
Event / 5 GeV
20 40 60 80 100 120 140 160 180
200 ATLASPreliminary
= 7 TeV:
s = 8 TeV:
s
∫
∫ Ldt = 4.6 fb-1
Ldt = 20.7 fb-1
Data(*)
ZZ t Z+jets,t
l-
l+
l-
l+
→ Z/Z*Z*
(c) (d)
[GeV]
Z1
m 20 30 40 50 60 70 80 90
Event / 3.0 GeV
5 10 15 20 25 30 35
40 ATLASPreliminary
= 7 TeV:
s = 8 TeV:
s
∫
∫ Ldt = 4.6 fb-1
Ldt = 20.7 fb-1
Data(*)
ZZ t Z+jets,t
l-
l+
l-
l+
Z/Z*Z*→
[GeV]
Z2
m
0 10 20 30 40 50 60
Event / 3.0 GeV
10 20 30 40 50 60 70 80
90 ATLASPreliminary
= 7 TeV:
s = 8 TeV:
s
∫
∫ Ldt = 4.6 fb-1
Ldt = 20.7 fb-1
Data(*)
ZZ t Z+jets,t
l-
l+
l-
l+
Z/Z*Z*→
(e) (f)
Figure 3: Transverse momentum distributions of the (a) leading Z
1lepton, (b) trailing Z
1lepton, (c)
leading Z
2lepton, and (d) trailing Z
2lepton in p
T. Also, invariant mass distributions for the (e) primary
Z
∗/γ
∗(Z
1) and (f) secondary Z
∗/γ
∗(Z
2). All selections have been applied and 7 TeV and 8 TeV data are
combined.
[GeV]
m4l
75 80 85 90 95 100 105
Event / 3.0 GeV
2 4 6 8 10
12 ATLASPreliminary
= 7 TeV:
s = 8 TeV:
s
∫
∫ Ldt = 4.6 fb-1
Ldt = 20.7 fb-1
Data(*)
ZZ t Z+jets,t
e-
e+
e-
e+
→ Z/Z*Z*
[GeV]
m4l
75 80 85 90 95 100 105
Event / 3.0 GeV
5 10 15 20 25 30
35 ATLASPreliminary
= 7 TeV:
s = 8 TeV:
s
∫
∫ Ldt = 4.6 fb-1
Ldt = 20.7 fb-1
Data(*)
ZZ t Z+jets,t
µ-
µ+
e-
e+
→ Z/Z*Z*
(a) (b)
[GeV]
m4l
75 80 85 90 95 100 105
Event / 3.0 GeV
2 4 6 8 10 12 14
16 ATLASPreliminary
= 7 TeV:
s = 8 TeV:
s
∫
∫ Ldt = 4.6 fb-1
Ldt = 20.7 fb-1
Data(*)
ZZ t Z+jets,t
e-
e+
µ-
µ+
→ Z/Z*Z*
[GeV]
m4l
75 80 85 90 95 100 105
Event / 3.0 GeV
10 20 30 40 50 60 70
ATLASPreliminary
= 7 TeV:
s = 8 TeV:
s
∫
∫ Ldt = 4.6 fb-1
Ldt = 20.7 fb-1
Data(*)
ZZ t Z+jets,t
µ-
µ+
µ-
µ+
→ Z/Z*Z*
(c) (d)
[GeV]
m4l
75 80 85 90 95 100 105
Event / 3.0 GeV
20 40 60 80 100
120 ATLAS Preliminary
= 7 TeV:
s = 8 TeV:
s
∫
∫
Ldt = 4.6 fb-1
Ldt = 20.7 fb-1
Data(*)
ZZ t Z+jets,t
l-
l+
l-
l+
→ Z/Z*Z*
(e)
Figure 4: Invariant mass of four leptons with final states (a) eeee, (b) eeµµ, (c) µµee, (d) µµµµ, and (e)
all combined. All selections have been applied and 7 TeV and 8 TeV data are combined.
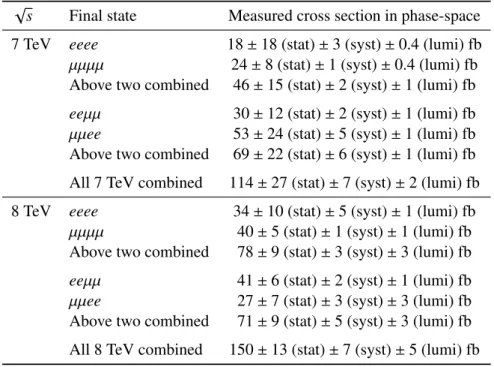
Table 5: The measured cross sections for different four-lepton final states at 7 TeV and 8 TeV. The first uncertainty is statistical, the 2nd is systematic, and the 3rd is from the luminosity determination. The 4e and 4µ, as well as the eeµµ and µµee channels are separately combined using 2
×2 covariance error matrices assuming lepton universality. The total four-lepton cross section is a linear combination of cross sections of σ(4e
+4µ) and σ(eeeµµ
+µµee). The combined errors are computed with 4
×4 error matrices.
√
s Final state Measured cross section in phase-space 7 TeV eeee 18
±18 (stat)
±3 (syst)
±0.4 (lumi) fb µµµµ 24
±8 (stat)
±1 (syst)
±0.4 (lumi) fb Above two combined 46
±15 (stat)
±2 (syst)
±1 (lumi) fb eeµµ 30
±12 (stat)
±2 (syst)
±1 (lumi) fb µµee 53
±24 (stat)
±5 (syst)
±1 (lumi) fb Above two combined 69
±22 (stat)
±6 (syst)
±1 (lumi) fb All 7 TeV combined 114
±27 (stat)
±7 (syst)
±2 (lumi) fb 8 TeV eeee 34
±10 (stat)
±5 (syst)
±1 (lumi) fb
µµµµ 40
±5 (stat)
±1 (syst)
±1 (lumi) fb Above two combined 78
±9 (stat)
±3 (syst)
±3 (lumi) fb eeµµ 41
±6 (stat)
±2 (syst)
±1 (lumi) fb µµee 27
±7 (stat)
±3 (syst)
±3 (lumi) fb Above two combined 71
±9 (stat)
±5 (syst)
±3 (lumi) fb All 8 TeV combined 150
±13 (stat)
±7 (syst)
±5 (lumi) fb
The measured cross sections are given in Table
5. The first error listed in the table is statistical, thesecond is systematic, and the third is luminosity. The 4e and 4µ channels as well as the eeµµ and µµee channels are combined with an error weighted method using 2
×2 covariance error matrices assuming lepton universality. The total four-lepton cross section is a linear combination of the cross sections of σ(4e
+4µ) and σ(eeµµ
+µµee). To account for the uncertainty correlations between the four channels the combined errors are computed with 4
×4 error matrices using the M
inuitprogram [22]. The measured cross sections listed in Table
5are consistent with the SM predictions listed in Table
1.The ratios of the observed 4` cross sections in the Z
→4` phase-space to the total theoretical Z production cross sections (listed in Table
1) areσ
obs.(Z
→4`) σ
theory( pp
→Z)
=
(4.14
±0.98)
×10
−6for 7 TeV data, (4.66
±0.48)
×10
−6for 8 TeV data.
The uncertainties are a combination of 23% (8.5%) from statistical, 5.9% (4.8%) from systematic, and 1.8% (3.6%) from the luminosity determination uncertainty for 7 TeV (8 TeV). The theoretical uncer- tainty on the Z production cross section (about 3%) is also included.
This measurement can be interpreted as a branching fraction of a Z decaying to four-leptons if the contribution from the t-channel production is removed and the e
ffect of the interference between the s-channel and t-channel is neglected. The following expression is used for this purpose:
B(Z →
4`)
=σ(4`)
×(1
−f
t) σ( pp
→Z)
where f
tis the theoretical predicted t-channel contribution in the phase-space of the cross-section mea-
surement. For 4e and 4µ channels f
t =8.0%, and for the mixed-flavour channelsf
t =8.8%. Based onMC calculations, the uncertainty of f
tis about 0.2%. The effect of interference betweeen s-channel and t-channel is very small, estimated to be about 0.2% of the total cross section in the phase-space; we take it as a systematic uncertainty. The Z boson production cross sections calculated by MCFM at NLO are 27.7
±0.6 nb and 32.2
±0.8 nb at 7 TeV and 8 TeV, respectively, for 76 < M
`+`−< 106 GeV. Therefore, a branching fraction for Z
→4` is observed to be (3.8
±0.9)
×10
−6and (4.2
±0.4)
×10
−6in the 7 TeV and 8 TeV datasets, respectively. Combining the measurements from the 2011 and 2012 datasets, a branching fraction for Z decaying to a four-lepton final state is determined to be (4.2± 0.4)× 10
−6. These branching fractions are consistent with the SM prediction of (4.37
±0.03)
×10
−6.
6.4 Invariant mass fit of the Z → 4` resonant peak
The single resonant peak from Z
→4` provides a good test of the detector response to a signal similar to the newly discovered Higgs resonance decaying into ZZ
∗ →4` with a mass of approximately 125 GeV [4,
5]. This section reports the reconstructed mass and width of theZ
→4` resonance, comparing data to predictions from simulation as a test of the MC modeling of the mass scale and resolution.
To increase the size of the data sample the M
Z2cut is relaxed from 5 GeV to 1 GeV in this section only. The J/ψ veto requirement has also been loosened to reject only events with same-flavour opposite- sign dilepton pairs of 2.5 < M
ee< 3.6 GeV or 2.95 < M
µµ< 3.25 GeV. With these relaxed requirements 168, 102, 28 and 23 events are selected from 8 TeV data in the 4µ, eeµµ, µµee, and 4e channel, respec- tively (appoximately doubling the data sample size compared to the sample used for the cross-section measurements).
Single resonance mass distributions using the cuts described in this section have been shown in Ref. [2], these plots are included in the appendix of this note. Both data and simulated MC events are fitted to the convolution of a Breit-Wigner and a Gaussian distribution, where the Breit-Wigner width is fixed to the Z width value in the PDG,
ΓZ=2.49 GeV.The four different Z
→4` mass spectra are fit separately to have a better understanding of the mass measurement in di
fferent lepton final states. The H
→ZZ
∗ →4µ channel is the most important four- lepton channel for determining the Higgs mass, and in this analysis the 4µ channel has the largest number of observed events. The second largest number of events come from the eeµµ channel because of the low muon p
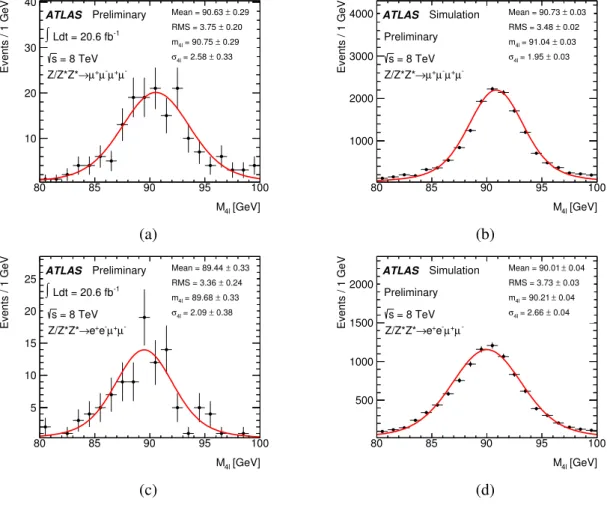
Tthreshold. Fits for data and MC events in both of these channels are shown in Figure
5. Fitsto the mass spectra in the µµee and 4e channels are shown in Figure
6. A summary of the resulting fitparameters is given in Table
6. The results of the fits to the data are consistent with those for simulatedevents, both for the mass scale and the resolution.
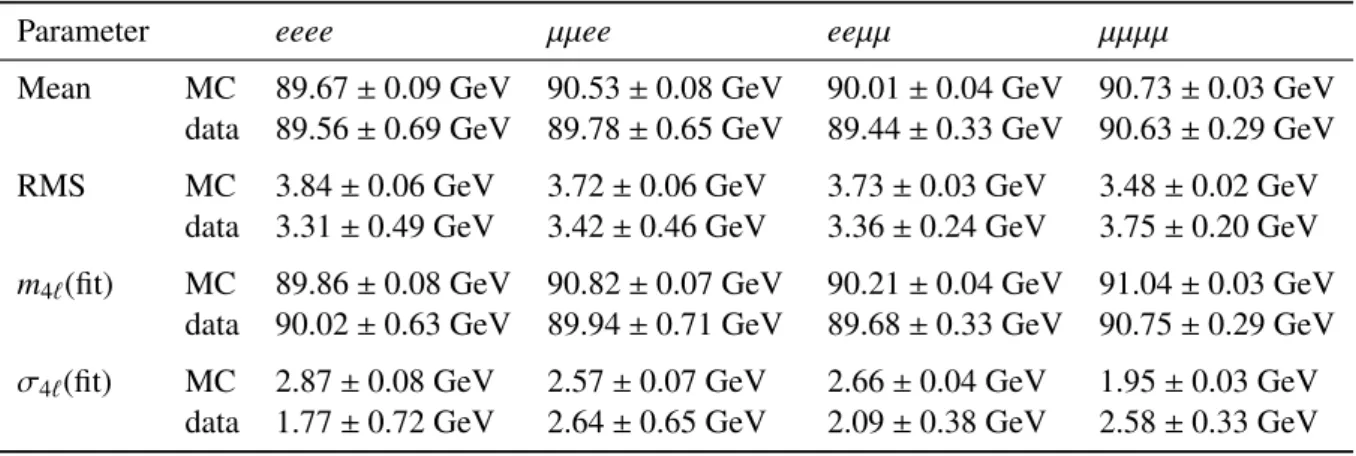
Table 6: A summary of the resulting parameters from fits of the Z
→4` peak in data and MC events shown in Figure
5.Parameter eeee µµee eeµµ µµµµ
Mean MC 89.67
±0.09 GeV 90.53
±0.08 GeV 90.01
±0.04 GeV 90.73
±0.03 GeV data 89.56
±0.69 GeV 89.78
±0.65 GeV 89.44
±0.33 GeV 90.63
±0.29 GeV RMS MC 3.84
±0.06 GeV 3.72
±0.06 GeV 3.73
±0.03 GeV 3.48
±0.02 GeV
data 3.31
±0.49 GeV 3.42
±0.46 GeV 3.36
±0.24 GeV 3.75
±0.20 GeV m
4`(fit) MC 89.86
±0.08 GeV 90.82
±0.07 GeV 90.21
±0.04 GeV 91.04
±0.03 GeV
data 90.02
±0.63 GeV 89.94
±0.71 GeV 89.68
±0.33 GeV 90.75
±0.29 GeV σ
4`(fit) MC 2.87
±0.08 GeV 2.57
±0.07 GeV 2.66
±0.04 GeV 1.95
±0.03 GeV
data 1.77
±0.72 GeV 2.64
±0.65 GeV 2.09
±0.38 GeV 2.58
±0.33 GeV
[GeV]
M4l
80 85 90 95 100
Events / 1 GeV
10 20 30 40
ATLAS Preliminary
∫Ldt = 20.6 fb-1 = 8 TeV s
µ-
µ+
µ-
µ+
→ Z/Z*Z*
0.29
± Mean = 90.63
0.20
± RMS = 3.75
0.29
± = 90.75 m4l
0.33
± = 2.58 σ4l
[GeV]
M4l
80 85 90 95 100
Events / 1 GeV
1000 2000 3000
4000 ATLAS Simulation
= 8 TeV s
µ-
µ+
µ-
µ+
Z/Z*Z*→ Preliminary
0.03 Mean = 90.73 ±
0.02 RMS = 3.48 ±
0.03 = 91.04 ± m4l
0.03 = 1.95 ± σ4l
(a) (b)
[GeV]
M4l
80 85 90 95 100
Events / 1 GeV
5 10 15 20
25 ATLAS Preliminary
∫Ldt = 20.6 fb-1 = 8 TeV s
µ-
µ+
e-
e+
→ Z/Z*Z*
0.33
± Mean = 89.44
0.24
± RMS = 3.36
0.33
± = 89.68 m4l
0.38
± = 2.09 σ4l
[GeV]
M4l
80 85 90 95 100
Events / 1 GeV
500 1000 1500 2000
ATLAS Simulation
= 8 TeV s
µ-
µ+
e-
e+
Z/Z*Z*→ Preliminary
0.04 Mean = 90.01 ±
0.03 RMS = 3.73 ±
0.04 = 90.21 ± m4l
0.04 = 2.66 ± σ4l
(c) (d)
Figure 5: Four-lepton invariant mass distributions, fitted with the convolution of a Breit-Wigner and a Gaussian distribution, for the reconstructed events within the Z mass window of 80 to 100 GeV using (a) 4µ data, (b) simulated Z
→4µ, (c) eeµµ data, and (c) simulated Z
→eeµµ, all for 8 TeV
/2012 only.
This uses relaxed requirements, including M
Z2> 1 GeV, as described in Section
6.4. The parameterm
4lis the fit mean and σ
4lis the standard deviation of the Gaussian component of the fit.
[GeV]
M4l
80 85 90 95 100
Events / 1 GeV
2 4 6 8
ATLAS Preliminary
∫Ldt = 20.6 fb-1 = 8 TeV s
e-
e+
µ-
µ+
→ Z/Z*Z*
0.65
± Mean = 89.78
0.46
± RMS = 3.42
0.71
± = 89.94 m4l
0.65
± = 2.64 σ4l
[GeV]
M4l
80 85 90 95 100
Events / 1 GeV
200 400 600 800 1000
ATLAS Simulation
= 8 TeV s
e-
e+
µ-
µ+
Z/Z*Z*→ Preliminary
0.08 Mean = 90.53 ±
0.06 RMS = 3.72 ±
0.07 = 90.82 ± m4l
0.07 = 2.57 ± σ4l
(a) (b)
[GeV]
M4l
80 85 90 95 100
Events / 1 GeV
2 4 6 8
10 ATLAS Preliminary
∫Ldt = 20.6 fb-1 = 8 TeV s
e-
e+
e-
e+
Z/Z*Z*→
0.69 Mean = 89.56 ±
0.49 RMS = 3.31 ±
0.63
± = 90.02 m4l
0.72
± = 1.77 σ4l
[GeV]
M4l
80 85 90 95 100
Events / 1 GeV
200 400 600 800
ATLAS Simulation
= 8 TeV s
e-
e+
e-
e+
Z/Z*Z*→ Preliminary
0.09 Mean = 89.67 ±
0.06 RMS = 3.84 ±
0.08 = 89.86 ± m4l
0.08 = 2.87 ± σ4l
(c) (d)
Figure 6: Four-lepton invariant mass distributions, fitted with the convolution of a Breit-Wigner and a
Gaussian distribution, for the reconstructed events within the Z mass window of 80 to 100 GeV using (a)
µµee data, (b) simulated Z
→µµee, (c) 4e data, and (c) simulated Z
→4e, all for 8 TeV
/2012 only. This
uses relaxed requirements, including M
Z2> 1 GeV, as described in Section
6.4. The parameterm
4lis the
fit mean and σ
4lis the standard deviation of the Gaussian component of the fit.
7 Conclusions
The first cross-section measurements of the single resonant Z boson decays to four leptons in proton- proton collision data collected by the ATLAS detector in 2011 and 2012 are presented. The analysed datasets have an integrated luminosity of 4.6 fb
−1for 2011 data at
√s
=7 TeV and 20.7 fb
−1for 2012 data at
√s
=8 TeV. With all event selection cuts applied, 162 candidates are observed in the mass window of 80 to 100 GeV, 21 events from the 2011 dataset and 141 events from the 2012 dataset, consistent with the SM prediction of 169
±12 events.
The total Z
→4` production cross sections measured in the phase-space defined in Table
1are 114
±27 (stat)
±7 (syst)
±2 (lumi) fb at 7 TeV and 150
±13 (stat)
±7 (syst)
±5 (lumi) fb at 8 TeV, which are consistent with the SM predictions of 132.0
±3.0 fb and 153.8
±3.7 fb, respectively. Using a total Z production cross section from theory, a branching fraction of Z
→4` is determined to be (4.2
±0.4)
×10
−6consistent with the SM prediction of (4.37
±0.03)
×10
−6.
The resonant peak from Z
→4` provides a natural “standard candle” for the Higgs boson search via the four lepton decay, H
→ZZ
∗→4`, where a mass measurement is one of the important goals. Thus, fits of the Z
→4` resonant peak in data and MC are compared and found to agree in mass scale and resolution.
References
[1] CMS Collaboration, Observation of Z decays to four leptons with the CMS detector at the LHC,
JHEP1212(2012) 034,arXiv:1210.3844 [hep-ex].[2] ATLAS Collaboration, Measurements of the properties of the Higgs-like boson in the four lepton decay channel with the ATLAS detector using 25 fb
−1of proton-proton collision data, Mar, 2013.
ATLAS-CONF-2013-013.
[3] CMS Collaboration, Properties of the Higgs-like boson in the decay H to ZZ to 4l in pp collisions at
√s
=7 and 8 TeV, Mar, 2013. CMS-PAS-HIG-13-002.
[4] ATLAS Collaboration, Observation of a new particle in the search for the Standard Model Higgs boson with the ATLAS detector at the LHC, 2012.
Physics Letters B716(2012) no. 1, 1 – 29.[5] CMS Collaboration, Observation of a new boson at a mass of 125 GeV with the CMS experiment at the LHC, 2012.
Physics Letters B716(2012) no. 1, 30 – 61.[6] J. M. Campbell and R. K. Ellis, An update on vector boson pair production at hadron colliders, Phys. Rev.
D 60(1999) 113006,
arXiv:hep-ph/9905386.[7] J. M. Campbell, R. K. Ellis, and C. Williams, Vector boson pair production at the LHC, JHEP
07(2011) 018,
arXiv:1105.0020 [hep-ph].[8] T. Melia, P. Nason, R. Rontsch, and G. Zanderighi, W
+W
−, WZ and ZZ production in the POWHEG BOX,
JHEP1111(2011) 078,arXiv:1107.5051 [hep-ph].[9] S. Alioli, P. Nason, C. Oleari, and E. Re, A general framework for implementing NLO calculations in shower Monte Carlo programs: the POWHEG BOX,
JHEP1006(2010) 043,arXiv:1002.2581 [hep-ph].
[10] S. Frixione, P. Nason, and C. Oleari, Matching NLO QCD computations with Parton Shower
simulations: the POWHEG method,
JHEP0711(2007) 070,arXiv:0709.2092 [hep-ph].[11] P. Nason, A New method for combining NLO QCD with shower Monte Carlo algorithms,
JHEP 0411(2004) 040,arXiv:hep-ph/0409146 [hep-ph].[12] H.-L. Lai, M. Guzzi, J. Huston, Z. Li, P. M. Nadolsky, et al., New parton distributions for collider physics,
Phys.Rev.D82(2010) 074024,arXiv:1007.2241 [hep-ph].[13] ATLAS Collaboration, ATLAS experiment at the CERN Large Hadron Collider, 2008.
JINST3 (2008) S08003.[14] ATLAS Collaboration, Improved luminosity determination in pp collisions at sqrt(s)
=7 TeV using the ATLAS detector at the LHC,
arXiv:1302.4393 [hep-ex]. submitted to Eur. Phys. J. C.[15] T. Sjostrand, S. Mrenna, and P. Z. Skands, PYTHIA 6.4 Physics and Manual, JHEP
05(2006) 026,
arXiv:hep-ph/0603175.[16] S. Frixione and B.R. Webber, Matching NLO QCD computations and parton shower simulations, JHEP
0206(2002) 029,
arXiv:hep-ph/0204244.[17] M. L. Mangano et al., ALPGEN, a generator for hard multiparton processes in hadronic collisions, JHEP
07(2003) 001,
arXiv:hep-ph/0206293.[18] T. Gleisberg et al., Event generation with SHERPA 1.1, JHEP
02(2009) 007,
arXiv:0811.4622 [hep-ph].[19] ATLAS Collaboration, The ATLAS simulation infrastructure, Eur. Phys. J.
C 70(2010) 823–874,
arXiv:1005.4568 [physics.ins-det].[20] S. Agostinelli et al., Geant4 – a simulation Toolkit,
Nucl. Instrum. Meth.A506(2003) 250.[21] A. D. Martin, W. J. Stirling, R. S. Thorne, and G. Watt, Parton distributions for the LHC,
Eur.Phys. J.C63(2009) 189,arXiv:0901.0002 [hep-ph].
[22] F. James, MINUIT - function minimization and error analysis, CERN Program Library entry
D506, 1998.
A Extra Figures
[GeV]
m4e
70 75 80 85 90 95 100 105
Events / 3 GeV
2 4 6 8 10 12 14 16
18 ATLAS Preliminary
= 7 TeV:
s = 8 TeV:
s
∫
∫
Ldt = 4.6 fb-1
Ldt = 20.7 fb-1
Data(*)
ZZ t Z+jets,t
[GeV]
µ
m4
70 75 80 85 90 95 100 105
Events / 3 GeV
20 40 60 80 100 120 140
ATLAS Preliminary
= 7 TeV:
s = 8 TeV:
s
∫
∫
Ldt = 4.6 fb-1
Ldt = 20.7 fb-1
Data(*)
ZZ t Z+jets,t
(a) (b)
[GeV]
µ
m2e2
70 75 80 85 90 95 100 105
Events / 3 GeV
10 20 30 40 50 60 70
80 ATLAS Preliminary
= 7 TeV:
s = 8 TeV:
s
∫
∫
Ldt = 4.6 fb-1
Ldt = 20.7 fb-1
Data(*)
ZZ t Z+jets,t
[GeV]
µ2e
m2
70 75 80 85 90 95 100 105
Events / 3 GeV
5 10 15 20
25 ATLAS Preliminary
= 7 TeV:
s = 8 TeV:
s
∫
∫
Ldt = 4.6 fb-1
Ldt = 20.7 fb-1
Data(*)
ZZ t Z+jets,t
(c) (d)
Figure 7: The invariant mass of four leptons near the Z
→4` peak using loosened selections as in Section
6.4. The data are shown for (a) the 4echannel, (b) the 4µ channel, (c) the eeµµ channel, and (d) the µµee channel for
√s
=8 TeV and
√s
=7 TeV combined. These appeared in the recent
H
→ZZ
∗→4` conference note [2].
[GeV]
m4l
70 75 80 85 90 95 100 105
Events / 3 GeV
20 40 60 80 100 120 140 160 180 200
220 ATLAS Preliminary
∫
Ldt = 20.7 fb-1 = 8 TeV sData(*)
ZZ t Z+jets,t
[GeV]
m4l
70 75 80 85 90 95 100 105
Events / 3 GeV
5 10 15 20 25 30 35 40
45 ATLAS Preliminary
∫
Ldt = 4.6 fb-1 = 7 TeV sData(*)
ZZ t Z+jets,t
(a) (b)
[GeV]
m
4l70 75 80 85 90 95 100 105
Events / 3 GeV
50 100 150 200 250
ATLAS Preliminary
= 7 TeV:
s
= 8 TeV:
s
∫
∫
Ldt = 4.6 fb-1
Ldt = 20.7 fb-1