A TLAS-CONF-2016-043 19/08/2016
ATLAS NOTE
ATLAS-CONF-2016-043
19th August 2016
Measurement of W ± Z boson pair-production in pp collisions at
√ s = 13 TeV with the ATLAS Detector and confidence intervals for anomalous triple gauge boson couplings
The ATLAS Collaboration
Abstract
A measurement of the W ± Z production cross section, in proton-proton collisions at a centre- of-mass energy of 13 TeV at the Large Hadron Collider, is presented. The data used were recorded with the ATLAS detector in 2015 and 2016, and corresponds to an integrated lu- minosity of 13.3 fb −1 . Only leptonic decay channels, where the gauge bosons decay to either electrons or muons, are considered. The differential cross section is measured as a function of the transverse momentum of the reconstructed Z boson and of the transverse mass of the W ± Z system. Confidence intervals for anomalous triple gauge boson couplings are derived from the transverse mass spectrum of the W ± Z system.
c
2016 CERN for the benefit of the ATLAS Collaboration.
Reproduction of this article or parts of it is allowed as specified in the CC-BY-4.0 license.
1 Introduction
This note presents the measurement of the differential W ± Z production cross-section as a function of transverse momentum p T of the Z boson, p Z T , and the transverse mass of the W ± Z system, m WZ T , and con- fidence intervals for the anomalous triple gauge couplings (aTGC). The results are obtained by analyzing proton-proton (pp) collisions at a centre-of-mass energy of √
s = 13 TeV, collected with the ATLAS experiment at the Large Hadron Collider (LHC). These distributions and confidence intervals were never reported before at this energy. The analysed dataset was collected during 2015 and 2016 and corresponds to an integrated luminosity of 13.3 fb −1 .
The study of the production of pairs of W ± and Z bosons is a direct test of their self-interactions with the measurement of their triple gauge couplings and provides a way to access in a model independent way physics beyond the Standard Model (SM) in a wide energy range. Even if the new phenomena involve the presence of objects that can only be produced beyond the reach of the LHC, it can nevertheless induce changes in the gauge boson couplings.
Measurements of W ± Z production at √
s = 13 TeV based on the dataset collected in 2015 were reported by the ATLAS [1] and CMS [2] collaborations. Other measurements in pp collisions, at centre-of-mass energies of 7 TeV and 8 TeV, have been reported by both ATLAS [3, 4] and CMS experiments [5]. Limits on anomalous charged-current gauge couplings were reported previously by LEP, Tevatron, and LHC experiments [3–12].
2 ATLAS detector
The ATLAS detector [13] is a multi-purpose detector with a cylindrical geometry 1 and nearly 4π coverage in solid angle. The collision point is surrounded by inner tracking detectors (collectively referred to as the inner detector), followed by a superconducting solenoid providing a 2 T axial magnetic field, a calorimeter system and a muon spectrometer.
The inner detector (ID) provides precise measurements of charged-particle tracks in the pseudorapidity range |η| < 2.5. It consists of three subdetectors arranged in a coaxial geometry around the beam axis: a silicon pixel detector, a silicon microstrip detector and a transition radiation tracker. The newly installed innermost layer of pixel sensors [14, 15] was operational for the first time during the 2015 data taking.
The electromagnetic calorimeter covers the region |η| < 3.2 and is based on a high-granularity, lead/liquid- argon (LAr) sampling technology. The hadronic calorimeter uses a steel/scintillator-tile detector in the region |η| < 1.7 and a copper / LAr detector in the region 1.5 < |η| < 3.2. The most forward region of the detector, 3.1 < |η| < 4.9, is equipped with a forward calorimeter, measuring electromagnetic and hadronic energies in copper/LAr and tungsten/LAr modules.
The muon spectrometer (MS) comprises separate trigger and high-precision tracking chambers to measure the deflection of muons in a magnetic field generated by three large superconducting toroids arranged with an eightfold azimuthal coil symmetry around the calorimeters. The high-precision chambers cover
1
ATLAS uses a right-handed coordinate system with its origin at the nominal interaction point (IP) in the centre of the detector
and the z-axis along the beam direction. The x-axis points from the IP to the centre of the LHC ring, and the y-axis points
upward. Cylindrical coordinates (r, φ) are used in the transverse (x, y) plane, φ being the azimuthal angle around the beam
direction. The pseudorapidity is defined in terms of the polar angle θ as η = −ln[tan(θ/2)].
a range of |η| < 2.7. The muon trigger system covers the range |η| < 2.4 with resistive-plate chambers in the barrel and thin-gap chambers in the endcap regions.
A two-level trigger system is used to select events in real time. It consists of a hardware-based first-level trigger and a software-based high-level trigger. The latter employs algorithms similar to those used offline to identify electrons, muons, photons and jets.
3 Phase space definition
The W ± Z cross section is measured in the fiducial phase space that is defined to closely follow the se- lection criteria of the signal region described in Section 5. The phase space is based on the kinematics of the final-state leptons associated with the W ± and Z boson decays. Leptons produced in the decay of a hadron, a τ, or their descendants are not considered in the definition of the fiducial phase space.
In the simulation, the kinematics of the charged lepton after quantum electrodynamics (QED) final-state radiation (FSR) are “dressed” at particle level by including contributions from photons with an angular distance ∆ R ≡ p
( ∆ η) 2 + ( ∆ φ) 2 < 0.1 from the lepton. Dressed leptons, and final-state neutrinos that do not originate from hadron or τ decays, are matched to the W ± and Z boson decay products using a Monte Carlo (MC) generator-independent algorithmic approach, called the “resonant shape” algorithm [4].
The reported cross sections are measured in a fiducial phase space defined at particle level by the following requirements: the transverse momentum p T of the charged leptons from the Z boson decay is above 15 GeV, the p T of the charged lepton from the W ± decay is above 20 GeV, the absolute value of the pseudorapidity of the charged leptons from the W ± and Z bosons is below 2.5, the invariant mass of the two leptons from the Z boson decay differs at most by 10 GeV from the world average value of the Z boson mass m PDG Z [16]. The W transverse mass, defined as m W T = q
2 · p ν T · p ` T · [1 − cos ∆ φ(`, ν)], where
∆ φ(`, ν) is the angle between the lepton and the neutrino in the transverse plane, is required to be above 30 GeV. In addition, the angular distance ∆ R between the charged leptons from the W ± and Z decay is required to be larger than 0.3, and the ∆ R between the two leptons from the Z decay to be larger than 0.2.
4 Simulated event samples
Samples of simulated W ± Z events are used to correct the signal yield for detector e ff ects, to extrapolate from the fiducial to the total phase space, and to compare the measurements to the theoretical predictions.
The production of W ± Z pairs and the subsequent leptonic decays of the vector bosons are generated at NLO in QCD using the P owheg -B ox v2 [17–20] MC generator, interfaced to the P ythia 8.210 parton shower model using the AZNLO [21] set of tuned parameters. The CT10 [22] PDF set is used for the hard- scattering process, while the CTEQ6L1 [23] PDF set is used for the parton shower. The measurement is also compared to the theoretical NLO prediction from the S herpa 2.1.1 generator [24], calculated using the CT10 PDF set in conjunction with a dedicated set of tuned parameters for the parton shower developed by the Sherpa authors [25]. Signal events with aTGCs are generated at NLO with the MC@NLO 4.0 [26]
MC generator interfaced to the H erwig [27] parton shower model, using the CT10 PDF set. The number
of signal W ± Z events predicted by the MC generators at reconstructed level is scaled by 1.11 to account
for the recent calculations of W ± Z production at NNLO QCD [28].
The background sources to the W ± Z production include processes with two or more electroweak gauge bosons, namely ZZ, WW and VVV (V = W , Z); processes with top quarks, such as t¯ t and t¯ tV, single top and tZ; or processes with gauge bosons associated with jets or photons (Z + jets, Zγ and Wγ). Background events containing three or more prompt leptons are modelled using MC simulation. The remaining back- ground sources are evaluated using data-driven techniques and simulated events are used to assess the systematic uncertainties in these backgrounds. The q q ¯ → ZZ (∗) , t¯ t, and single-top processes are gen- erated at NLO using the P owheg -B ox v2 program. The CT10 PDF set is used for the matrix-element calculations. For the ZZ process the parton shower is modelled with Pythia 8.186, using the CTEQ6L1 PDF and AZNLO set of tuned parameters. The modelling of the parton shower for processes with top quarks is done with P ythia 6.428 [29], using the CTEQ6L1 PDF and Perugia 2012 [30] set of tuned para- meters. The Sherpa [24, 25, 31–34] event generator is used to model the Zγ, Wγ, VVV, and gg → ZZ (∗) processes at leading order (LO) using the CT10 PDF set. Finally, the t¯ tV and tZ processes are generated at LO using M ad G raph 5_aMC@NLO [35] with the NPDF23LO [36] PDF set, interfaced with P ythia 8.186 (t¯ tV) and Pythia 6.428 (tZ).
The generated MC samples are passed through the ATLAS detector simulation [37] based on GEANT4 [38].
Multiple overlaid proton-proton collisions (pile-up) are simulated with the soft QCD processes of Py- thia 8.186 [39] using the MSTW2008LO PDF [40] and the A2 [41] set of tuned parameters. The MC events are weighted to reproduce the distribution of the average number of interactions per pp bunch crossing observed in the data. Scale factors are applied to simulated events to correct for the small di ff er- ences between data and MC simulation in the trigger, reconstruction, identification, isolation and impact parameter e ffi ciencies of electrons and muons [42–44]. Furthermore, the electron energy and muon mo- mentum in simulated events are smeared to account for small di ff erences in resolution between data and MC [44, 45].
5 Data sample and selection
The data sample analysed corresponds to an integrated luminosity of 13.3 fb −1 collected with the ATLAS detector in 2015 and 2016 at √
s = 13 TeV. Only data recorded with stable beam conditions and with all relevant detector subsystems operational are considered. Candidate events are selected using single lepton triggers [46]. The transverse momentum threshold required by triggers in 2015 is 24 GeV for electrons and 20 GeV for muons satisfying a loose isolation requirement. Due to the higher instantaneous luminosity in 2016 the trigger threshold is increased to 26 GeV for both electrons and muons and tighter isolation requirements are applied. Possible inefficiencies for leptons with large transverse momenta are reduced by using additional triggers that do not include any isolation requirements. The transverse momentum thresholds for these triggers are p T = 60 GeV and 50 GeV for electrons and muons respectively. Finally, a single-electron trigger requiring p T > 120 GeV (in 2015) and p T > 140 GeV (in 2016) with less restrictive electron identification criteria is used to increase the selection e ffi ciency for high- p T electrons.
Events are required to have a primary vertex reconstructed from at least two charged particle tracks and compatible with the luminous region. If several such vertices are present in the event, the one with the highest sum of the p 2 T of the associated tracks is selected as the primary vertex of the W ± Z production.
Muon candidates are identified by tracks reconstructed in the muon spectrometer and matched to tracks
reconstructed in the inner detector. Muons are required to pass a “medium” identification selection based
on the number of hits in the ID and the MS [44]. The efficiency of this selection averaged over p T and η
is larger than 98%. The muon momentum is calculated by combining the MS measurement, corrected for
the energy deposited in the calorimeters, and the ID measurement. The p T of the muon must be greater than 15 GeV and its pseudorapidity must satisfy |η| < 2.5.
Electron candidates are reconstructed from energy clusters in the electromagnetic calorimeter matched to inner detector tracks. Electrons are identified using a discriminant that is the value of a likelihood function constructed with information from the shape of the electromagnetic showers in the calorimeter, track properties and track-to-cluster matching quantities of the candidate [42]. Electrons must satisfy a “medium” likelihood requirement, which provides an overall identification efficiency of 90%. The electron momentum is computed from the cluster energy and the direction of the track. The p T of the electron must be greater than 15 GeV and the pseudorapidity of the cluster must be in the ranges |η| < 1.37 or 1.52 < |η| < 2.47.
Electron and muon candidates are required to originate from the primary vertex. Thus, the significance of the track’s transverse impact parameter calculated with respect to the beam line, |d 0 /σ d
0|, must be less than three for muons and less than five for electrons, and the longitudinal impact parameter, z 0 (the di ff erence between the value of z of the point on the track at which d 0 is defined and the longitudinal position of the primary vertex), is required to satisfy |z 0 · sin(θ)| < 0.5 mm.
Electrons and muons are required to be isolated from other particles. The isolation requirement is based on both calorimeter and track information and is tuned for an e ffi ciency of at least 95% for p T > 25 GeV and at least 99% for p T > 60 GeV [44].
Jets are reconstructed from clusters of energy deposits in the calorimeter [47] using the anti-k t algorithm [48]
with a radius parameter R = 0.4. Events with jets arising from detector noise or other non-collision sources are discarded [49]. All jets must have p T > 25 GeV and be reconstructed in the pseudorapidity range |η| < 4.5. A multivariate combination of track-based variables is used to suppress jets originating from pile-up in the ID acceptance [50]. The energy of jets is calibrated and corrected for detector e ff ects using a combination of simulated events and in situ methods in 13 TeV data, similar to the procedure described in Ref. [51]. In the measurement presented, jets are used for the reconstruction of the missing transverse momentum in the event, E T miss , and for resolving an overlap ambiguity for cases when lepton and jet candidates share the same detector information.
The transverse momentum of the neutrino is estimated from the E T miss , calculated as the negative vector sum of the transverse momentum of all identified hard physics objects (electrons, muons, jets), as well as an additional “soft term”. A track-based measurement of the soft term [52], which accounts for low-p T
tracks not assigned to a hard object, is used in the analysis.
Events are required to contain exactly three lepton candidates satisfying the selection criteria described above. To ensure that the trigger efficiency is well determined, at least one of the candidate leptons is required to have p T > 25 GeV for the 2015 sample and p T > 27 GeV for 2016 and to be geometrically matched to a lepton that was selected by the trigger.
Candidate events are required to have at least one pair of leptons of the same flavour and of opposite charge, with an invariant mass that is consistent with the nominal Z boson mass [16] to within 10 GeV.
This pair is considered to be the Z boson candidate. If more than one pair can be formed, the pair whose invariant mass is closest to the nominal Z boson mass is taken as the Z boson candidate. The remaining third lepton is assigned to the W ± boson decay. The transverse mass of the W ± candidate, computed using E T miss and the p T of the associated lepton, is required to be greater than 30 GeV.
To suppress background processes with at least four prompt leptons, events with a fourth lepton candidate
satisfying looser selection criteria are rejected. For this looser selection, the p T of the leptons is lowered
to p T > 7 GeV and “loose” identification requirements are used for both the electrons and muons. The isolation requirement uses ID track information only and is less stringent.
Backgrounds originating from jets misidentified as leptons or non-prompt leptons are suppressed by re- quiring the lepton associated with the W ± boson to satisfy more stringent selection criteria. The transverse momentum of these leptons is required to be greater than 20 GeV. Furthermore, electrons associated with the W ± boson decay are required to pass the “tight” likelihood identification requirement [42], which has an overall efficiency of 85%. Finally, these electrons must also pass a tighter isolation requirement, tuned for an efficiency of at least 90% (99%) for p T > 25 (60) GeV.
6 Background estimation
The background sources are classified into two groups: the “reducible background” where at least one of the candidate leptons is not a prompt lepton, or is a jet misidentified as a lepton, or is an electron from photon conversion, such candidates are further distinguished as “non-prompt” or “fake” leptons, and the
“irreducible background” where all candidates are genuine prompt leptons.
The reducible background originates from Z +jets, Zγ, Wγ, t¯ t, and WW production processes. This back- ground is estimated with a data-driven method based on the inversion of a global matrix containing the e ffi ciencies and the misidentification probabilities for prompt and fake leptons. This contribution repres- ents about half of the total backgrounds. About 2% of this background contribution arises from events with two fake leptons. The background from events with three fake leptons, e.g., from multijet processes, is negligible.
The matrix method [53] is a data-driven method for the calculation of the reducible background which exploits the classification of the leptons as loose (L) or tight (T) candidates and the probability that a fake or a non-prompt lepton is misidentified as a loose or tight lepton.
Three-lepton events in the W ± Z data sample, selected as described in Section 5, but relaxing some of the lepton identification criteria, are classified into eight categories. Each category contains a number of events, N αβγ , where the first index refers always to the W ± lepton, the second to the Z leading lepton, and the third to the Z trailing lepton. Each index can be L or T depending on whether the corresponding lepton met only the loose identification criteria or satisfied the tight ones. Loose leptons are leptons that survive the overlap removal procedure but do not meet the isolation requirements and have relaxed identification criteria, while tight leptons are signal leptons as defined in Section 5. These eight categories are called identification categories here. The number of events in each category, N αβγ , is measured directly in data.
The “true categories” are approximated from the above eight identification categories in W ± Z data and are the result of the matrix method calculation. These categories contain the number of events, N i jk , where each index is ordered as described above and represents the prompt (R) or non-prompt (F) leptons in the events.
The number of events, N αβγ , in each identification category is related to the number of events N i jk of the
true categories by an 8 × 8 matrix expressed in terms of the probability that a prompt lepton is identified
as a tight (loose) lepton, denoted here by e (¯ e = 1 − e), and the probability that a fake or a non-prompt
lepton is misidentified as a tight (loose) lepton, denoted here by f ( ¯ f = 1 − f ). The matrix is reduced to
a 7 × 7 matrix since the category N FFF can be neglected as the number of events with three fake or non- prompt leptons is more than two orders of magnitude smaller than the ones with only one or even two such leptons. The value of f is small, therefore terms with order higher than two in f can be neglected. It has been verified that these simplifications do not change the final result.
The matrix is inverted to obtain the number of events with at least one fake or non-prompt lepton, which represents the amount of reducible background in the W ± Z sample, N reducible :
N reducible = N TTL red. F 3 + N TLT red. F 2 + N LTT red. F 1 − N TLL red. F 2 F 3 − N LTL red. F 1 F 3 − N LLT red. F 1 F 2 , (1) where N αβγ red. = N αβγ − N irr. αβγ , F i = f f ¯
ii
, and the index i = 1, 2, 3 refers to the W ± lepton, the Z leading lepton and the Z trailing lepton, respectively. The value of N αβγ is obtained by counting the number of W ± Z events in the selected data sample with leptons satisfying the loose or tight criteria. The variable N αβγ irr.
represents the number of events with three prompt leptons in the corresponding identification category αβγ and is estimated using MC simulation. The values of F i are measured di ff erentially as a function of the lepton transverse momentum, using W +jets or Z +jets control samples taken from data for F 1 or for F 2 and F 3 , respectively. The efficiencies e(¯ e) do not appear in Eq. (1) since they are included in the N αβγ irr.
term.
The control samples and the reducible background in the W ± Z sample are composed of events with fake or non-prompt leptons from light- or heavy-flavor jets and from photon conversions. The data- driven estimates of the F i factors correspond to an average value weighted by the abundance of each kind of background and may vary depending on the composition of the sample used to extract them.
For this reason, data samples enriched in the di ff erent types of background have been used to verify that the background composition in the above-mentioned W + jets and Z + jets control samples is the same, within uncertainties, as in the signal region. This background constitutes approximately 60% of the total background and is shown in Table 2 as “Misid. leptons”.
Irreducible background events originate from ZZ, t¯ t + V, VVV (where V = Z or W) and tZ events. The amount of irreducible background is estimated using MC simulations. About 70% of the irreducible background is due to ZZ production. Events from ZZ production survive the W ± Z event selection either because one lepton falls outside the fiducial volume or because it falls in the fiducial acceptance of the detector but is not identified. The number of q q ¯ → ZZ events predicted by Powheg is scaled by 1.08 to account for NNLO QCD and NLO EW corrections [54–56]. The number of gg → ZZ events predicted by the S herpa MC event sample is scaled by a factor of 1.52 to account for NLO QCD corrections [57].
These estimates are validated by comparing the MC predictions with the observed event yield, and the distributions of several kinematic variables, in a four-lepton data sample enriched in ZZ events. Overall agreement between the data and the predictions is within one standard deviation of the experimental uncertainty. The shapes of the distributions of the main kinematic variables are also found to be well described by the MC predictions. W ± Z events in which at least one of the bosons decays into leptons via an intermediate τ decay are not treated as part of the signal and a correction computed using simulation is applied to the measurement to account for the τ-lepton contribution to the analysis phase space.
7 Systematic uncertainties
The systematic uncertainties in the measured cross sections arise from theoretical sources, from the un-
certainties in the correction procedure for detector e ff ects and uncertainties related to the background
estimation and the luminosity.
The theoretical systematic uncertainties on the W ± Z signal modelling are related to the choice of PDF set, to the QCD renormalisation µ R and factorisation µ F scales and to the parton showering simulation. The uncertainties due to the choice of PDF are computed using the CT10 eigenvectors and the envelope of the di ff erences between the CT10 and CT14 [58], MMHT2014 [59] and NNPDF 3.0 [60] PDF sets, according to the PDF4LHC recommendations [61]. The QCD scale uncertainties are estimated by varying µ R and µ F by factors of two around the nominal scale m WZ /2 with the constraint 0.5 ≤ µ R /µ F ≤ 2, where m WZ is the invariant mass of the W ± Z system. Uncertainties arising from the choice of parton shower model are obtained from Ref. [4].
The uncertainty in the unfolded distributions arising from the MC modelling of the response matrix in the unfolding procedure is estimated by reweighting the simulated events at particle level to match the unfolded results obtained as described in Section 8. An alternative response matrix is defined us- ing these reweighted MC events and is used to unfold the P owheg+ P ythia reconstructed events. The systematic uncertainty is estimated by comparing this unfolded distribution to the original particle-level P owheg+ P ythia prediction. The size of this uncertainty is at most 5%.
The experimental systematic uncertainty in the unfolding procedure includes uncertainties in the scale and resolution of the electron energy, muon momentum, jet energy and E T miss , as well as uncertainties in the scale factors applied to the simulation in order to reproduce the trigger, reconstruction, identification and isolation e ffi ciencies measured in data. The uncertainties in the jet energy scale are obtained from √
s = 13 TeV simulations and in situ measurements, similar to the ones described in Ref. [51]. The uncertainty in the jet energy resolution is derived by extrapolating measurements in Run-1 data to √
s = 13 TeV.
The uncertainty in the E miss T is estimated by propagating the uncertainties in the transverse momenta of hard physics objects and by applying momentum scale and resolution uncertainties to the track-based soft term. The uncertainty associated with pile-up modelling is of the order of 1%.
The dominant contribution among the experimental systematic uncertainties in the eee and µee channels is due to the uncertainty in the electron identification efficiency, contributing at most 4.6% uncertainty to the integrated cross section, while in the eµµ and µµµ channels it originates from the muon reconstruction e ffi ciency and is at most 3.7%. The systematic uncertainties in the measured cross sections are determined by repeating the analysis after applying appropriate variations for each source of systematic uncertainty to the simulated samples.
The systematic uncertainty on the reducible background measurement is dominated by two sources. The first is the uncertainty in the knowledge of the irreducible background contamination in the control regions used for the background determination, dominated by the ZZ component and by the signal contamination, W ± Z, as explained in section 6. This component of uncertainty is conservatively taken from the previous measurement of the W ± Z cross sections at 8 TeV and is set to be 15% [4]. The second component is due to statistical and systematic uncertainties in the estimation of the fake factors, obtained by modifying the control regions and evaluating the corresponding e ff ects on the derived fake factors, and amounts to about 40%. Overall, the reducible background combined uncertainty amounts to ∼ 41%, while its effect on the combined measured cross section is of the order of 3%.
A theoretical uncertainty in the ZZ cross section of 8% [54–57] is assigned as a global uncertainty in the amount of ZZ background predicted by the MC simulation. The overall systematic uncertainty on the irreducible backgrounds contributes between 0.4% and 0.6% to the measured combined cross section.
The uncertainty due to other irreducible background sources is evaluated by propagating the uncertainty
of their MC cross sections. These are 13% (12%) for t¯ tW (t¯ tZ) [35], 20% for VVV [62] and 15% for
tZ [4].
The preliminary uncertainty on the combined 2015 + 2016 integrated luminosity is 2.9%. It is derived, following a methodology similar to that detailed in Refs. [63] and [64], from a preliminary calibration of the luminosity scale using x-y beam-separation scans performed in August 2015 and May 2016. The uncertainty is applied to the signal normalisation as well as to all background contributions that are estimated purely using MC simulations. It has an effect of 3.2% on the measured cross section.
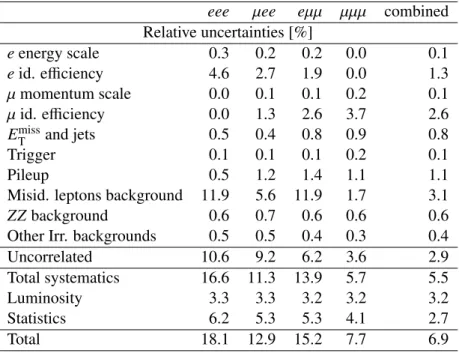
Table 1 shows the statistical uncertainty and main sources of systematic uncertainty in the W ± Z fiducial cross section for each of the four channels and their combination.
eee µee eµµ µµµ combined Relative uncertainties [%]
e energy scale 0.3 0.2 0.2 0.0 0.1
e id. efficiency 4.6 2.7 1.9 0.0 1.3
µ momentum scale 0.0 0.1 0.1 0.2 0.1
µ id. e ffi ciency 0.0 1.3 2.6 3.7 2.6
E miss T and jets 0.5 0.4 0.8 0.9 0.8
Trigger 0.1 0.1 0.1 0.2 0.1
Pileup 0.5 1.2 1.4 1.1 1.1
Misid. leptons background 11.9 5.6 11.9 1.7 3.1
ZZ background 0.6 0.7 0.6 0.6 0.6
Other Irr. backgrounds 0.5 0.5 0.4 0.3 0.4
Uncorrelated 10.6 9.2 6.2 3.6 2.9
Total systematics 16.6 11.3 13.9 5.7 5.5
Luminosity 3.3 3.3 3.2 3.2 3.2
Statistics 6.2 5.3 5.3 4.1 2.7
Total 18.1 12.9 15.2 7.7 6.9
Table 1: Summary of the relative uncertainties in the measured fiducial cross section σ
fid.W±Zfor each channel and for their combination. The uncertainties are reported as percentages. The first rows indicate the main sources of systematic uncertainties for each channel and their combination, which are treated as correlated between channels.
A row with uncorrelated uncertainties follows, which comprise all uncertainties of statistical origin including MC statistics as well as statistical uncertainties on the fake factors calculation, which are uncorrelated between channels.
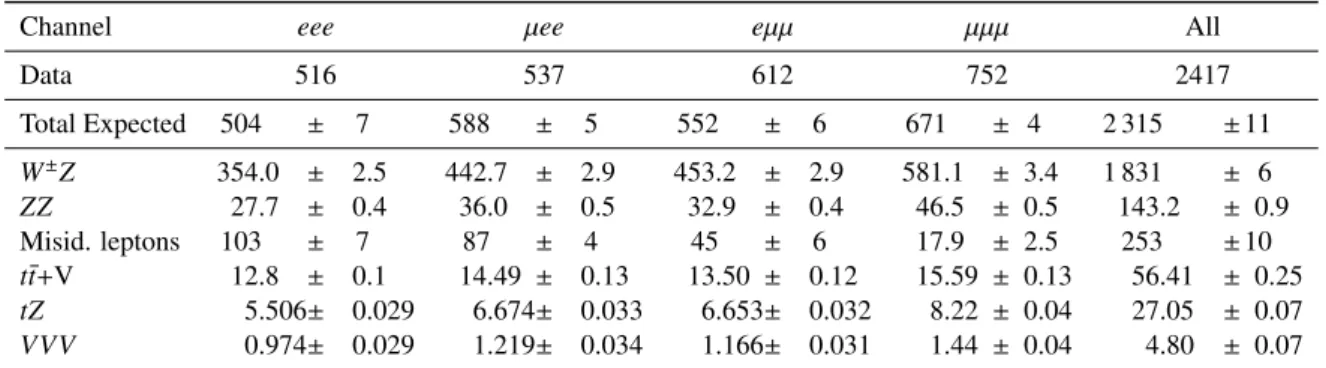
8 Detector-level results and cross-section measurements
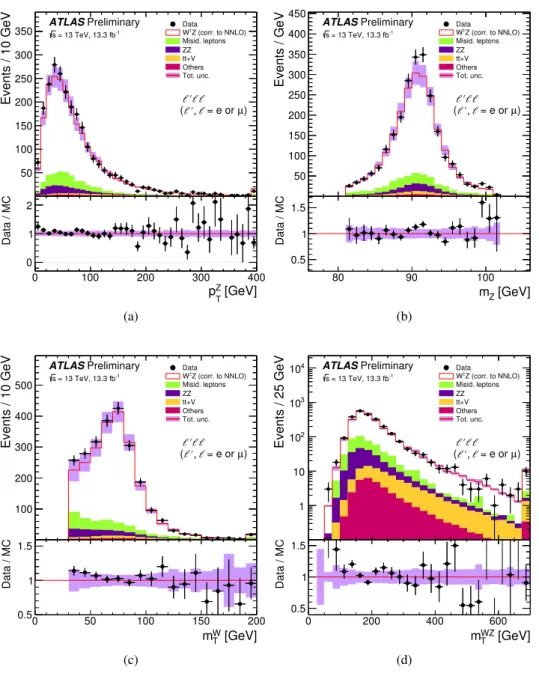
Table 2 summarises the predicted and observed number of events together with the estimated background contributions. Only statistical uncertainties are quoted. Figure 1 shows the measured distributions of the transverse momentum and the invariant mass of the Z candidate, the transverse mass of the W candidate, and for the W ± Z system a variable m WZ T similar to the transverse mass. The variable m WZ T is reconstructed as
m WZ T = v u u t
3
X
` = 1
p ` T + E miss T
2
−
3
X
` = 1
p ` x + E miss x
2
+
3
X
` = 1
p ` y + E y miss
2
. (2)
The Powheg+Pythia MC prediction is used for the W ± Z signal contribution. Figure 1 indicates that the
MC predictions provide a fair description of the shapes of the data distributions. In the above comparisons
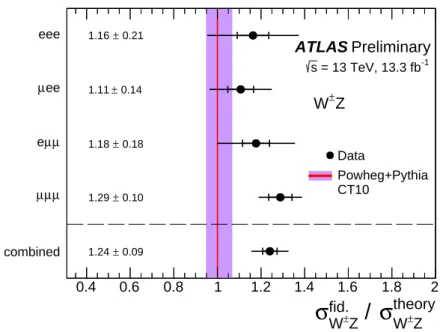
to MC predictions in Table 2 and Figure 1 the signal W ± Z sample is normalised to the NNLO QCD cross section [28]. Furthermore, the fiducial cross section calculation of individual channels and their combination has been performed following the strategy of the W ± Z measurement using 2015 data at 13 TeV [1] and found to be fully consistent with the published results. The measured combined fiducial cross section is σ fid.
W
±Z→`
0ν`` = 66.2 ± 1.8 (stat.) ± 3.6 (sys.) ± 2.1 (lumi.) fb. The ratio of the measured cross sections to the theoretical predictions using P owheg+ P ythia at NLO QCD is shown in Figure 2.
Channel eee µee eµµ µµµ All
Data 516 537 612 752 2417
Total Expected 504 ± 7 588 ± 5 552 ± 6 671 ± 4 2 315 ± 11
W
±Z 354.0 ± 2.5 442.7 ± 2.9 453.2 ± 2.9 581.1 ± 3.4 1 831 ± 6
ZZ 27.7 ± 0.4 36.0 ± 0.5 32.9 ± 0.4 46.5 ± 0.5 143.2 ± 0.9
Misid. leptons 103 ± 7 87 ± 4 45 ± 6 17.9 ± 2.5 253 ± 10
t t ¯ + V 12.8 ± 0.1 14.49 ± 0.13 13.50 ± 0.12 15.59 ± 0.13 56.41 ± 0.25
tZ 5.506± 0.029 6.674± 0.033 6.653± 0.032 8.22 ± 0.04 27.05 ± 0.07
VVV 0.974± 0.029 1.219± 0.034 1.166± 0.031 1.44 ± 0.04 4.80 ± 0.07
Table 2: Observed and expected number of events after the W
±Z inclusive selection described in Section 5 in each of the considered channels and for the sum of all channels. The observed W
±Z events are selected from the dataset collected during 2015 and 2016 that corresponds to an integrated luminosity of 13.3 fb
−1. The expected number of W
±Z events from P owheg+ P ythia and the estimated number of background events from other processes are detailed. The signal W
±Z sample is normalised to NNLO cross section. The uncertainties quoted are only statistical.
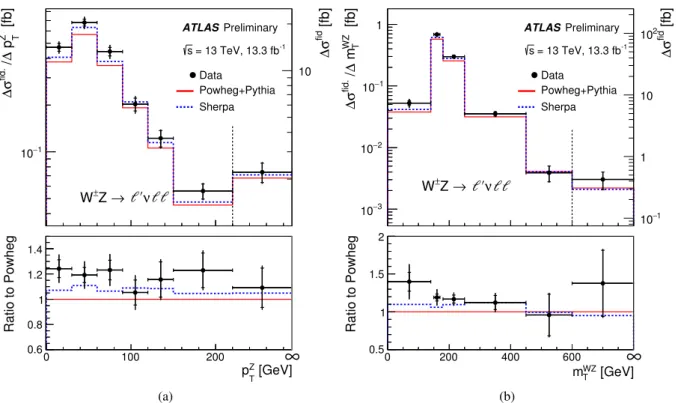
Finally, the differential detector-level distributions of the p Z T and m WZ T are corrected for detector resolution and for QED FSR effects using an iterative Bayesian unfolding method [65, 66]. Simulated signal events from P owheg+ P ythia are used to obtain a response matrix that accounts for bin-to-bin migration e ff ects between the reconstructed and particle-level distribution. The measured differential cross sections as a function of p Z T and m WZ T are presented in Figure 3 and compared to the predictions from P owheg+ P ythia and S herpa . A very good description of the data by the SM predictions is observed.
9 Anomalous triple gauge couplings
Two di ff erent parametrisations are followed to search for e ff ects beyond the SM via anomalous triple gauge couplings. The first makes use of an effective Lagrangian describing the WWZ vertex and includes only terms that separately conserve the charge conjugation (C) and parity (P) quantum numbers [67, 68]. The deviation of the vector boson WWZ couplings from the SM predicted values are introduced as dimensionless anomalous couplings ∆ κ Z , ∆ g Z 1 , and λ Z .
The contribution of anomalous couplings to the W ± Z production cross section grows with the partonic
centre-of-mass energy ˆ s. To avoid violation of unitarity a form factor is introduced to the anomalous
couplings as follows: α( ˆ s) = α(0)/(1 + s/ ˆ Λ 2 co ) 2 , where α(0) is the generic anomalous coupling value at
low energy and Λ co is a cuto ff scale related to the energy at which the e ff ective field theory breaks down
and new physics would be observed.
Events / 10 GeV
50 100 150 200 250 300
350 DataW±Z (corr. to NNLO)
Misid. leptons ZZ tt+V Others Tot. unc.
ℓ′ℓℓ ℓ′,ℓ µ) ( = e or ATLASPreliminary
= 13 TeV, 13.3 fb-1
s
[GeV]
Z
p
T0 100 200 300 400
Data / MC
0 1 2
(a)
Events / GeV
50 100 150 200 250 300 350 400 450
Data Z (corr. to NNLO) W±
Misid. leptons ZZ tt+V Others Tot. unc.
ℓ′ℓℓ ℓ′,ℓ µ) ( = e or ATLASPreliminary
= 13 TeV, 13.3 fb-1
s
[GeV]
m
Z80 90 100
Data / MC
0.5 1 1.5
(b)
Events / 10 GeV
100 200 300 400 500
Data Z (corr. to NNLO) W±
Misid. leptons ZZ tt+V Others Tot. unc.
ℓ′ℓℓ ℓ′,ℓ µ) ( = e or ATLASPreliminary
= 13 TeV, 13.3 fb-1
s
[GeV]
W
m
T0 50 100 150 200
Data / MC
0.5 1 1.5
(c)
Events / 25 GeV
1 10 102
103
104 Data
Z (corr. to NNLO) W±
Misid. leptons ZZ tt+V Others Tot. unc.
ℓ′ℓℓ ℓ′,ℓ µ) ( = e or ATLASPreliminary
= 13 TeV, 13.3 fb-1
s
[GeV]
WZ
m
T0 200 400 600
Data / MC
0.5 1 1.5
(d)
Figure 1: The distributions for the sum of all channels of the kinematic variables (a) the transverse momentum of
the reconstructed Z boson p
ZT, (b) the reconstructed Z boson mass m
Z, (c) the transverse mass of the reconstructed
W boson m
WTand (d) the transverse mass variable m
WZTfor the W
±Z system. The points correspond to the data, and
the histograms correspond to the predictions of the di ff erent SM processes. All MC predictions are scaled to the
integrated luminosity of the data using the predicted MC cross sections of each sample. The sum of the background
processes with fake or non-prompt leptons is labelled “Misid. leptons”. The P owheg+ P ythia MC prediction is
used to model the W
±Z signal contribution. The number of predicted signal events is scaled taking into account the
recent NNLO calculation which results in a factor of 1.11 compared to the NLO total cross section. The open red
histogram shows the total prediction; the shaded violet band is the total uncertainty on this prediction. The last bin
contains the overflow. The lower panels in each figure show the ratio of the data points to the open red histogram
with their respective uncertainties.
theory
±
Z
σ W fid. /
±
Z
σ W
0.4 0.6 0.8 1 1.2 1.4 1.6 1.8 2
combined µ µ µ
µ µ e µ ee
eee ATLAS Preliminary
Data
Powheg+Pythia CT10
= 13 TeV, 13.3 fb
-1s
±
Z W
0.21
± 1.16
0.14
± 1.11
0.18
± 1.18
0.10
± 1.29
0.09
± 1.24
Figure 2: The integrated cross section in the fiducial phase space in each of the four channels and their combination.
The inner and total error bars on data points represent the statistical and the total uncertainties, respectively. The measurement is compared to the prediction from P owheg+ P ythia at NLO QCD.
The second parameterisation is based on an effective field theory (EFT) in which the particle content of the SM is not changed and the theory is extended by adding to the SM Lagrangian a linear combination of operators of mass dimension higher than four [69, 70]. The dimension-six operators are expected to be dominant. There are three independent dimension-six C- and P-conserving operators that can lead to anomalous triple vector boson couplings. The corresponding new terms in the Lagrangian are
O WWW = c WWW
Λ 2 NP Tr[W µν W νρ W ρ µ ] , O W = c W
Λ 2 NP
D µ Φ †
W µν (D ν Φ ) , O B = c B
Λ 2 NP D µ Φ
B µν (D ν Φ) , (3)
where W i j , W i j , W i j (i = µ, ν, j = ν, ρ), and B µν are built from the SM electroweak gauge boson fields, D i (i = µ, ν) are the covariant derivatives as introduced in the SM, and Φ is the Higgs doublet field, as defined in Ref. [70]. The dimensionless coe ffi cients c i (i = WWW , W , B) and Λ NP represent the strength of the new couplings and the energy scale of new physics, respectively. This approach assumes that the effective field theory is valid at energies below the energy scale for new physics, Λ NP .
The e ff ective field theory allows the anomalous couplings to be reinterpreted in terms of the EFT paramet- ers, c i / Λ 2 NP (i = WWW, W , B) [71]. For this reason the two parameterisations can be considered equivalent.
They are both used in this analysis because the first allows a comparison with previous analyses and the
[fb]
Z Tp ∆ /
fid.σ ∆
1
10
−Data
Powheg+Pythia Sherpa ATLASPreliminary
= 13 TeV, 13.3 fb-1
s
ν Z →
W
±ℓ ′ ℓℓ
[fb]
fidσ ∆
10
[GeV]
Z
p
T0 100 200
Ratio to Powheg
0.6 0.8 1 1.2 1.4
∞
(a)
[fb]
WZ Tm ∆ /
fid.σ ∆
3
10
− 210
− 110
−1
Data
Powheg+Pythia Sherpa ATLASPreliminary
= 13 TeV, 13.3 fb-1
s
ν Z →
W
±ℓ ′ ℓℓ
[fb]
fidσ ∆
1
10
−1 10 10
2[GeV]
WZ
m
T0 200 400 600 800
Ratio to Powheg
0.5 1 1.5 2
∞
(b)
Figure 3: The measured W
±Z di ff erential cross section in the fiducial phase space as a function of the the transverse momentum of the reconstructed Z boson p
ZT(a) and the transverse mass variable m
WZTfor the W
±Z system (b).
The inner and outer error bars on the data points represent the statistical and total uncertainties, respectively. The measurements are compared to the prediction from P owheg+ P ythia (red line) and S herpa (dashed blue line) at NLO QCD.
second is a flexible way of parameterising e ff ects beyond the SM in a model-independent way. The free parameters considered in this analysis are therefore ∆ κ Z , ∆ g Z 1 , and λ Z or c i / Λ 2 NP (i = WWW, W , B).
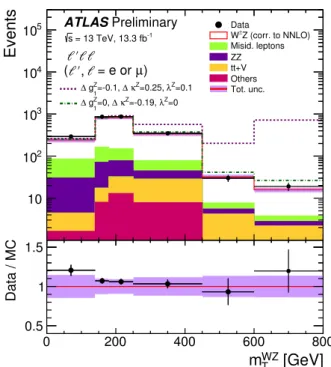
The presence of aTGC would a ff ect the W ± Z integrated cross section and manifest itself as an increased yield of events at high values of p Z T or m WZ T . Confidence intervals for the aTGC are extracted from the m WZ T differential distribution at detector level, as presented in Figure 4. The m WZ T distribution is expected to be less sensitive to higher-order QCD and EW effects in perturbation theory [4]. For this reason it has smaller theoretical uncertainties than the p Z T distribution at high values and provides more stringent expected confidence intervals, as proven by a dedicated MC study.
The MC event generator MC@NLO is used to generate W ± Z events and to compute, for each event,
a set of weights that are employed to reweight the SM sample to any chosen value of the anomalous
couplings, or EFT coefficients. With this procedure, expected m WZ T distributions are obtained for different
values of the anomalous couplings, or EFT coe ffi cients. The generated aTGC weights of MC@NLO were
propagated to the reconstructed MC events. A global systematic uncertainty of 10% across all m WZ T bins
was included in the aTGC confidence interval extraction procedure, to account for the difference between
the derived and the internal reconstructed event weights. The di ff erence between modelling of the m WZ T
distribution by the P owheg+ P ythia and MC@NLO MC generators is taken into account for the aTGC
confidence interval extraction by assigning an uncertainty that reaches 8% over the m WZ T spectrum.
Events
10 10
210
310
410
5 DataW±Z (corr. to NNLO)Misid. leptons ZZ tt+V Others Tot. unc.
Z=0.1 λ
=0.25, κZ
∆
=-0.1, 1 gZ
∆
Z=0 λ
=-0.19, κZ
∆ 1=0, gZ
∆
ℓ ′ ℓℓ
ℓ ′ , ℓ µ ) ( = e or ATLAS Preliminary
= 13 TeV, 13.3 fb-1
s
[GeV]
WZ T
m
0 200 400 600 800
Data / MC
0.5 1 1.5
Figure 4: Distribution of m
WZTin the sum of all channels with the same binning as used for the calculation of aTGC confidence intervals. The points correspond to the data and the histograms to the expectations of the di ff erent SM processes. All MC expectations are scaled to the integrated luminosity of the data using the predicted MC cross sections of each sample. The P owheg+ P ythia MC prediction is used to model the W
±Z signal contribution. The number of predicted signal events is scaled taking into account the recent NNLO calculation which results in a factor of 1.11 compared to the NLO total cross section. The open red histogram shows the total prediction and the shaded violet band its estimated total uncertainty. The last bin contains the overflow.
Frequentist confidence intervals for the anomalous couplings are computed by forming a profile likeli- hood test that incorporates the observed and expected numbers of signal events in each bin of the m WZ T distribution for di ff erent values of the anomalous couplings. The systematic uncertainties are included in the likelihood function as nuisance parameters.
Table 3 presents the observed and expected one-dimensional intervals at 95% CL for ∆ κ Z , ∆ g Z 1 , and λ Z with the cuto ff scale Λ co = ∞ (no cuto ff ). For the results presented no form factor is used, as the current sensitivity is well within the unitarisation constraints. In order to improve the sensitivity, the confidence intervals are derived from the combined 8 and 13 TeV datasets. All sources of the experimental uncertainties are treated as uncorrelated between the two measurements, while the correlation between the theoretical uncertainties on the W ± Z production is taken into account. Each confidence interval is obtained by setting the other two couplings to the SM value.
In Figure 5 the present observed confidence intervals are compared to those previously obtained using W ± Z events produced by ATLAS with √
s = 7 TeV and √
s = 8 TeV pp collisions [3]. The confidence intervals derived from the 13 TeV W ± Z measurement are similar to those extracted at 8 TeV, while the confidence intervals derived from the combination of these two datasets improve previous constraints by factors of up to 1.2.
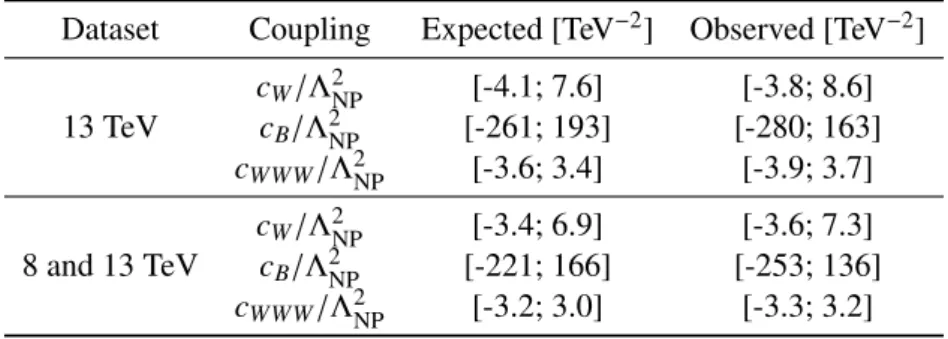
Table 4 presents the interpretation of the observed and expected one-dimensional intervals at 95% CL in
Dataset Coupling Expected Observed 13 TeV
∆ g Z 1 [-0.017; 0.032] [-0.016; 0.036]
∆ κ 1 Z [-0.18; 0.24] [-0.15; 0.26]
λ Z [-0.015; 0.014] [-0.016; 0.015]
8 and 13 TeV
∆ g Z 1 [-0.014; 0.029] [-0.015; 0.030]
∆ κ 1 Z [-0.15; 0.21] [-0.13; 0.24]
λ Z [-0.013; 0.012] [-0.014; 0.013]
Table 3: Expected and observed one-dimensional 95% CL intervals for the anomalous coupling parameters using Λ
co= ∞.
aTGC Intervals at 95% C.L.
− 0.05 0 0.05 0.1 0.15 0.2 0.25
× 0.1 κ Z
∆ λ Z
1
g Z
∆ ATLAS Preliminary
ATLAS combined 8 + 13 TeV = 13 TeV, 13.3 fb
-1s ATLAS
= 8 TeV, 20.3 fb
-1s ATLAS
= 7 TeV, 4.6 fb
-1s ATLAS
∞
co
= Λ
±
![Figure 5: Comparison of one-dimensional intervals at 95% CL for the anomalous coupling parameters using a cuto ff scale of Λ co = ∞ and obtained from the analysis of W ± Z events at di ff erent centre-of-mass energies by the ATLAS experiment [3, 4]](https://thumb-eu.123doks.com/thumbv2/1library_info/4007816.1540993/15.892.229.680.585.936/comparison-dimensional-intervals-anomalous-coupling-parameters-obtained-experiment.webp)