ATLAS-CONF-2014-023 20May2014
ATLAS NOTE
ATLAS-CONF-2014-023
May 18, 2014
Measurement of W boson production and the lepton charge asymmetry in PbPb collisions at √
s
NN= 2.76 TeV with the ATLAS detector
The ATLAS Collaboration
Abstract
A measurement of
Wboson production in lead-lead collisions at
√sNN =
2.76 TeV is presented. It is based on analyses of data collected with the ATLAS detector at the LHC in 2011 corresponding to an integrated luminosity of 0.14 and 0.15 nb
−1in the muon and electron decay channels, respectively. The differential production yields and lepton charge asymmetry are measured as a function of the average number of participating nucleons and absolute pseudorapidity of the charged lepton. The results are compared to predictions based on modified leading-order and next-to-leading-order calculations. These measurements pro- vide information on the scaling of
Wboson production in multi-nucleon systems as well as possible nuclear modifications to the parton distribution functions.
c
Copyright 2014 CERN for the benefit of the ATLAS Collaboration.
Reproduction of this article or parts of it is allowed as specified in the CC-BY-3.0 license.
1 Introduction
Studies of particle production in the high-density medium created in ultra-relativistic heavy-ion col- lisions have been previously conducted at the Relativistic Heavy Ion Collider (RHIC) at Brookhaven National Laboratory [1–4] and have been extended to larger centre-of-mass energies at the Large Hadron Collider (LHC) at CERN [5, 6]. These collisions provide access to a phase of nuclear matter at high temperature and low baryon density called a Quark-Gluon Plasma (QGP), where the relevant degrees of freedom are quarks and gluons [7–11]. In a QGP, high-energy partons transfer energy to the medium through multiple interactions and gluon radiation (jet-quenching). This is consistent with the measure- ments of high transverse momentum (p
T) charged hadron yields [6, 12–14], inclusive jets [15, 16], and di-jets with asymmetric transverse energies (E
T) [13, 17–19].
Electroweak bosons (γ,
W, Z) provide additional ways to study partonic energy loss in heavy-ioncollisions. They do not interact strongly with the medium and therefore can act as standard candles offering a possibility of calibrating the energy of the initial jet. At sub-TeV centre-of-mass energies, the only viable candidates for playing this role are photons [20]. However at higher energies, heavy gauge bosons (W
±and
Z) are also produced in relatively high abundance, which introduces another avenuefor benchmarking in-medium modifications to coloured probes. This potential has already been realized in previous ATLAS [21] and CMS [22–24] publications, where it was shown that electroweak boson production rates scale linearly with the number of binary nucleon-nucleon collisions.
Moreover, electroweak bosons are an excellent tool for studying modifications to parton distribution functions (PDFs) in a multi-nucleon environment. To leading-order,
W+(W
−) bosons are primarily pro- duced by interactions between the
u(d) valence quark andd(u) sea quark. The rapidity of theWboson is primarily determined by the momentum fractions,
x, of the incoming partons. Therefore, informationabout the PDFs can be extracted by measuring the charge asymmetry as a function of the pseudorapidity
1of charged leptons produced from
Wdecays.
The charge asymmetry is defined in terms of the differential
Wboson production yields for
W →`ν
`with `
=µ,
e,dNW±/dη
`:
A`
(η
`)
= dNW+→`+ν`/dη
`−dNW−→`−ν¯`/dη
`dNW+→`+ν`
/dη
`+dNW−→`−ν¯`/dη
`(1) where η
`is the pseudorapidity of the charged lepton and the
Wboson production yields are determined in the kinematic phase-space used to select
W →`ν
`events. This observable has been used to study PDFs in binary nucleon systems at both the LHC [25–27] and the Tevatron [28, 29]. However, its utility in nuclear systems has only recently been explored with a limited set of experimental data [23].
Although the method for measuring the charge asymmetry in lead-lead (PbPb) is essentially identical to that in
pp, the distributions themselves are not expected to be identical. In ppcollisions, the overall production rate of
W+bosons is larger than that for
W−bosons as a result of the larger fraction of
uvalence quarks relative to
dvalence quarks in the colliding system. On the other hand, in
PbPbcollisions, the nuclei contain 126 neutrons and 82 protons. Thus,
ppinteractions make up only
≈15% of the total number of nucleon-nucleon interactions, while neutron-neutron and proton-neutron combinations contribute
≈37% and
≈48%, respectively. Consequently, a marked difference is expected in the lepton charge asymmetry between
PbPband
ppcollisions.
Prior to this analysis, the only published charge asymmetry measurement of
Wboson production in heavy-ion collisions was reported by the CMS collaboration [23] for
PbPbcollisions at
√sNN =
2.76 TeV using a dataset with an integrated luminosity of 7.3 µb
−1. The measurement presented here
1The ATLAS detector uses a right-handed coordinate system with the nominalPbPbinteraction point at its centre. The positive z-axis is along the beam pipe. The x-axis points from the interaction point toward the centre of the ring and the y-axis points upward. Cylindrical coordinates (r,φ) are used in the transverse plane withφbeing the azimuthal angle around the beam pipe. The pseudorapidity is defined in terms of the polar angleθasη=−ln(tanθ/2).
uses a dataset from 2011, which corresponds to an integrated luminosity of
≈0.14 and 0.15 nb
−1for the muon and electron channels, respectively. This is approximately 20 times larger than the dataset employed in the CMS result based on data taken in 2010. In addition, the
W → eνedecay mode is employed for the first time in a heavy-ion environment.
The remainder of this paper is structured as follows: a brief overview of the ATLAS detector and trigger is given in Sec. 2. A description of the simulated event samples used in the analysis is provided in Sec. 3. The criteria for selecting
PbPbevents are presented in Sec. 4. This is followed by a de- scription of muon and electron reconstruction and signal candidate selection in Sec. 5. The background estimations are presented in Sec. 6. A discussion of the procedure for correcting the signal yields is presented in Sec. 7. The systematic uncertainties and the combination of the two channels are described in Sec. 8 and 9, and the
Wboson production yields, measured as a function of the mean number of inelastically-interacting nucleons
hNpartiand charged lepton absolute pseudorapidity,
|η`|, are discussed in Sec. 10. These results are compared to theoretical predictions at leading-order (LO) and next-to- leading-order (NLO). A di
fferential measurement of the lepton charge asymmetry as a function of the lepton pseudorapidity is also presented. Section 11 provides a brief summary of the results.
2 The ATLAS detector
ATLAS [30], one of four large LHC experiments, is well equipped to carry out an extensive heavy-ion program. In its innermost part, the inner detector (ID) comprises a precision tracking system that covers a pseudorapidity range
|η|< 2.5. It consists of silicon pixels, silicon strips, and a straw-tube based tran- sition radiation tracker (TRT)
2operating within an approximately 2 T axial magnetic field supplied by a superconducting solenoid. Due to the high occupancy in heavy-ion events, tracks of charged particles are reconstructed using only the silicon pixels and strips. No information from the TRT is used in this analysis, and henceforth ID tracks will refer to those tracks that are reconstructed without this portion of the detector.
Highly-segmented electromagnetic (EM) and hadronic calorimeters covering
|η|< 4.9 are located outside the solenoid. The EM calorimetry is based on liquid-argon (LAr) technology and is divided into one barrel (
|η|< 1.475, EMB) and two end-cap (1.375 <
|η|< 3.2, EMEC) components. A transition region between the barrel and end-cap calorimeters covers a pseudorapidity range of 1.37 <
|η|< 1.52.
The hadronic calorimeter is based on two di
fferent detector technologies: steel absorber interleaved with plastic scintillator covering the barrel (
|η|< 1.0) and extended barrels (0.8 <
|η|< 1.7) and LAr hadronic end-cap calorimeters (HEC) located in the region 1.5 <
|η|< 3.2. A forward calorimeter (FCal) that uses LAr as the active material is located in the region 3.1 <
|η|< 4.9. On the inner face of the end-cap calorimeter cryostats the Minimum Bias Trigger Scintillator (MBTS) [31] is installed on each side of the ATLAS detector, covering the pseudorapidity region at 2.1 <
|η|< 3.8.
The outermost sub-system of the detector is a muon spectrometer (MS) that is divided into a barrel region (
|η|< 1.05) and two end-cap regions (1.05 <
|η|< 2.7). Precision measurements of the track coordinates are provided by monitored drift tubes (MDTs), cathode strip chambers (CSCs), and three sets of air-core superconducting toroids – with coils arranged in an eight-fold symmetry – which provide on average 0.5 T in the azimuthal plane.
The zero degree calorimeters (ZDCs) [32] are located symmetrically at
z = ±140 m and cover|η|
> 8.3. In
PbPbcollisions the ZDCs primarily measure spectator neutrons from the incident nuclei.
The ATLAS detector also includes a three level trigger system [33] : level one (L1) and the software- based High Level Trigger (HLT), which is subdivided into the Level 2 (L2) trigger and Event Filter (EF).
Muon and electron triggers are used to acquire the data used in the analysis described in this paper.
2The TRT extends only to|η|<2.
The trigger selection for muons is performed in three steps. Information is provided to the L1 trigger system by the fast-response resistive plate chambers (RPCs) in the barrel (|η| < 1.05) and thin gap chambers (TGCs) in the end-caps (1.05 <
|η|< 2.4). Both RPC and TGC are part of the MS. The detector position information from L1 is then passed to the HLT. The HLT reconstructs muon tracks in the vicinity of the detector region reported by the L1 trigger. The L2 trigger performs a fast reconstruction of muons using a simple algorithm, which is then further refined at the EF by utilising the full detector information as in the offline muon reconstruction software.
The trigger selection for electrons is based on a L1 decision coming from the energy deposited in trigger towers, (∆ φ
×∆η)
=0.1
×0.1 formed by EM calorimeter cells within the range
|η|< 2.5. The electron trigger algorithm identifies a region of interest as a trigger tower cluster for which the transverse energy (E
T) sum from at least one of the four possible pairs of nearest neighbour towers exceeds a specified
ETthreshold.
3 Monte Carlo samples
Simulated samples were produced using the Monte Carlo (MC) method and were passed through full detector simulation. These samples are used to correct the measured
Wboson yields from each of the lepton channels for detector e
ffects, estimate background contamination, and make comparisons with theoretical expectations. The samples used throughout this paper for simulating signal and background processes are summarised in Table 1. In each sample, simulation of the ATLAS detector was based on G
4 [34, 35]. Each signal process and most of the background processes were embedded into minimum-bias (MB) heavy-ion events from data recorded in the same run periods as the data used to analyse
Wboson production. The only exception is the
Z →µ
+µ
−channel, which uses H [36]
– a simulation that reproduces many features of the underlying event [15] – to emulate the heavy-ion environment.
Table 1: Signal and background simulated event samples used in this analysis.
W →`ν
`events include all nucleon combinations, whereas background processes use only
ppsimulations. The variable ˆ
pTis the average
pTof the two-outgoing partons involved in the hard-scattering process evaluated before modifications from initial- and final-state radiation. Details for each sample are given in the text.
Physics process Generator PDF set
W→
µν
µP
+P
8 CT10
W→
µν
µP6 MRST LO*
W→eνe
P
+P8 CT10
Di-jet P
6 MRST LO*
(17 <
pˆ
T< 140 GeV)
Z→
µ
+µ
−P
6 MRST LO*
Z→e+e−
P
+P
8 CT10
W→
τν
τ→µν
µν
τP6 MRST LO*
W→
τν
τ→eνeν
τP
+P8 CT10
Samples generated with P [37] were interfaced to P8 [38] in order to model parton show-
ering and fragmentation processes. The signal samples generated with P
+P8 are used to
extract correction factors for the fiducial yield measurement in the data and to make theoretical compar-
isons. Signal samples generated with the CT10 [39] PDF set were used as a baseline whereas the ones
generated with P
6 [40] in conjunction with the MRST LO* [41] PDF set were also used in this
analysis to provide an additional theoretical comparison.
In order to account for the isospin of the nuclei, separate samples of
pp, pn, and nnevents were generated and combined in proportion to their corresponding collision frequency in
PbPbcollisions.
Only
ppsimulations were used to model background processes (discussed in detail in Sec. 6) since these channels are not as sensitive to isospin e
ffects.
Background samples were generated with P6 using the MRST LO* PDF set. The background contribution to the muon channel due to heavy flavour was modeled using simulated di-jet samples produced with a muon filter to enhance the fractions of muons in the events and final-state parton energies
ˆ
pT
ranging from 17
−140 GeV. The
W →τν
τsample also used a muon or electron filter, and tau decays were treated using either T
[42] or P
8 for final states involving muons or electrons, respectively. Final-state radiation from QED processes were simulated by P
[43].
4 Event selection
4.1 Centrality definition
PbPb
collision events are selected by imposing basic requirements on the beam conditions and the per- formance of each sub-detector. A hit on both sides of the MBTS system with a time coincidence within less than 3 ns is required for each collision. In addition, each event is required to have a reconstructed vertex with at least three associated tracks with
pT> 0.5 GeV that is compatible with the beam spot.
These selection criteria result in a sample size of approximately 1.03
×10
9PbPbevents [44] (denoted by
Neventshereafter). These requirements select MB hadronic
PbPbcollisions with an e
fficiency of 98
±2%
with respect to the total inelastic cross-section.
Each event is categorised into a specific centrality class defined by selections on FCal
ΣET, the total transverse energy deposited in the FCal and calibrated to the EM energy scale [45]. Centrality classes in heavy-ion events represent the percentiles of the total inelastic non-Coulomb
PbPbcross-section. This reflects the overlap volume between the colliding nuclei and allows for selection of various collision geometries in the initial state.
The FCal
ΣETis closely related to the mean number of inelastically-interacting nucleons
hNpartiand mean number of binary collisions
hNcolliusing the Glauber formalism (see Ref. [46]).
hNpartiand
hNcolliare monotonic functions of the impact parameter and can be mapped to experimental quantities following the procedure from Ref. [5].
hNcollican also be expressed as the product of the average nuclear thickness function
hTAAiand the total inelastic
ppcross-section (64
±5 mb at
√s =
2.76 TeV [47]).
In this paper, events are separated into five centrality classes: 0-5%, 5-10%, 10-20%, 20-40%, and 40- 80% with the most central interval (0-5%) corresponding to the 5% of events with the largest FCal
ΣET. The
hNcolliestimation in the 80-100% su
ffers from high experimental uncertainties, and therefore, this centrality class was not considered in the analysis. Table 2 presents the
hNpartiand
hNcollifor each centrality class along with their relative systematic uncertainties (see Sec. 8). Since a single participant can interact inelastically with several nucleons in a collision, the uncertainty in
hNpartiis less than that of the corresponding
hNcolliin each centrality class.
4.2 Trigger selection
In this analysis,
W →µν
µcandidates are selected using single muon triggers with a requirement on the minimum transverse momentum of 10 GeV in the HLT. Two types of single muon triggers are used:
one that requires a muon in coincidence with a total event transverse energy measured in the calorimeter at L1 to be above 10 GeV and another which requires a muon in coincidence with a neutral particle at
|η|
> 8.3 in the ZDCs. This maximises the efficiency for events across all centrality classes. The muon
trigger efficiencies were evaluated using single muons from minimum bias events and ranged from 89.3
Table 2: Average number of participating nucleons
hNpartiand binary collisions
hNcollifor the centrality classes used in this analysis alongside their relative uncertainties.
Centrality [%]
hNparti δhNpartihNparti
[%]
hNcolli δhNcolli hNcolli[%]
0-5 382 0.5 1683 7.7
5-10 330 0.9 1318 7.5
10-20 261 1.4 923 7.4
20-40 158 2.6 441 7.3
40-80 46 6.0 78 9.4
0-80 140 4.7 452 8.5
to 99.6%, depending on the pseudorapidity of the muon and centrality of the event from which the muon originated.
Candidate events for
W→eνeare selected using only the hardware-based L1 trigger, i.e. without use of the HLT. The L1 calorimeter trigger selects photon and electron candidates if the transverse energy in an EM cluster of trigger towers was above 14 GeV. Its e
fficiency was evaluated using a tag-and- probe (TP) method that utilised
Z →e+e−events selected using the criteria from Ref. [21]. This gives an efficiency of 99.6% for electrons with
ET> 25 GeV and
|η|< 2.47, excluding the transition region.
The centrality dependence of the electron trigger e
fficiencies was found to be negligible.
4.3 Transverse momentum imbalance, p
missTPrevious
Wboson analyses in ATLAS [25] have used the event momentum imbalance in the plane trans- verse to the beam axis
EmissTas a proxy for the true neutrino
pT. Traditionally, these analyses reconstruct the
ETmissusing contributions from energy deposits in the calorimeters and muons reconstructed in the MS [48]. However, in heavy-ion collisions, the resolution in calorimeter-based
ETmissis observed to be at the level of 45 GeV in the most central events. Therefore, this analysis employs a track-based calculation proposed in Ref. [23] that provides a four-fold improvement in resolution relative to the calorimeter- based method. The event momentum imbalance using this approach is defined as the negative vector sum of all good quality ID tracks with
pT> 3 GeV selected using the criteria from Ref. [45]:
pmiss=−
Ntracks
X
i=1
ptracki
, (2)
where
ptrackiis the momentum vector of the ith ID track, and N
tracksrepresents the total number of ID tracks in the event. The magnitude of the transverse component
pmissTand azimuthal angle φ
missare calculated from the transverse components (
pmissxand
pmissy) of the resultant vector.
The transverse mass of the charged lepton and neutrino system is defined as
mT= q2
p`TpmissT(1
−cos
∆φ
`,pmissT
), (3)
where
∆φ
`,pmissT
is the difference in the azimuthal angle of the charged lepton and φ
miss.
5 Signal candidate reconstruction and selection
5.1 Muon reconstruction
Muon reconstruction in ATLAS consists of separate tracking in the ID and MS. In this analysis, tracks re- constructed in each sub-system are combined using the χ
2-minimisation procedure described in Ref. [49].
These combined muons are required to satisfy selection criteria that closely follow those used in the
Zboson analysis in
PbPbdata reported in Ref. [21]. To summarise, these criteria include a set of ID hit requirements in the pixel and SCT layers of the ID, a restriction on the position of the muon track extrap- olated to the beam line, and a cut on the χ
2of the muon track fit. Additional selection criteria specific to
Wbosons are discussed below.
Decays-in-flight from pions and kaons contribute a small background fraction in this analysis. They are reduced by requiring the difference between the ID and MS muon
pTmeasurements (corrected for the mean energy loss due to interactions with the material between the ID and MS) to be less than 50%
of the
pTmeasured in the ID. Moreover, muons from pions and kaons usually exhibit sharp changes in the muon track trajectory at the point of the decay. Therefore, a selection on the scattering angle at each scattering center in the ID is imposed to help locate changes in the muon trajectory that are much greater than the average change due to multiple scattering. This follows the method described in Ref. [50].
In order to reduce the QCD multi-jet contribution, a track-based isolation of the muon is imposed.
This requires that the sum of the transverse momenta of ID tracks
PpIDT
with
pT> 3 GeV, within a cone radius
∆R = p(∆ η)
2+(∆ φ)
2 =0.2 around the direction of the muon, be less than 10% of the muon
pT(excluding the muon
pTitself). In this paper, the quantity
PpIDT
/
pTwill be referred to as the muon isolation ratio. Based on MC studies, the isolation requirement is estimated to reject 50
−70% of muons in QCD multi-jet events, depending on the centrality class, while retaining at least 95% of signal candidates.
5.2 Electron reconstruction
In order to reconstruct electrons in the environment of heavy-ion collisions, the energy deposits from soft particle production due to the large underlying event (UE) must be subtracted as they distort calorimeter based observables. The two-step subtraction procedure, described in detail in Ref. [15], has been applied.
It calculates a per-event average UE energy density excluding contributions from jets and EM clusters and accounting for e
ffects of elliptic flow modulation on the UE. After the UE background subtraction, deposited energies stem primarily from three sources: photons/electrons, jets and background fluctua- tions. After the UE background subtraction, an ATLAS heavy-ion standard electron reconstruction and identification algorithm [51, 52] is used – the only di
fference with the algorithm used in
ppcollisions is the absence of TRT information. It is designed to provide various levels of background rejection and high identification efficiencies over the full acceptance of the ID system.
The electron identification selections are based on criteria that use calorimeter and tracking informa- tion and have been optimised in bins of η and
ET. Patterns of energy deposits in the first layer of the EM calorimeter, track quality variables, and a cluster-track matching criterion are used to select electrons.
Cuts based on shower shape information from the second layer of the EM calorimeter and energy leak- age into the hadronic calorimeters are used as well. Background from charged hadrons and secondary electrons from conversions are reduced by imposing a requirement on the ratio of cluster energy to track momentum. Electrons from conversions are further reduced by requiring at least one hit in the first layer of the pixel detector.
A calorimeter-based isolation variable is considered for the electron channel. It is defined as the ratio between the total calorimeter transverse energy – within a cone radius
∆R around the candidate electron cluster – and the cluster
ET. This quantity
PETcalo
/E
Twill be referred to as the electron isolation
ratio. An optimisation of the background rejection and signal efficiency for this isolation requirement was performed as a function of
∆R and the isolation ratio. For this analysis, the isolation ratio with
∆R
< 0.25 is required to be less than 20%. The cut was studied in each centrality class and retains, on average, 92% of signal candidates while rejecting 42% of electrons from QCD multi-jet events.
5.3 W candidate selection
The transverse momentum of muon or electron candidates is required to be at least 25 GeV, and miss- ing transverse momentum is required to be
pmissT> 25 GeV. A lower limit on the transverse mass of
mT> 40 GeV is also imposed to further suppress background events that pass the lepton
pTor
pmissTrequirements.
In the muon channel, the background contribution from
Z →µ
+µ
−boson decays is suppressed by rejecting events that include opposite-charge muon pairs with an invariant mass greater than 66 GeV.
These events are selected by requiring that one muon in the pair have
pT> 25 GeV and pass the quality requirements in Sec. 5.1 and the other muon in the pair only satisfy a lower
pTthreshold of 20 GeV.
In principle, this method allows for the possibility of accepting events with more than one
Wboson.
However, only one event in the data was found where two muons passed all signal selection requirements.
The rejection power of these cuts was assessed using MC simulation and was estimated to veto 86% of muons produced from a
Zboson while retaining over 99% of
Wboson candidates. The remaining 14%
of
Zboson events that pass these cuts is attributable to instances where the second muon from the
Zboson decay is produced outside the ID acceptance or has
pT< 20 GeV.
In the electron channel, the
Z →e+e−background contribution is suppressed by rejecting events with more than one electron passing the identification requirements from Sec. 5.2. Events surviving this cut are attributable to instances where the second electron from the
Zboson decay is either produced outside the ID acceptance (26%) or does not pass the relatively tight electron identification requirements (74%).
After applying all selection criteria, 3348
W+and 3185
W−candidates were detected in the muon channel. In the electron channel, 2893
W+and 2791
W−candidates were observed.
6 Background estimation
The main backgrounds to the
W →`ν
`channel arise from lepton production in electroweak processes and semi-leptonic heavy flavour decays in multi-jet events. The former include
W →τν
τ→`ν
`ν
τevents and
Z →`
+`
−events, where one lepton from the
Zboson is emitted outside the ID acceptance, producing spurious
pmissT. Other sources of background that are considered include
Z→ττ events, in which at least one tau decays into a muon or electron, and
t¯tdecays, in which at least one top quark decays semi- leptonically into a muon or electron. These two background sources are negligible (< 0.5%) and are not taken into account in this analysis.
6.1 W → µν
µchannel
In the muon channel, the total number of background events from QCD multi-jet processes is estimated
using MC simulation of di-jet events. The di-jet muon yields per
PbPbevent in the MC are normalised
to the
ppcross-section and scaled by the number of binary collisions and
PbPbevents in the data for
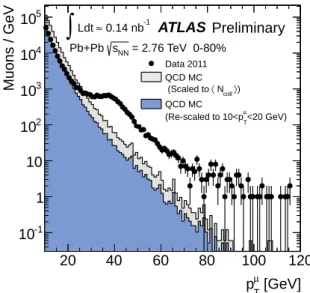
each centrality class. This is represented by the shaded histogram in Fig. 1. To take into account jet
energy-loss in the medium, the MC distribution is re-scaled to the data in a background-enriched control
region in the range 10 <
pµT< 20 GeV (filled histogram). As a cross-check, the re-scaled QCD multi-jet
background distribution was compared to a control sample consisting of anti-isolated muons from the
data. The shapes of these two distributions are found to agree well, thereby confirming that the simulated
distributions in Fig. 1 are an accurate representation of the QCD multi-jet background in the data. The number of expected background events is determined by extrapolating the MC from the control region to a signal
pµTregion above 25 GeV. This is performed in each η
µinterval and centrality class. The background fraction is also determined separately for both µ
+and µ
−, and no charge dependence is observed. The QCD background fraction is estimated to be on average 3.7% of the total number of
W±boson candidates, varying from 2.0% to 5.4% as a function of η
µand centrality.
[GeV]
µ
pT
20 40 60 80 100 120
Muons / GeV
10-1
1 10 102
103
104
105
Data 2011 QCD MC
〉) Ncoll
〈 (Scaled to QCD MC
<20 GeV)
µ
(Re-scaled to 10<pT
0.14 nb-1
≈ Ldt
∫
Pb+Pb sNN = 2.76 TeV 0-80%ATLAS Preliminary
Figure 1: Muon transverse momentum distribution in the data before applying final
Wselection crite- ria (points). The
pTdistributions for muons from QCD multi-jet processes from the MC are also shown in the same figure. The shaded histogram is scaled to
hNcolliand the filled histogram is re-scaled to match the data in a control region 10 <
pµT< 20 GeV.
The estimated number of background events from electroweak processes is determined separately for both the
Z →µ
+µ
−and
W →τν
τchannels. The background contributions from both µ
+and µ
−decay products are considered. The background from
Z →µ
+µ
−events is determined di
fferentially for each η
µinterval from the MC and scaled to reproduce the actual number of
Z →µ
+µ
−events observed in the data [21] in each centrality class. This contribution is on average 2.4% relative to the total number of
Wboson candidates and ranges from 1.0% at central rapidity to 3.2% in the forward region. Background events originating from
W →τν
τ →µν
µν
τdecays are estimated by calculating the ratio between the number of
W →τν
τ →µν
µν
τand
W →µν
µevents passing the analysis cuts in the simulation. This fraction is found to be on average 1.5% in each pseudorapidity interval and centrality class and is applied to the number of observed signal candidates. Variations between bins are at the level of 1.3
−1.8%. The expected background from all sources in the
W →µν
µchannel amounts to 7.6% of the total number of
Wboson candidates.
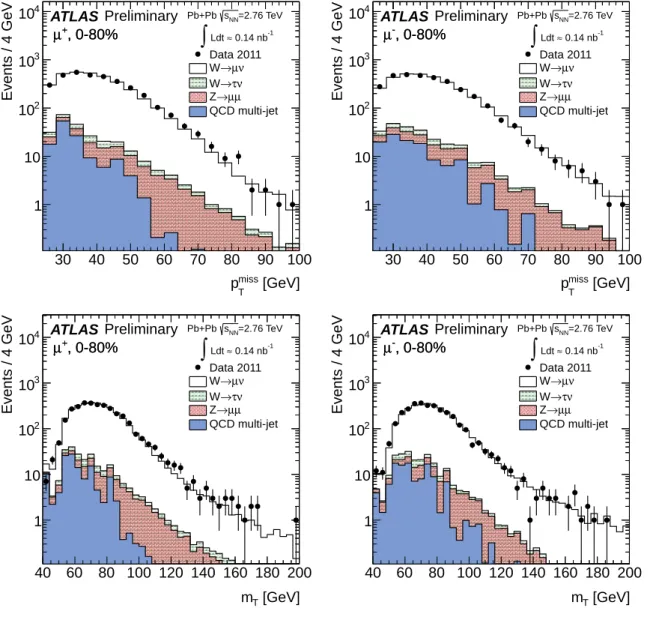
Figure 2 shows the absolute pseudorapidity and transverse momentum for positively and negatively charged muons after final event selection. Figure 3 presents the event missing transverse momentum and transverse mass distributions for the muon transverse momentum-missing transverse momentum system.
In each figure, the data are compared to signal and background distributions from MC simulation in the
same phase-space. The background distributions are normalised to the expected number of background
events (see above), while the signal MC is normalised to the number of background-subtracted events in
the data.
+| ηµ
|
0.2 0.4 0.6 0.8 1 1.2 1.4 1.6 1.8 2 2.2 2.4
Muons / bin
500 1000 1500 2000 2500 3000
ATLAS Preliminary
Data 2011 ν µ
→ W→τν W→µµ Z
QCD multi-jet
, 0-80%
µ+
=2.76 TeV sNN
Pb+Pb 0.14 nb-1
≈ Ldt
∫
-| ηµ
|
0.2 0.4 0.6 0.8 1 1.2 1.4 1.6 1.8 2 2.2 2.4
Muons / bin
500 1000 1500 2000 2500 3000
ATLAS Preliminary
Data 2011 ν µ
→ W
ν τ
→ W→µµ Z
QCD multi-jet
, 0-80%
µ-
=2.76 TeV sNN
Pb+Pb 0.14 nb-1
≈ Ldt
∫
[GeV]
T µ+
p
30 40 50 60 70 80 90 100
Muons / 2 GeV
1 10 102
103
10 ATLAS Preliminary4
Data 2011 ν µ
→ W
ν τ
→ W→µµ Z
QCD multi-jet
, 0-80%
µ+
=2.76 TeV sNN
Pb+Pb 0.14 nb-1
≈ Ldt
∫
[GeV]
T µ-
p
30 40 50 60 70 80 90 100
Muons / 2 GeV
1 10 102
103
10 ATLAS Preliminary4
Data 2011 ν µ
→ W
ν τ
→ W→µµ Z
QCD multi-jet
, 0-80%
µ--, 0-80%
µ
=2.76 TeV sNN
Pb+Pb 0.14 nb-1
≈ Ldt
∫
Figure 2: Measured muon absolute pseudorapidity (top) and transverse momentum (bottom) distribu- tions for
W+→µ
+ν
µ(left) and
W−→µ
−ν ¯
µ(right) candidates after applying the complete set of selection requirements in the fiducial region,
pµT> 25 GeV,
pmissT> 25 GeV,
mT> 40 GeV and 0.1 <
|ηµ|< 2.4.
The numbers of background events due to QCD multi-jet and electroweak processes are normalised
according to their expected number of events. The
W →µν
µMC is normalised to the number of
background-subtracted events in the data.
[GeV]
miss
pT
30 40 50 60 70 80 90 100
Events / 4 GeV
1 10 102
103
104 ATLAS Preliminary
Data 2011 ν µ
→ W
ν τ
→ W→µµ Z
QCD multi-jet
, 0-80%
µ++, 0-80%
µ
=2.76 TeV sNN
Pb+Pb 0.14 nb-1
≈ Ldt
∫
[GeV]
miss
pT
30 40 50 60 70 80 90 100
Events / 4 GeV
1 10 102
103
104 ATLAS Preliminary
Data 2011 ν µ
→ W
ν τ
→ W→µµ Z
QCD multi-jet
, 0-80%
µ--, 0-80%
µ
=2.76 TeV sNN
Pb+Pb 0.14 nb-1
≈ Ldt
∫
[GeV]
mT
40 60 80 100 120 140 160 180 200
Events / 4 GeV
1 10 102
103
104 ATLAS Preliminary
Data 2011 ν µ
→ W
ν τ
→ W→µµ Z
QCD multi-jet
, 0-80%
µ++, 0-80%
µ
=2.76 TeV sNN
Pb+Pb 0.14 nb-1
≈ Ldt
∫
[GeV]
mT
40 60 80 100 120 140 160 180 200
Events / 4 GeV
1 10 102
103
104 ATLAS Preliminary
Data 2011 ν µ
→ W
ν τ
→ W→µµ Z
QCD multi-jet
, 0-80%
µ--, 0-80%
µ
=2.76 TeV sNN
Pb+Pb 0.14 nb-1
≈ Ldt
∫
Figure 3: Measured transverse missing momentum (top) and transverse mass (bottom) distributions for
W+ →µ
+ν
µ(left) and
W− →µ
−ν ¯
µ(right) candidates after applying the complete set of selection requirements in the fiducial region,
pµT> 25 GeV,
pmissT> 25 GeV,
mT> 40 GeV and 0.1 <
|ηµ|< 2.4.
The numbers of background events due to QCD multi-jet and electroweak processes are normalised
according to their expected number of events. The
W →µν
µMC is normalised to the number of
background-subtracted events in the data.
6.2 W → eν
echannel
A partially data-driven method is used to estimate the QCD multi-jet background observed in
W → eνecandidate events. This method involves using a control sample from the data to construct a QCD background template. The control sample is selected by employing looser electron identification criteria based solely on shower shape information, and an inversed isolation ratio. In addition, the di
fference between the azimuthal angle of a jet reconstructed at EM scale with
ET> 25 GeV and
pmissT,
|φjet−φ
miss|, is required to be greater than π/2. This condition suppresses events with spurious
pmissToriginating from mis-calibration of a jet [51]. The nominal
pmissTand
mTcuts are also applied to the control sample.
Templates representing the QCD multi-jet background and simulated
W →eνeevents are fit to the data after electroweak background subtraction as a function of the electron transverse momentum
peT. This fit is performed in all centrality bins. The fit result using these templates provides a total background estimate of 945 events in the 0
−80% centrality class, which constitutes 16.7% of
W →eνecandidate events. As in the muon channel, this background fraction is charge-independent.
The background from electroweak processes with electrons in the final state are estimated from the MC samples listed in Table 1. The nominal selection criteria of this analysis are imposed on each MC sample. The absolute normalisation is derived from the
Wand
ZP
cross-sections in
ppcolli- sions. These cross-sections are scaled by
hNcolliin each centrality bin and normalised to the integrated luminosity of the
PbPbdata sample. This method gives a valid estimate of the electroweak background in this analysis since ATLAS has recently demonstrated that the
Z → e+e−yields in
PbPbcollisions at
√sNN =
2.76 TeV are consistent with the
ppexpectation scaled by
hTAAito within 3% [21]. The
Z →e+e−background is the dominant electroweak background in this analysis and amounts to 6.5% of the total
W → eνecandidate events. The background from
W →τν
τcontributes an additional 2.5%.
Electrons from
Z →ττ and
t¯tare found to be < 0.3% and < 0.1%, respectively. As with the muon channel, the latter two background sources are considered negligible in this analysis.
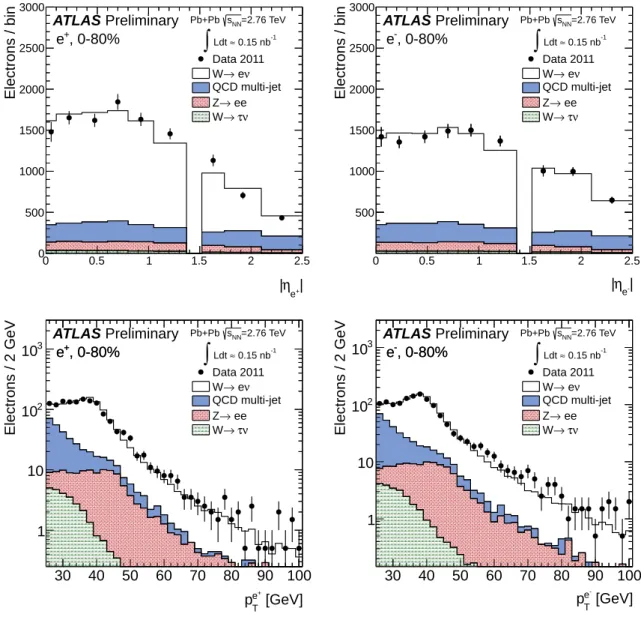
Figure 4 shows the absolute pseudorapidity and transverse momentum for positively and negatively charged electrons after final event selection. Figure 5 presents the event missing transverse momentum and transverse mass distribution for the electron transverse momentum-missing transverse momentum system. In each figure, the data are compared to signal and background distributions from MC simulation in the same phase-space. The background distributions are normalised to the expected number of events, while the signal MC is normalised to the number of background-subtracted events in the data.
7 Yield correction procedure
For this paper,
Wboson production yields are measured in a fiducial region defined by:
p`T
> 25 GeV,
pνT> 25 GeV,
mT> 40 GeV, 0.1 <
|ηµ|< 2.4 muon channel, 0 <
|ηe|< 2.47 electron channel.
In the MS, there is a void in the detector at
|ηµ|< 0.1 as this region is needed for services of the calorimeter, and this region is excluded in the analysis. The most forward bin boundary is determined based on the acceptance of the muon trigger chambers. In the electron analysis, the calorimeter transition region at 1.37 <
|ηe|< 1.52 is excluded.
In order to correct the data for losses attributable to the trigger, reconstruction, and selection efficien-
cies, a correction factor is applied to the measured yields. This correction factor
CW±is defined by the
+| ηe
|
0 0.5 1 1.5 2 2.5
Electrons / bin
0 500 1000 1500 2000 2500 3000
ATLAS Preliminary
Data 2011 ν
→ e W
QCD multi-jet
→ ee Z
ν τ
→ W
, 0-80%
e+
=2.76 TeV sNN
Pb+Pb 0.15 nb-1
≈ Ldt
∫
|
e-
η
|
0 0.5 1 1.5 2 2.5
Electrons / bin
500 1000 1500 2000 2500 3000
ATLAS Preliminary
Data 2011 ν
→ e W
QCD multi-jet
→ ee Z
ν τ
→ W
, 0-80%
e-
=2.76 TeV sNN
Pb+Pb 0.15 nb-1
≈ Ldt
∫
[GeV]
e+
pT
30 40 50 60 70 80 90 100
Electrons / 2 GeV
1 10 102
103
ATLAS Preliminary
Data 2011 ν
→ e W
QCD multi-jet
→ ee Z
ν τ
→ W
, 0-80%
e , 0-80%++
e
=2.76 TeV sNN
Pb+Pb 0.15 nb-1
≈ Ldt
∫
[GeV]
e-
pT
30 40 50 60 70 80 90 100
Electrons / 2 GeV
1 10 102
103
ATLAS Preliminary
Data 2011 ν
→ e W
QCD multi-jet
→ ee Z
ν τ
→ W
, 0-80%
e , 0-80%--
e
=2.76 TeV sNN
Pb+Pb 0.15 nb-1
≈ Ldt
∫
Figure 4: Measured electron absolute pseudorapidity (top) and transverse momentum (bottom) distribu-
tions for
W+→e+ν
e(left) and
W−→e−ν ¯
e(right) candidates after applying the complete set of selection
requirements in the fiducial region,
peT> 25 GeV,
pmissT> 25 GeV,
mT> 40 GeV and 0 <
|ηe|< 2.47
excluding the transition region (1.37 <
|ηe|< 1.52). The number of background events due to QCD
multi-jet and electroweak processes are normalised according to their expected number of events. The
W →eνeMC is normalised to the number of background-subtracted events in the data.
[GeV]
miss
pT
30 40 50 60 70 80 90 100 110 120
Events / 5 GeV
10-1
1 10 102
103
ATLAS Preliminary
Data 2011 ν
→ e W
QCD multi-jet
→ ee Z→τν W
, 0-80%
e , 0-80%++
e
=2.76 TeV sNN
Pb+Pb 0.15 nb-1
≈ Ldt
∫
[GeV]
miss
pT
30 40 50 60 70 80 90 100 110 120
Events / 5 GeV
10-1
1 10 102
103 ATLAS Preliminary
Data 2011 ν
→ e W
QCD multi-jet
→ ee Z→τν W
, 0-80%
e , 0-80%--
e
=2.76 TeV sNN
Pb+Pb 0.15 nb-1
≈ Ldt
∫
[GeV]
mT
40 60 80 100 120 140 160 180 200
Events / 4 GeV
10-1
1 10 102
103
ATLAS Preliminary
Data 2011 ν
→ e W
QCD multi-jet
→ ee Z
ν τ
→ W
, 0-80%
e , 0-80%++
e
=2.76 TeV sNN
Pb+Pb 0.15 nb-1
≈ Ldt
∫
[GeV]
mT
40 60 80 100 120 140 160 180 200
Events / 4 GeV
10-1
1 10 102
103
ATLAS Preliminary
Data 2011 ν
→ e W
QCD multi-jet
→ ee Z
ν τ
→ W
, 0-80%
e , 0-80%--
e
=2.76 TeV sNN
Pb+Pb 0.15 nb-1
≈ Ldt
∫
Figure 5: Measured transverse missing momentum (top) and transverse mass (bottom) distributions
for
W+ → e+ν
e(left) and
W− → e−ν ¯
e(right) candidates after applying the complete set of selection
requirements in the fiducial region,
peT> 25 GeV,
pmissT> 25 GeV,
mT> 40 GeV and 0 <
|ηe|< 2.47
excluding the transition region (1.37 <
|ηe|< 1.52). The number of background events due to QCD
multi-jet and electroweak processes are normalised according to their expected number of events. The
W → eνeMC is normalised to the number of background-subtracted events in the data. The transition
region (1.37 <
|ηe|< 1.52) is excluded from the analysis.
following ratio:
CW± = NWrec NWgen,fid
, (4)
where
NWrecrepresents the number of
W →`ν
`events reconstructed in the fiducial region and passing final selection cuts, and
NWgen,fidsignifies the number of
W →`ν
`events in the same phase space at the generator level. This is calculated separately for each charge,
|η`|, and centrality class. In Eq. (4), the kinematics of a given event at reconstruction level are not required to match its generator level values.
This accounts for migration e
ffects. Corrections for reconstruction and selection cuts are derived solely from the signal MC, whereas the trigger efficiencies are obtained from the data in each
|η`|interval and centrality class.
In both the muon and electron channels, the
CW±exhibits a significant dependence on the event centrality and lepton pseudorapidity. In the muon channel, the integrated
CW±is 67.4
±0.2%, ranging from 32% in the most central events at forward
|ηµ|to 85% in the most peripheral events at mid-rapidity.
In the electron channel, the integrated
CW±is 39.2
±0.3%, ranging from 34% in the most central events to 51% in the most peripheral centrality class. The large variations in the
CW±are attributable to two main factors, (a) areas of the detector with limited instrumentation and (b) the centrality dependence of the isolation e
fficiency and
pmissTresolution.
Using Eq. (4) for the definition of the correction factor, the differential
Wboson production yields in the fiducial region are calculated using the equation:
NW±
(|η
`|,centrality)
= NWobs±−Nbkg CW±, (5)
where
NWobs±signifies the number of candidate events observed in the data and
Nbkgthe number of back- ground events in a given
|η`|and centrality class.
The combination of the results from each channel are reported both as an integrated result in each centrality class and as a di
fferential measurement as a function of
|η`|. The integrated results requires theextrapolation of each measurement to the full pseudorapidity region defined by
|η`|< 2.5. Correction factors for this extrapolation are derived from the signal MC and increase the integrated yield for muons by 7.5% and electrons by 6.6%. In the di
fferential measurement as a function of
|η`|, the extrapolation isperformed only in the most forward bin up to
|η`|< 2.5. The correction increases the number of signal candidates by 28% in the muon channel and 7% in the electron channel.
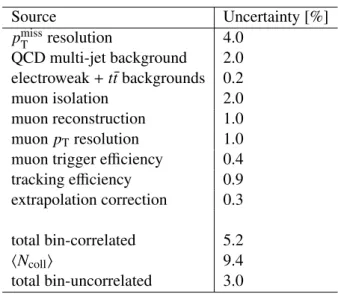
8 Systematic uncertainties
The systematic uncertainties for the measurements presented in this paper are studied separately for each
charge,
|η`|, and centrality class. Bin correlations for each uncertainty source were determined from theyields obtained after varying the systematic uncertainty by
±1σ. The variations in the corrected yields
as a function of absolute pseudorapidity and centrality determine the extent of the correlation for each
uncertainty. The sources of uncertainty considered fully correlated between bins are as follows: the
pmissTresolution, electroweak and QCD multi-jet background estimations, lepton isolation efficiency, lepton
and track reconstruction efficiencies, and lepton energy/momentum scale and resolution. The dominant
systematic uncertainty, in both channels, originates from the missing transverse momentum resolution. In
the asymmetry and charge ratio measurements, uncertainties correlated between charges largely cancel
due to similar off-diagonal elements in the covariance matrix between `
+and `
−. This correlation is
determined from the variation in the charge ratio measurements after varying the systematic uncertainty
by
±1σ. The variation in the measurements with respect to the nominal values reveals the extent of thecorrelation between each charge.
8.1 Muon channel
The resolution on
pmissT(σ
miss) increases as a function of the number of tracks used in Eq. (2), which in turn depends on the lower track
pTthreshold. A larger σ
missin the
pmissTdistribution implies a larger uncertainty of the true neutrino
pT. To quantify this uncertainty, the
pTthreshold of the tracks used in Eq. (2) is varied in both data and MC by
±1 GeV relative to the nominal track pTthreshold. All background sources, correction factors, and signal yields are recalculated during this procedure, resulting in an estimated uncertainty of 2.0
−4.0%.
The uncertainty in the QCD multi-jet background estimation arises primarily from the extrapolation procedure. There are two contributing factors: how well the MC represents the shape of the QCD multi-jet muon
pTdistribution and to what degree this distribution is altered by jet energy-loss in the medium. Previous ATLAS heavy-ion measurements have shown that there exists little disparity between the modification of heavy flavour muon yields and inclusive charged hadron yields [5]. This implies that the modification of charged hadrons may be considered an upper limit for heavy flavour muon modification, which in turn provides an upper limit on the extrapolation uncertainty. This upper limit is estimated by scaling the muon
pTdistribution from simulated QCD multi-jet events by a
pT-dependent nuclear modification factor, which was calculated according to the procedure from Ref. [53]. The scale factor is defined as the ratio between the inclusive charged hadron yield per binary collision in a heavy- ion event and the charged hadron yield in a
ppcollision and is calculated for each centrality class.
Applying this factor to each muon
pTdistribution results in a maximum uncertainty in the QCD multi-jet background of 50% and variations in the final signal yields of 0.4
−2.0%.
The uncertainty a
ffiliated with the electroweak background determination is estimated separately for
Z →µ
+µ
−and
W →τν
τ. The uncertainty in the
Zboson background estimation is determined by scaling the number of
Zevents in each η
µinterval to the number of events estimated from the MC rather than those observed in the data in each centrality class. The variation in the number of
W →µν
µevents in each
|ηµ|or centrality class with respect to the nominal yields is < 0.1%. The systematic error in the tau background estimation is evaluated by assuming that the muon selection efficiencies for the
pmissTand
mTcuts in the
W →τν
τ→µν
µν
τsample are identical to those in the
W →µν
µsample. Estimating the tau background with these
W→µν
µe
fficiencies results in a variation in the signal yields no larger than 0.1% of the nominal number of signal events in the data. Other sources of background from
Z→ττ and
t¯tevents were also included as a systematic uncertainty and result in a signal variation of less than 0.2%.
Since it is unclear to which extent the isolation is well modeled by MC a systematic uncertainty is assessed by varying the
∆R and PpIDT
cuts around the muon in both data and simulation. This is estimated by repeating the analysis either with a larger cone size or a larger
PpIDT
around the muon. The cone size around the muon momentum direction is increased from 0.2 to 0.3 and the limit on the
PpIDT