ATLAS-CONF-2013-041 23/04/2013
ATLAS NOTE
ATLAS-CONF-2013-041
April 19, 2013
Minor revision: April 23, 2013
Measurement of multi-jet cross-section ratios and determination of the strong coupling constant in proton-proton collisions at √
s = 7 TeV with the ATLAS detector.
The ATLAS Collaboration
Abstract
The inclusive three-jet to two-jet cross-section ratio is measured as a function of both the leading jet transverse momentum and the transverse momentum of each jet in an event.
These ratios are measured in proton-proton collisions at a centre-of-mass energy of 7 TeV using data recorded by the ATLAS detector at the Large Hadron Collider in 2010. These ratios are compared to predictions from next-to-leading-order QCD calculations corrected for non-perturbative effects. From the ratio measured as a function of the transverse mo- mentum of each jet in an event, the value of the strong coupling constant can be extracted in the jet transverse momentum range between 210 GeV and 800 GeV. The value of the strong coupling constant evolved to the
Zboson mass is determined to be
αs(M
Z)
=0.111
±0.006(exp.)
+−0.0030.016(theory). The measurement of the strong coupling constant as a function of energy scale is consistent with the QCD predictions of its running up to an energy scale of 800 GeV.
One reference corrected with respect to the version of April 19, 2013
c
Copyright 2013 CERN for the benefit of the ATLAS Collaboration.
Reproduction of this article or parts of it is allowed as specified in the CC-BY-3.0 license.
1 Introduction
Multi-jet events are copiously produced in high-energy proton-proton collisions and their study provides valuable insights into the theory of strong interactions, quantum chromodynamics (QCD). Of particular interest is the number of events passing successively higher requirements on the number of jets. This type of ratio measurement is directly sensitive to the rate of parton emission in jet production processes.
It is therefore a valuable tool to test the validity of fixed-order perturbative QCD (pQCD) predictions and their sensitivity to higher-order QCD effects. Furthermore, such cross-section ratio measurements are proportional to the value of the strong coupling constant (α
s). The value of the strong coupling constant can be determined from the measurement of a multi-jet cross-section ratio as a function of energy scale, providing a direct determination of the running of
αs. With the new energy regime accessible at the LHC, the running can be tested up to energy scales never probed before in the laboratory.
Cross-section ratios of multi-jet events have been measured by the CDF [1] and DØ [2, 3] collabora- tions using proton-antiproton collision data recorded at centre-of-mass energies of 1.8 TeV and 1.96 TeV.
More recently, the ATLAS [4] and CMS [5] collaborations have reported measurements of multi-jet pro- duction cross-section ratios in proton-proton collisions at a centre-of-mass energy of 7 TeV. The strong coupling constant has been determined using cross-section ratios in proton-antiproton collisions by the DØ [6] collaboration, where the running of the strong coupling constant was observed up to an energy scale of 400 GeV.
This note describes the measurement of two multi-jet cross-section ratios using proton-proton colli- sion data collected by the ATLAS experiment in 2010. The observed renormalization and factorization scale dependence of the pQCD predictions for the two ratio definitions used in the analysis is discussed.
The value of
αs(M
Z) is determined using the cross-section ratio measurement for which the NLO pQCD prediction has the smallest uncertainty. The measurement of
αsas a function of jet transverse momentum is consistent with the expected running of the strong coupling constant up to an energy scale of 800 GeV.
First, the definitions of the two cross-section ratios are presented, followed by a short description of the ATLAS detector. Theoretical predictions from fixed-order pQCD calculations and corrections for non-perturbative e
ffects are then discussed. Next the data selection and treatment is described, including the correction to particle level. Finally the ratio measurements are presented along with the method used to determine the value of
αs( M
Z) .
2 Definitions of cross-section ratios
Measurements of two different inclusive three-to-two jet cross-section ratios are presented in this note.
Jets in this analysis are defined using the anti-k
talgorithm [7] with a distance parameter of R
=0.6. In order to be counted, jets must satisfy p
T >40 GeV and
|y|<2.8. In addition, the leading jet in the event must satisfy p
leadT >60 GeV.
The first of these ratios depends on the p
Tof the leading jet in each selected event (p
leadT) and is defined as
R
3/2( p
leadT)
=dσ
Njet≥3/d pleadTdσ
Njet≥2/d pleadT(1)
where N
jetis the number of jets in each event satisfying the kinematic requirements defined above. This quantity is proportional to the probability that a two-jet event contains a third jet and is therefore directly proportional to the strength of the strong coupling constant.
1
The second measured ratio is defined as N
3/2(p
(all jets)T)
=PNjet
i
dσ
Njet≥3/d pT,i PNjeti
dσ
Njet≥2/d pT,i(2) This ratio is obtained by dividing the jet p
Tdistribution for events with at least three jets, by that of events with at least two jets. While the numerator and denominator used to define the quantity R
3/2receive a single entry per event, the numerator and denominator used to calculate N
3/2receive one entry per jet.
The quantity N
3/2has sensitivity to
αscomparable to that of R
3/2defined above.
Measurements of these two cross-section ratios are corrected for all experimental e
ffects in order to be compared to NLO pQCD predictions, corrected for non-perturbative e
ffects.
3 The ATLAS detector
The ATLAS detector [8]
1is a general purpose, multi-layer detector located at the LHC. From the centre outward, its main components are the inner tracking detector, the calorimeter system and the muon detector system.
Jet identification and reconstruction relies primarily on information obtained from the calorimeter system. The calorimeter system is divided into a central barrel and two endcaps. In each section, the innermost layers consist of a highly segmented liquid argon electromagnetic calorimeter while the outer layers are made of a more coarsely segmented hadronic calorimeter composed primarily of steel and plastic scintillator tiles.
The ATLAS trigger system is divided into three successive decision layers: a Level-1 hardware trig- ger followed by two layers of software trigger called Level-2 and Event Filter (not used in this analysis).
Early in the 2010 run, the selection of events based on single jet trigger requirements only relied on the Level-1 trigger decision. At Level-1, jet candidates are identified using a sliding window algorithm run- ning over calorimeter trigger towers. In the second part of the 2010 run, the selection of events based on single jet trigger requirements relied on both the Level-1 and Level-2 trigger decision. The Level-2 trig- ger system reconstructs jets in a region-of-interest using a simple cone algorithm running on calorimeter cells.
4 Monte Carlo Samples
The ALPGEN [9] Monte Carlo generator with the CTEQ6L1 [10] parton distribution functions (PDFs) is used to simulate jet production in proton-proton collisions at
√s
=7 TeV. This generator uses leading- order (LO) pQCD matrix elements to model hard scattering processes of two partons resulting in n-parton final states (i.e. 2
→n), where n ranges from two to six. The parton-level output is then interfaced with the showering and hadronization algorithm provided by HERWIG
/JIMMY [11–13]. These simulated samples are produced with the ATLAS Underlying Event Tune 1 (AUET1) [14] set of parameters. The four-vectors of these simulated samples are passed through the full simulation of the ATLAS detector and trigger [15] implemented using GEANT4 [16]. The simulated events are then reconstructed using the same algorithms and ATLAS analysis software used to process the data.
Correction factors, which are applied to NLO pQCD predictions to account for the non-perturbative e
ffects of hadronization and underlying event (see Section 5), are obtained using PYTHIA [17, 18] and
1ATLAS uses a right-handed coordinate system with its origin at the nominal interaction point (IP) in the centre of the detector and thez-axis along the beam pipe. Thex-axis points from the IP to the centre of the LHC ring, and they-axis points upward. Cylindrical coordinates (r, φ) are used in the transverse plane,φbeing the azimuthal angle around the beam pipe. The pseudorapidity is defined in terms of the polar angleθasη=−ln tan(θ/2).
HERWIG++ [19]. These generators employ leading-order pQCD matrix elements for the 2
→2 pro- cesses but have di
fferent parton showering algorithms and hadronization models.
5 Theoretical predictions
NLO pQCD predictions of jet transverse momentum distributions for events with at least two and three jets are computed with NLOJet++ [20, 21]. Predictions for the quantity N
3/2are obtained by inter- facing the NLOJet++ matrix element calculations with FastNLO [22, 23], thereby providing a means to e
fficiently compute all the required theoretical predictions as functions of various scales, PDFs and
αsvalues. The NLO theoretical predictions are obtained using the MSTW 2008 NLO [24] PDF set. This set is chosen because it provides the PDF sets determined with various fixed values of
αscovering a wide range of 0.110
< αs(M
Z)
<0.130 in steps of 0.001 in
αs. Uncertainties from PDFs are obtained following the standard prescription as described in Ref. [24].
NLO pQCD predictions for the values of R
3/2and N
3/2are obtained by dividing the respective in- clusive two-jet di
fferential cross-section distributions by the inclusive three-jet di
fferential cross-section distributions. The NLO pQCD predictions for R
3/2are obtained by setting the renormalization and fac- torization scales to the simulated leading jet p
T(µ
R =µF=p
leadT), while theoretical predictions for N
3/2are obtained by setting the renormalization and factorization scales to the p
Tof each jet (i.e the value of the matrix element is evaluated at the scale of each jet p
Tin an event). These scale values are chosen because they provide a good approximation of the energies at which the strong force produces outgoing partons in multijet events. The same definition of scales is used to obtain NLO pQCD predictions for events with at least two jets and events with at least three jets, thereby ensuring that the ratio predictions are obtained with a consistent scale definition. Futhermore, for N
3/2, this choice ensures that all jets in a given p
(all jets)Tbin of the distribution are evaluated at scales within that p
(all jets)Tbin’s width.
To estimate the impact of missing higher order terms in the calculations, the renormalization and factorization scales are varied independently by a factor of two up and down, while requiring that their ratio does not di
ffer by more than a factor of two [25]. The theoretical scale uncertainty is taken as the largest variation in the value of R
3/2and N
3/2within the allowed combinations of the scale variations described above. A study of the scale dependence of the pQCD predictions is presented below.
The NLO pQCD predictions are corrected to account for the non-perturbative e
ffects of hadroniza- tion and the underlying event in order to be compared with measurements. The multiplicative correction factors are obtained using PYTHIA with the ATLAS Minimum Bias Tune 1 (AMBT1) set of parame- ters [26] and MRST LO* [24,27] PDFs. The non-perturbative correction factors derived for the quantities R
3/2and N
3/2are nearly identical. These correction factors are well within 1% of unity over most of the p
leadTand p
(all jets)Trange. For jet transverse momentum values below approximately 200 GeV, the correc- tion factors are a
ffected by the underlying event contributions and increase up to
∼1.10 in the lowest p
Tbin (60
−80 GeV) for both R
3/2and N
3/2. The theoretical uncertainty associated with this non- pQCD correction is estimated as the maximum difference between the central value of the correction factors, and that obtained with other hadronization models and underlying event tunes (PYTHIA with the MC09 tune [28] and MRST LO* PDFs, PYTHIA [18] with tune 4C [29] and CTEQ6L1 PDFs, and HERWIG++ [19] with the event tune UE-EE-7000-3-CTEQ6L1 [30] and CTEQ6L1 PDFs).
5.1 Further details of the scale dependence of pQCD calculations
A detailed study of the behaviour of the fixed-order pQCD calculations for different values of
µRand
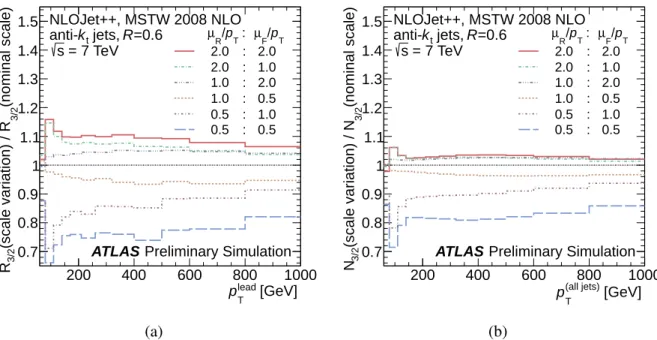
µFis performed. Figure 1 shows the e
ffect of setting the renormalization and factorization scale factors to different values. The ratio N
3/2is found to be less sensitive to the choice of scales, so it is used to extract the value of
αs.
3
[GeV]
lead
pT
200 400 600 800 1000
(nominal scale) 3/2(scale variation) / R3/2 R
0.7 0.8 0.9 1 1.1 1.2 1.3 1.4 1.5
pT F/ µ
T: p
R/ µ
2.0 : 2.0
1.0 : 2.0
2.0 : 1.0
0.5 : 1.0
1.0 : 0.5
0.5 : 0.5
ATLAS Preliminary Simulation NLOJet++, MSTW 2008 NLO
= 7 TeV s
=0.6 R jets, kt
anti-
[GeV]
(all jets)
pT
200 400 600 800 1000
(nominal scale) 3/2(scale variation) / N3/2 N
0.7 0.8 0.9 1 1.1 1.2 1.3 1.4 1.5
pT F/ µ
T: p
R/ µ
2.0 : 2.0
1.0 : 2.0
2.0 : 1.0
0.5 : 1.0
1.0 : 0.5
0.5 : 0.5
ATLAS Preliminary Simulation NLOJet++, MSTW 2008 NLO
= 7 TeV s
=0.6 R jets, kt
anti-
(a) (b)
Figure 1: Scale sensitivity of the theoretical predictions for the quantity R
3/2(a) and N
3/2(b), computed at
αs(M
Z)
=0.120. All jets are built from partons using the anti-k
talgorithm with a jet distance parameter of R
=0.6. Jets are required to satisfyp
T >40 GeV and
|y|<2.8. All events also satisfy p
leadT >60 GeV.
In order to understand the di
fference in the scale dependence of the quantities R
3/2and N
3/2, two- dimensional distributions in the
µRvs
µFplane of the predicted cross-section values are produced, for each p
leadTand p
(all jets)Tbin considered. Examples of such distributions are presented in Figure 2, which shows the predicted cross-sections for events with at least two and events with at least three jets, as well the predicted values of R
3/2for two di
fferent p
leadTbins. The two dimensional cross-section distributions are observed to exhibit a saddle point, as it often is the case for NLO pQCD calculations. The cross- section distributions calculated as a function of p
leadTfor the inclusive two jet and inclusive three jet event samples have a di
fferent dependence on the values of
µRand
µF. The position of the saddle point in the distributions of the cross-section for events with at least three jets is found to be independent of p
leadTand is observed to lie approximately at values of
µR ∼p
leadTand
µF ∼0.7p
leadT, close to the nominal values used in the analysis. However, the position of the saddle point in the distributions of the cross- section for events with at least two jets changes as a function of p
leadT, and reaches an apparent asymptotic behaviour at high values of p
leadTaround
µR ∼ µF ∼0.2 p
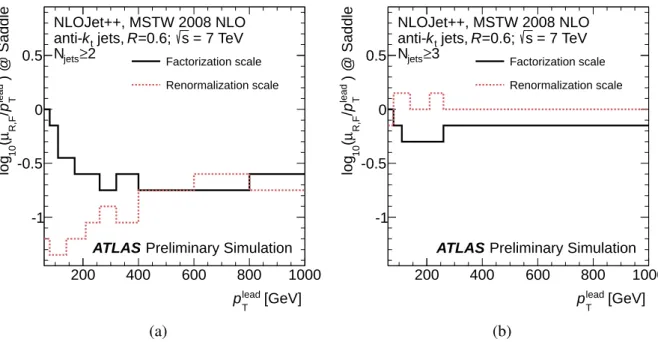
leadT, notably different than the nominal scale values used in the analysis. This dependence is shown in Figure 3. The di
fferent scale dependence of the pQCD calculations for the inclusive two jet and inclusive three jet event samples is responsible for the significantly larger sensitivity to variations in scale values observed for the quantity R
3/2, as compared to N
3/2.
The observed asymmetry in the scale uncertainty on the pQCD predictions for both R
3/2and N
3/2, with the negative variation being larger than the positive one, is a consequence of the choice of nominal scale values used for the analysis. The nominal scale values used for the analysis sit close to the region where the predicted values of R
3/2and N
3/2change rapidly. This is illustrated, for example, in Figure 2 (e) and (f). It can also be noted that including the scale variations (µ
R/pleadT , µF/pleadT)
=(0.5, 2) and (2,0.5) in the calculation of the scale uncertainty would not significantly change the uncertainty estimate.
Finally, the scale dependence of the pQCD calculations is also studied for jets reconstructed with
a distance parameter of R
=0.4. As observed in the context of other measurements [4], the pQCD
) [nb] Fµ , Rµ(lead Tp d / 2-jets≥σd
0 5 10
lead ) pT F/ µ
10( log
-1.5 -1 -0.5 0 0.5
)lead Tp/Rµ(10log
-1.5 -1 -0.5 0
0.5 NLOJet++, MSTW 2008 NLO < 170 GeV
lead
pT
140 GeV <
=0.6 R jets, kt
anti-
=7 TeV s
ATLAS
Preliminary Simulation
) [nb] Fµ , Rµ(lead Tp d / 2-jets≥σd
0 0.05 0.1 0.15 0.2
10-3
×
lead ) pT F/ µ
10( log
-1.5 -1 -0.5 0 0.5
)lead Tp/Rµ(10log
-1.5 -1 -0.5 0
0.5 NLOJet++, MSTW 2008 NLO < 800 GeV
lead
pT
600 GeV <
=0.6 R jets, kt
anti-
=7 TeV s
ATLAS
Preliminary Simulation
(a) (b)
) [nb] Fµ , Rµ(lead Tp d / 3-jets≥σd
0 0.5 1
lead ) pT F/ µ
10( log
-1.5 -1 -0.5 0 0.5
)lead Tp/Rµ(10log
-1.5 -1 -0.5 0
0.5 NLOJet++, MSTW 2008 NLO < 170 GeV
lead
pT
140 GeV <
=0.6 R jets, kt
anti-
=7 TeV s
ATLAS
Preliminary Simulation
) [nb] Fµ , Rµ(lead Tp d / 3-jets≥σd
0 0.05 0.1
10-3
×
lead ) pT F/ µ
10( log
-1.5 -1 -0.5 0 0.5
)lead Tp/Rµ(10log
-1.5 -1 -0.5 0
0.5 NLOJet++, MSTW 2008 NLO < 800 GeV
lead
pT
600 GeV <
=0.6 R jets, kt
anti-
=7 TeV s
ATLAS
Preliminary Simulation
(c) (d)
) Fµ , Rµ,lead Tp(3/2R
0 0.1 0.2 0.3 0.4
lead ) pT F/ µ
10( log
-1.5 -1 -0.5 0 0.5
)lead Tp/Rµ( 10log
-1.5 -1 -0.5 0 0.5
NLOJet++, MSTW 2008 NLO < 170 GeV
lead
pT
140 GeV <
=0.6 R jets, kt
anti-
=7 TeV s
ATLAS Preliminary Simulation lead )µ ,µ,p(R3/2TFR
0 0.2 0.4 0.6 0.8
lead ) pT F/ µ
10( log
-1.5 -1 -0.5 0 0.5
)lead Tp/Rµ( 10log
-1.5 -1 -0.5 0 0.5
NLOJet++, MSTW 2008 NLO < 800 GeV
lead
pT
600 GeV <
=0.6 R jets, kt
anti-
=7 TeV s
ATLAS Preliminary Simulation
(e) (f)
Figure 2: The two-jet di
fferential cross-section computed using NLOJ
et++for several values of renormalization (µ
R) and factorization (µ
F) scales (a,b). The three-jet di
fferential cross-section com- puted using NLOJet++ for several values of renormalization (µ
R) and factorization (µ
F) scales (c, d). The value of R
3/2computed using NLOJ
et++for several values of renormalization (µ
R) and fac- torization (µ
F) scale factors (e,f). Plots in the left column correspond to the jet transverse momen- tum range 140 GeV
<p
leadT <170 GeV while plots in the right column correspond to the range 600 GeV
<p
leadT <800 GeV. The saddle points are marked with the symbol “X” while the renormaliza- tion and factorization scale values used for the pQCD predictions in the analysis are shown using open circles. The white box on figures (e) and (f) delimits the region used to assess the scale uncertainty. All jets are built from partons using the anti-k
talgorithm with a jet distance parameter of R
=0.6. Jets arerequired to satisfy p
T >40 GeV and
|y|<2.8. All events also satisfy p
leadT >60 GeV.
5
[GeV]
lead
pT
200 400 600 800 1000
) @ Saddlelead Tp/ R,Fµ( 10 log
-1 -0.5 0
0.5 Factorization scale
Renormalization scale
NLOJet++, MSTW 2008 NLO = 7 TeV s
=0.6;
R jets, kt
anti-
≥2 Njets
ATLAS Preliminary Simulation
[GeV]
lead
pT
200 400 600 800 1000
) @ Saddlelead Tp/ R,Fµ( 10 log
-1 -0.5 0
0.5 Factorization scale
Renormalization scale
NLOJet++, MSTW 2008 NLO = 7 TeV s
=0.6;
R jets, kt
anti-
≥3 Njets
ATLAS Preliminary Simulation
(a) (b)
Figure 3: Values of the renormalization (µ
R) and factorization (µ
F) scales at the position of the saddle points in the two-dimensional space (µ
R,µ
F), as a function of p
leadT. Results are shown for the inclusive two-jet (a) and the inclusive three-jet (b) di
fferential cross-section calculated using NLOJ
et++. All jets are built from partons and satisfy p
T >40 GeV and
|y| <2.8. All events also satisfy p
leadT >60 GeV.
The quantized jumps in the values of
µRand
µFare just a consequence of the finite bin size used in the two-dimensional scans, examples of which are shown in Figure 2.
predictions obtained with a jet distance parameter of R
=0.4 are much more sensitive to changes in the renormalization and factorization scales by nearly a factor of two as compared to the scale sensitivity observed with jets reconstructed with R
=0.6. This motivates the choice of R
=0.6 for the measurements presented in this note.
Based on the observations described above, a value of
αs( M
Z) is obtained using the N
3/2distribution for jet transverse momentum values greater than 210 GeV.
6 Data selection and correction
The measurements presented here are obtained using the full 2010 dataset of proton-proton collisions collected at a
√s
=7 TeV. All data events require the detector components relevant to this analysis to have good operational status.
Events are selected using a set of single jet triggers with different transverse momentum threshold requirements. To control the accepted event rates in these triggers, and depending on the running condi- tions in the LHC, a “prescale factor” can be imposed on these triggers whereby only a predefined fraction of the events that satisfy the trigger requirements are actually recorded for offline analysis. The analysis restricts jets to be in the region
|y|<2.8 in order to ensure that the jet trigger selection, which covers the region
|η|<3.2, is unbiased. Only triggers that are more than 99% e
fficient for a given jet p
Tvalue are considered. For each p
leadTand p
(all jets)Tbin in the range of the measurement (60
−1000 GeV), the trigger with the lowest prescale is used to select events in that bin.
Particle tracks satisfying standard quality criteria with measured transverse momenta greater than
150 MeV are used to reconstruct the number and position of vertices in an event using the method
described in Ref. [31]. A primary vertex is required to be associated with at least five tracks. Only events
with exactly one reconstructed primary vertex are used in this analysis. This requirement significantly reduces pile-up contributions. The fraction of events with only one reconstructed vertex in each data taking periods varies from 90% in the early low luminosity runs down to 20% in the high luminosity runs at the end of 2010.
Jets are reconstructed using three-dimensional topological calorimeter energy clusters. These clusters are evaluated at the electromagnetic energy scale [32,33]. The transverse momentum of jets is calculated with respect to the event vertex. The energy of the reconstructed jets is then corrected to account for e
ffects such as calorimeter non-compensation, detector-induced showering and energy deposition in non- instrumented regions of the detector [34]. This calibration is used to obtain jets with a corrected energy scale.
Jets considered in the analysis are required to have a transverse momentum greater than 40 GeV and rapidity within
|y| <2.8. This minimum transverse momentum requirement is chosen to ensure that the jet reconstruction is fully efficient for all jets while minimizing the statistical uncertainty on the measurement. To ensure that all events considered in the analysis have a greater than 99% probability of satisfying the lowest trigger threshold used in the analysis, only events in which the leading jet transverse momentum is greater than 60 GeV are considered. This p
leadTrequirement is also useful to stabilize NLO pQCD calculations [35]. The jet rapidity requirement corresponds to a region of the detector where the overall detector performance is well-understood, and also reduces the renormalization and factorization scale uncertainty in the NLO pQCD calculations.
Additional jet quality requirements are applied to eliminate fake or mismeasured jets due to various instrumental e
ffects and non-collision background [36].
Only events with at least two selected jets are considered in the analysis. Comparisons between Monte Carlo simulated distributions and data for some basic kinematic variables are shown in Figure 4.
[GeV]
(all jets)
pT
200 400 600 800 1000 1200
Arbitrary Normalisation
10-7
10-6
10-5
10-4
10-3
10-2
10-1
1
Data 2010
ALPGEN+JIMMY/HERWIG
ATLAS Preliminary
=0.6 R jets, kt
anti- = 7 TeV s
[GeV]
(all jets)
p
T200 400 600 800 1000 1200
MC / Data
0.5 1
1.5 (all jets)
η
-2 -1 0 1 2
Arbitrary Normalisation
0.02 0.04 0.06 0.08 0.1
Data 2010
ALPGEN+JIMMY/HERWIG
ATLAS Preliminary
=0.6 R jets, kt
anti- = 7 TeV s
(all jets)
η
-2 -1 0 1 2
MC / Data
0.5 1 1.5
(a) (b)
Figure 4: Comparison between Monte Carlo simulated events and data of the jet transverse momen- tum (a) and jet pseudorapidity (b) distributions for events with at least two jets. All distributions are normalized to have an area of one. The black error bars and yellow bands represent the statistical uncer- tainties on the data and Monte Carlo samples, respectively. The data are corrected to account for trigger prescales. All analysis cuts are applied.
7
6.1 Data correction of detector e ff ects
Detector ine
fficiencies and resolution e
ffects are accounted for using a bin-by-bin multiplicative correc- tion factor to the measurements. Correction factors are obtained using the ALPGEN+HERWIG/JIMMY sam- ples described in Section 4.
The statistical uncertainty on R
3/2and N
3/2associated with the finite number of data and simulated events is propagated through the correction for detector effects with the use of pseudo-experiments. En- sembles of pseudo-experiments are created using the so-called “bootstrap method” [37, 38], to properly account for bin-to-bin correlations and correlations between the inclusive two- and three-jet samples.
Pseudo-experiments are generated by drawing with replacement from the original sample, based on a Poisson-distributed random number. In this approach, pseudo-experiments are created out of a subset of the original events, with some events being used multiple times.
6.2 Systematic uncertainties
The following sources of uncertainties are considered and propagated through the correction of the data for detector effects.
The largest uncertainty on the measurement of R
3/2and N
3/2comes from the knowledge of the jet energy scale. Several di
fferent sources of systematic uncertainties on the jet energy scale are considered.
Details on how each component of the overall uncertainty is derived and its respective magnitude is described in Ref. [34]. The uncertainty on the measured values of R
3/2and N
3/2due to each uncertainty component is assessed using a toy Monte Carlo approach implemented by repeatedly shifting the p
Tof all jets in the Monte Carlo simulation by a correlated fraction corresponding to each jets uncertainty component. The uncertainty for each component is taken as the variance obtained by correcting the data with each of the toy Monte Carlo iterations used. The total jet energy scale uncertainty varies from a maximum of 10% in the first bin (60
−80 GeV) for R
3/2and 7% in the first bin for N
3/2to approximately 3% at the highest p
Tvalues for both R
3/2and N
3/2.
An uncertainty due to the finite jet energy resolution and angular resolution is also estimated. This uncertainty is computed using a toy Monte Carlo approach where the transverse momentum and pseudo- rapidity of each jet is varied in Monte Carlo simulations to worsen the resolution by an amount propor- tional to the corresponding measured resolutions. The jet energy and angular resolution uncertainties are taken as the variance in the distribution obtained from the ensemble of toy Monte Carlo samples.
Measurements of the jet energy resolution are presented in Ref. [39], and the measured resolutions vary between 4% to 14% depending on the jet transverse momentum and pseudorapidity. Since the analysis is completely independent of azimuthal coordinates, only effects of the pseudorapidity resolution are considered for angular resolution uncertainty calculations. The conservative value of 0.1 is used as the
ηresolution, which corresponds to the maximum
ηgranularity of the electromagnetic calorimeter and of the first two layers of the hadronic calorimeter [40, 41]. The resulting uncertainties due to jet energy resolution effects are less than 3% throughout the entire p
Trange studied for both R
3/2and N
3/2, while angular resolution e
ffects result in negligible uncertainties of less than 1%.
Although the impact of multiple collisions (pile-up) is greatly reduced due to the event selection requirement that the event has exactly one reconstructed vertex, a systematic uncertainty accounting for possible di
fferences in pile-up conditions between data and the Monte Carlo simulation used to correct the data is estimated. For that, Monte Carlo samples are generated with an average of approximately 2 additional soft collisions per event and taking into account or not overlapping signals in the detector from neighbouring bunch crossings. The di
fference in the data correction factors obtained with respect to the default sample without pile-up when integrated over the entire p
leadTand p
(all jets)Trange is taken as a systematic uncertainty. The uncertainty due to pile-up effects is 2% for R
3/2and 1.5% for N
3/2.
An uncertainty due to the trigger selection is conservatively estimated to be 1% for each of the
inclusive two-jet and three-jet p
leadTand p
(all jets)Tdistributions. This choice is based on the fact that the single jet trigger used in a specific bin is required to have an e
fficiency greater than 99% and that this trigger efficiency is determined at a level better than 1%. The uncertainty estimate is propagated through to the calculation of the corrected R
3/2and N
3/2values.
The impact of the jet quality requirements is assessed by measuring R
3/2and N
3/2with di
fferent jet quality requirements. The maximum difference from the nominal distributions is taken as a symmetric uncertainty. This uncertainty is less than 0.5% up to 800 GeV in p
leadTand p
(all jets)T.
Bin-by-bin correction factors for data are computed entirely from Monte Carlo simulation. A sys- tematic uncertainty due to a possible mis-modelling of the p
leadTand p
(all jets)Tdistributions is estimated using a closure test. The test consists of first reweighting the particle-level jet transverse momentum distributions, separately, for the inclusive two-jet and inclusive three-jet samples. The weights are cho- sen to improve the agreement of the jet transverse p
Tdistributions between data and simulation at the reconstructed-level, where the latter is obtained by evolving the particle-level distributions to the recon- structed level using the full jet energy smearing information contained in a transfer matrix. The modified reconstructed distributions are then corrected back to particle-level using the default data correction fac- tors. The result is compared with the initial reweighted particle-level distributions, and the resulting bias is interpreted as the systematic uncertainty. This closure test is performed with an ensemble of pseudo- experiments obtained as described above. The estimated uncertainty is less than
∼1% over the entire
p
leadTand p
(all jets)Tranges considered.
7 Results
Measurements of R
3/2and N
3/2corrected to the particle level are shown in Figure 5 for jets reconstructed with R
=0.6. In this figure, the shaded error band bracketing the measured cross-section corresponds to the total uncertainty, obtained by summing in quadrature the contribution from each individual systematic uncertainty described in Section 6.2 and the total statistical uncertainty. These measurements are com- pared to NLO pQCD predictions, corrected for non-perturbative e
ffects, obtained with
αs(M
Z)
=0.110 and 0.130. The pQCD predictions overall describe the data well, except in the region p
leadT <140 GeV where the pQCD predictions are lower than the R
3/2measurements. The measurements of the quantity R
3/2are consistent with the ATLAS published results [4], when the analysis presented here is repeated with the same jet transverse momentum requirements.
8 Determination of the strong coupling constant
As discussed in Section 5.1, the value of the strong coupling constant is determined by comparing the particle-level measured values of N
3/2to that predicted by NLOJet++ for different values of
αs.
A least-squares fit is used to fit the measurements to the theoretical predictions as a function of
αs(M
Z) in the range 210 GeV
<p
(all jets)T <800 GeV. The
χ2function used in the fit is defined to take into account correlated sources of systematic uncertainties using nuisance parameters. The full covariance matrix for the total statistical uncertainty is used in the
χ2function definition. The least-squares fit is performed by minimizing the
χ2value with respect to
αs(M
Z) and the nuisance parameters taken as free parameters. This approach allows the fit to slightly modify, if needed, the theoretical predictions, in a correlated way, to best fit the measurements, thereby taking into account the finite precision at which the theoretical predictions and measured data points are known. The one sigma uncertainty on the central value of
αs(M
Z) is defined by an increase in the
χ2function by one unit from its minimum value.
The contribution of the theoretical uncertainties (PDF uncertainty and uncertainty on the non-pQCD correction) to the fitted value of
αs(M
Z) is obtained using the “o
ffset method”. In this method, fitted
9
[GeV]
lead
pT
70 100 200 300 1000
Theory/Data
0.6 0.8 1
1.2 102 103
lead Tp3/2R
0 0.2 0.4 0.6 0.8
Data 2010 NLO pQCD, PDF MSTW2008NLO and non-pert. corrections
)=0.110 (MZ
αS
)=0.130 (MZ
αS
ATLAS Preliminary = 7 TeV s
=0.6 R jets, kt
anti-
[GeV]
(all jets)
pT
70 100 200 300 1000
Theory/Data
0.6 0.8 1
1.2 102 103
(all jets) Tp3/2N
0 0.2 0.4 0.6 0.8
Data 2010 NLO pQCD, PDF MSTW2008NLO and non-pert. corrections
)=0.110 (MZ
αS
)=0.130 (MZ
αS
ATLAS Preliminary = 7 TeV s
=0.6 R jets, kt
anti-
(a) (b)
Figure 5: Measurements of R
3/2(a) and N
3/2(b), at particle-level, as a function of p
leadTand p
(all jets)T, respectively. NLO pQCD theoretical predictions, corrected for non-perturbative e
ffects, are also shown for a value of
αs(M
Z) of 0.110 and 0.130. The black error bars correspond to the statistical uncertainty on the measured values while the yellow bands correspond to the total experimental uncertainty. The red and blue error bars correspond to the total theoretical uncertainty on the respective NLO pQCD theoretical predictions, obtained by summing in quadrature the uncertainty from the non-pQCD correction, PDFs and scales. They are offset for clarity. These results are obtained using jets reconstructed with R
=0.6.
values of
αs(M
Z) are obtained by performing the least-squares fit with theoretical predictions shifted by
±1σ
for each of the uncertainty sources listed above. Each theoretical uncertainty contribution to the final central
αs(M
Z) value is taken as the di
fference in
αs( M
Z) value obtained with and without shifting the theoretical predictions by
±1σ. To estimate the scale uncertainty on the fitted value ofαs(M
Z) , the fit is performed using theoretical predictions obtained with the six different variations of renormalization and factorization scales described in Section 5. The scale uncertainty on
αs( M
Z) is taken as the largest positive and negative variation in the fitted value of
αs(M
Z) .
The least-squares fit is performed both individually in each p
(all jets)Tbin and also by simultaneously fitting all p
(all jets)Tbins. The combined fit results in a value of
αs(M
Z)
=0.111±0.006 with a
χ2value of 7.1 for the 6 bins considered (5 degrees of freedom). The scale uncertainty is determined to be
+−0.0030.016, while the uncertainties due to non-pQCD corrections and PDFs are found to be negligible. The strong coupling constant is therefore determined to have a value of
αs
(M
Z)
=0.111
±0.006(exp.)
+0.016−0.003(theory).
This result is in statistical agreement with the accepted world average of
αs(M
Z)
=0.1184
±0.0007 [42, 43], as well as with the CDF and DØ results of
αs( M
Z)
=0.1178
±0.0001(stat.)
+−0.00950.0081(syst.) [44]
and
αs(M
Z)
=0.1191
+0.0048−0.0071[6], respectively.
Values of
αs(M
Z) are also determined using pQCD predictions obtained with the following additional
PDF sets: CT10 [45], HERAPDF 1.5 [46], ABM11 [47] and NNPDF 2.3 [48]. Table 1 summarizes
the central value of
αs(M
Z) obtained and associated experimental uncertainty. The values of
αs( M
Z)
obtained with the different PDFs all agree within uncertainties.
(M
Z)
MSTW08 0.111
±0.006
CT10 0.109
±0.006
HERAPDF 1.5 0.114
±0.005
ABM11 0.116
±0.005
NNPDF 2.3 0.112
±0.005
Table 1: Values of
αs( M
Z) obtained by fitting the measured N
3/2distributions with NLO pQCD calcula- tions based on di
fferent sets of PDFs. The uncertainty on the central
αsvalue quoted is the experimental uncertainty on
αs(M
Z) .
The
αS(M
Z) results from individual p
(all jets)Tbins are evolved to the average p
Tvalue in each bin using the two-loop approximate solution to the Renormalization Group Equation (RGE) [49] to study the scale dependence of the strong coupling constant. The resulting distribution is shown in Figure 6.
The observed energy scale dependence of the strong coupling constant is in good agreement with the DØ [6, 50], ZEUS [51] and H1 [52, 53]
αsvalues and the RGE predictions obtained from the world average
αs(M
Z) value of 0.1184
±0.0007 [42, 43]. Results from this analysis are consistent with the RGE predictions up to an energy scale of 800 GeV.
Q [GeV]
10 102 103
(Q) Sα
0.08 0.1 0.12 0.14 0.16 0.18 0.2 0.22 0.24
N3/2
ATLAS 2010 inclusive jet O
D
∆ R
R O D
H1 inclusive jet ZEUS inclusive jet PDG 2012 world average
0.0007
± )= 0.1184 (MZ
αs
ATLAS Preliminary
Figure 6: Strong coupling constant
αsextracted from ATLAS N
3/2, DØ [6, 50], ZEUS [51] and H1 [52, 53] as a function of the renormalization scale Q. Error bars on the points from DØ, ZEUS and H1 correspond to the total uncertainty (sum in quadrature of experimental and theoretical uncertainties).
The black error bars on the ATLAS 2010 points correspond to the experimental uncertainties while the shaded error band corresponds to the total uncertainty. The plot shows good agreement between the ATLAS measurements and predictions obtained from the RGE two-loop solution [49] evaluated at the world average value of 0.1184
±0.0007 [42, 43].
11
9 Conclusion
Ratios of inclusive three- to two-jet cross-sections as a function of the leading jet p
T(R
3/2) and the p
Tof each jet in an event (N
3/2) are measured at ATLAS using the full 2010 dataset at a collision centre- of-mass energy of 7 TeV. For the kinematical phase space considered in this analysis, these studies show that the ratio N
3/2is a preferred quantity to determine a value of the strong coupling constant as compared to R
3/2. The strength of the strong coupling constant is determined to be
αs( M
Z)
=0.111
±0.006(exp.)
+−0.0030.016(theory) using the distribution of the quantity N
3/2. This result is compatible with the
αs(M
Z) world average value. The measured energy scale dependence of
αsup to a scale of 800 GeV is compatible with the evolution predicted by the Renormalisation Group Equation.
References
[1] CDF Collaboration, Properties of high mass multi-jet events at the Fermilab p¯p collider, Phys.
Rev. Lett.
75(1995) 608.
[2] DØ Collaboration, Ratios of multijet cross sections in p¯p collisions at
√s
=1.8 TeV, Phys. Rev.
Lett.
86(2001) 1955.
[3] DØ Collaboration, Measurement of the ratio of three-jet to two-jet cross sections in p p collisions ¯ at
√s
=1.96 TeV, Phys. Lett. B
720(2013) 6.
[4] ATLAS Collaboration, Measurement of multi-jet cross sections in proton-proton collisions at a 7 TeV center-of-mass energy, Eur. Phys. J.
C71(2011) 1763.
[5] CMS Collaboration, Measurement of the ratio of the 3-jet to 2-jet cross sections in pp collisions at
√
s
=7 TeV, Phys. Lett. B
702(2011) 336.
[6] DØ Collaboration, Measurement of angular correlations of jets at
√s
=1.96 TeV and
determination of the strong coupling at high momentum transfers, Phys.Lett.
B718(2012) 56–63.
[7] M. Cacciari, G. Salam and G. Soyez, The anti-kt jet clustering algorithm, JHEP
04(2008) 063.
[8] ATLAS Collaboration, The ATLAS Experiment at the CERN Large Hadron Collider, JINST
3(2008) S08003.
[9] M. L. Mangano et al., ALPGEN, a generator for hard multiparton processes in hadronic collisions, JHEP
07(2003) 001.
[10] CTEQ Collaboration, J. Pumplin et al., New generation of parton distributions with uncertainties from global QCD analysis, JHEP
07(2002) 012.
[11] G. Corcella et al., HERWIG 6.5: an event generator for Hadron Emission Reactions With Interfering Gluons (including supersymmetric processes), JHEP
01(2001) 010.
[12] G. Corcella et al. HERWIG 6.5 Release Note, (2005),
arXiv:hep-ph/0210213v2.[13] J. M. Butterworth, J. R. Forshaw and M. H. Seymour, Multiparton Interactions in Photoproduction at HERA, Z. Phys.
C72(1996) 637.
[14] ATLAS Collaboration, First tuning of HERWIG
/JIMMY to ATLAS data,
ATL-PHYS-PUB-2010-014.
[15] ATLAS Collaboration, The ATLAS Simulation Infrastructure, Eur. Phys. J.
C70(2010) 823–874.
[16] S. Agostinelli et al., Geant4 - a simulation toolkit, Nucl. Instr. and Meth. in Phys. Research A
506(2003) 250.
[17] T. Sjostrand et al., PYTHIA 6.4 Physics and Manual, JHEP
0605(2006) 026.
[18] S. M. T. Sjostrand and P. Skands, A Brief Introduction to PYTHIA 8.1, Comput. Phys. Commun.
178


![Figure 6: Strong coupling constant α s extracted from ATLAS N 3/2 , DØ [6, 50], ZEUS [51] and H1 [52, 53] as a function of the renormalization scale Q](https://thumb-eu.123doks.com/thumbv2/1library_info/4021822.1541830/12.892.286.607.514.818/figure-strong-coupling-constant-extracted-atlas-function-renormalization.webp)
