arXiv:hep-ex/0603015 v1 8 Mar 2006
Measurement of the Υ Production Cross Section in 920 GeV Fixed-Target Proton-Nucleus Collisions
The HERA-B collaboration
I. Abt23, M. Adams10, M. Agari13, H. Albrecht12, A. Aleksandrov29, V. Amaral8, A. Amorim8, S. J. Aplin12, V. Aushev16, Y. Bagaturia12,36,
V. Balagura22, M. Bargiotti6, O. Barsukova11, J. Bastos8, J. Batista8, C. Bauer13, Th. S. Bauer1, A. Belkov11,†, Ar. Belkov11, I. Belotelov11, A. Bertin6, B. Bobchenko22, M. B¨ocker26, A. Bogatyrev22, G. Bohm29, M. Br¨auer13, M. Bruinsma28,1, M. Bruschi6, P. Buchholz26, T. Buran24,
J. Carvalho8, P. Conde2,12, C. Cruse10, M. Dam9, K. M. Danielsen24, M. Danilov22, S. De Castro6, H. Deppe14, X. Dong3, H. B. Dreis14, V. Egorytchev12, K. Ehret10, F. Eisele14, D. Emeliyanov12, S. Essenov22,
L. Fabbri6, P. Faccioli6, M. Feuerstack-Raible14, J. Flammer12, B. Fominykh22, M. Funcke10, Ll. Garrido2, A. Gellrich29, B. Giacobbe6, J. Gl¨aß20, D. Goloubkov12,33, Y. Golubkov12,34, A. Golutvin22, I. Golutvin11,
I. Gorbounov12,26, A. Goriˇsek17, O. Gouchtchine22, D. C. Goulart7, S. Gradl14, W. Gradl14, F. Grimaldi6, Yu. Guilitsky22,35, J. D. Hansen9,
J. M. Hern´andez29, W. Hofmann13, M. Hohlmann12, T. Hott14, W. Hulsbergen1, U. Husemann26, O. Igonkina22, M. Ispiryan15, T. Jagla13,
C. Jiang3, H. Kapitza12, S. Karabekyan25, N. Karpenko11, S. Keller26, J. Kessler14, F. Khasanov22, Yu. Kiryushin11, I. Kisel23, E. Klinkby9, K. T. Kn¨opfle13, H. Kolanoski5, S. Korpar21,17, C. Krauss14, P. Kreuzer12,19,
P. Kriˇzan18,17, D. Kr¨ucker5, S. Kupper17, T. Kvaratskheliia22, A. Lanyov11, K. Lau15, B. Lewendel12, T. Lohse5, B. Lomonosov12,32, R. M¨anner20, R. Mankel29, S. Masciocchi12, I. Massa6, I. Matchikhilian22, G. Medin5, M. Medinnis12, M. Mevius12, A. Michetti12, Yu. Mikhailov22,35, R. Mizuk22,
R. Muresan9, M. zur Nedden5, M. Negodaev12,32, M. N¨orenberg12, S. Nowak29, M. T. N´u˜nez Pardo de Vera12, M. Ouchrif28,1, F. Ould-Saada24,
C. Padilla12, D. Peralta2, R. Pernack25, R. Pestotnik17, B. AA. Petersen9, M. Piccinini6, M. A. Pleier13, M. Poli6,31, V. Popov22, D. Pose11,14, S. Prystupa16, V. Pugatch16, Y. Pylypchenko24, J. Pyrlik15, K. Reeves13,
D. Reßing12, H. Rick14, I. Riu12, P. Robmann30, I. Rostovtseva22, V. Rybnikov12, F. S´anchez13, A. Sbrizzi1, M. Schmelling13, B. Schmidt12,
A. Schreiner29, H. Schr¨oder25, U. Schwanke29, A. J. Schwartz7, A. S. Schwarz12, B. Schwenninger10, B. Schwingenheuer13, F. Sciacca13, N. Semprini-Cesari6, S. Shuvalov22,5, L. Silva8, L. S¨oz¨uer12, S. Solunin11,
A. Somov12, S. Somov12,33, J. Spengler13, R. Spighi6, A. Spiridonov29,22, A. Stanovnik18,17, M. Stariˇc17, C. Stegmann5, H. S. Subramania15, M. Symalla12,10, I. Tikhomirov22, M. Titov22, I. Tsakov27, U. Uwer14,
C. van Eldik12,10, Yu. Vassiliev16, M. Villa6, A. Vitale6, I. Vukotic5,29, H. Wahlberg28, A. H. Walenta26, M. Walter29, J. J. Wang4, D. Wegener10,
U. Werthenbach26, H. Wolters8, R. Wurth12, A. Wurz20, Yu. Zaitsev22, M. Zavertyaev12,13,32, T. Zeuner12,26, A. Zhelezov22, Z. Zheng3,
R. Zimmermann25, T. ˇZivko17, A. Zoccoli6
1NIKHEF, 1009 DB Amsterdam, The Netherlands a
2Department ECM, Faculty of Physics, University of Barcelona, E-08028 Barcelona, Spain b
3Institute for High Energy Physics, Beijing 100039, P.R. China
4Institute of Engineering Physics, Tsinghua University, Beijing 100084, P.R.
China
5Institut f¨ur Physik, Humboldt-Universit¨at zu Berlin, D-12489 Berlin, Germany c,d
6Dipartimento di Fisica dell’ Universit`a di Bologna and INFN Sezione di Bologna, I-40126 Bologna, Italy
7Department of Physics, University of Cincinnati, Cincinnati, Ohio 45221, USA e
8LIP Coimbra, P-3004-516 Coimbra, Portugal f
9Niels Bohr Institutet, DK 2100 Copenhagen, Denmark g
10Institut f¨ur Physik, Universit¨at Dortmund, D-44221 Dortmund, Germany d
11Joint Institute for Nuclear Research Dubna, 141980 Dubna, Moscow region, Russia
12DESY, D-22603 Hamburg, Germany
13Max-Planck-Institut f¨ur Kernphysik, D-69117 Heidelberg, Germany d
14Physikalisches Institut, Universit¨at Heidelberg, D-69120 Heidelberg, Germany d
15Department of Physics, University of Houston, Houston, TX 77204, USA e
16Institute for Nuclear Research, Ukrainian Academy of Science, 03680 Kiev, Ukraine h
17J. Stefan Institute, 1001 Ljubljana, Slovenia i
18University of Ljubljana, 1001 Ljubljana, Slovenia
19University of California, Los Angeles, CA 90024, USA j
20Lehrstuhl f¨ur Informatik V, Universit¨at Mannheim, D-68131 Mannheim, Germany
21University of Maribor, 2000 Maribor, Slovenia
22Institute of Theoretical and Experimental Physics, 117259 Moscow, Russia k
23Max-Planck-Institut f¨ur Physik, Werner-Heisenberg-Institut, D-80805 M¨unchen, Germany d
24Dept. of Physics, University of Oslo, N-0316 Oslo, Norway l
25Fachbereich Physik, Universit¨at Rostock, D-18051 Rostock, Germany d
26Fachbereich Physik, Universit¨at Siegen, D-57068 Siegen, Germanyd
27Institute for Nuclear Research, INRNE-BAS, Sofia, Bulgaria
28Universiteit Utrecht/NIKHEF, 3584 CB Utrecht, The Netherlands a
29DESY, D-15738 Zeuthen, Germany
30Physik-Institut, Universit¨at Z¨urich, CH-8057 Z¨urich, Switzerland m
31visitor from Dipartimento di Energetica dell’ Universit`a di Firenze and INFN Sezione di Bologna, Italy
32visitor from P.N. Lebedev Physical Institute, 117924 Moscow B-333, Russia
33visitor from Moscow Physical Engineering Institute, 115409 Moscow, Russia
34visitor from Moscow State University, 119899 Moscow, Russia
35visitor from Institute for High Energy Physics, Protvino, Russia
36visitor from High Energy Physics Institute, 380086 Tbilisi, Georgia
†deceased
a supported by the Foundation for Fundamental Research on Matter (FOM), 3502 GA Utrecht, The Netherlands
b supported by the CICYT contract AEN99-0483
c supported by the German Research Foundation, Graduate College GRK 271/3
d supported by the Bundesministerium f¨ur Bildung und Forschung, FRG, under contract numbers 05-7BU35I, 05-7DO55P, 05-HB1HRA, 05-HB1KHA,
05-HB1PEA, 05-HB1PSA, 05-HB1VHA, 05-HB9HRA, 05-7HD15I, 05-7MP25I, 05-7SI75I
e supported by the U.S. Department of Energy (DOE)
f supported by the Portuguese Funda¸c˜ao para a Ciˆencia e Tecnologia under the program POCTI
g supported by the Danish Natural Science Research Council
h supported by the National Academy of Science and the Ministry of Education and Science of Ukraine
i supported by the Ministry of Education, Science and Sport of the Republic of Slovenia under contracts number P1-135 and J1-6584-0106
j supported by the U.S. National Science Foundation Grant PHY-9986703
k supported by the Russian Ministry of Education and Science, grant SS-1722.2003.2, and the BMBF via the Max Planck Research Award
l supported by the Norwegian Research Council
m supported by the Swiss National Science Foundation Abstract
The proton-nucleon cross section ratio R= Br(Υ→l+l−)·dσ(Υ)/dy|y=0/ σ(J/ψ) has been measured with the HERA-B spectrometer in fixed-target proton-nucleus collisions at 920 GeV proton beam energy corresponding to a proton-nucleon cms energy of√
s= 41.6 GeV. The combined results for the decay channels Υ→e+e− and Υ→µ+µ− yield a ratioR= (9.0±2.1)·10−6. The corresponding Υ production cross section per nucleon at mid-rapidity (y= 0) has been determined to be Br(Υ→ l+l−)·dσ(Υ)/dy|y=0 = 4.5±1.1 pb/nucleon.
Key words:
Υ mesons, cross section, proton-nucleus collisions, √
s= 41.6 GeV PACS:13.20.Gd, 13.85.Qk, 14.40.Gx, 24.85.+p
1 Introduction
In recent years, there has been a rapid development of models describing quarkonium, especially charmonium, production, with great success both in the high- and low-energy range (see e.g. review [1,2] and references therein).
These developments are driven by the available measurements of charmonium production, and the implication of a possible suppression of charmonium pro- duction as an indicator for a Quark-Gluon Plasma (QGP) [3,4]. Bottomonium production represents a natural field for testing the predictions of these mod- els [1]. Measurements of the Υ production cross section1 have been performed by many experiments [5]–[18] in the wide range of the proton-nucleon centre- of-mass (cms) energy √
s of 19 to 1800 GeV, and with targets ranging from proton (A = 1) to platinum (A = 195) with both proton and antiproton beams.
Usually, the result of bottomonium production measurements is presented as the product of the differential cross section at mid-rapiditydσ(Υ)/dy|y=0 times branching ratio [1]. However, the acceptance of most of the fixed-target ex- periments which have so far measured bottomonium production, is not in the region of central collisions,y= 0, so that systematic effects in determining the total cross section can be substantial. More specifically, precisely in the en- ergy region of HERA-B, the available results [10,12] disagree by about a factor of two (see Table 12) which cannot be explained by a large nuclear suppres- sion [19]. HERA-B covers the region of mid-rapidity, implying less uncertainty in the determination of the total cross section, and can thus contribute to the knowledge of Υ production, despite its rather small sample size. Furthermore, both Υ→µ+µ− and Υ→e+e− decay channels are measured simultaneously, providing an additional statistically independent cross check.
2 Measurement method
We determine the Υ production cross section by comparing the relative yields of Υ and J/ψ production, and normalizing to the known J/ψ cross section:
1 Throughout this paper we refer to the sum of Υ(1S) + Υ(2S) + Υ(3S) cross sections as the Υ cross section.
2 Both papers [10,12] quote the differential cross section in terms of the Feynman scaling variablexF which we transform to rapidityy. The two quantities are related via dσ(Υ)/dxF|xF=0 = F(√
s)·dσ(Υ)/dy|y=0, where F(√
s) is a coefficient which depends on the (measured) transverse momentum distribution of the produced Υ mesons. Its numerical value is 1.98±0.03 and 2.12±0.03 for √
s= 38.8 GeV and
√s= 41.6 GeV, respectively.
Table 1
Summary of the available measurements of the Υ production cross section in pA collisions near√
s= 41.6 GeV. The published result of [12] refers to the production of Υ(1S) only and has been rescaled using Eq. (4) to also include Υ(2S) and Υ(3S).
In the case of E771 [13], the published value has been corrected to include the Υ(3S) state and the coefficient ∆yeff (see Sect. 4.4). Overall normalization uncertainties of 15% (Ref. [10]) and 10% (Ref. [12]) have been included.
√s, Br(Υ→l+l−)·dσ(Υ)/dy|y=0, Tar- Expe-
GeV pb/nucleon get riment
38.8 2.11±0.33 Cu E605 [10]
38.8 2.31±0.38 Be E605 [11]
38.8 4.7±0.5 D E772 [12]
38.8 7.7±3.2 Si E771 [13]
Br(Υ→l+l−)· dσ dy(Υ)
y=0 = Br(J/ψ→l+l−)· σ(J/ψ)· N(Υ) N(J/ψ)
ε(J/ψ) ε(Υ)
1
∆yeff
(1)
and in addition, we define the ratio of the mid-rapidity Υ cross section to the total J/ψ cross section as
RJ/ψ ≡ Br(Υ→l+l−)·dσ(Υ)/dy|y=0
σ(J/ψ) . (2)
Here, σ(J/ψ) is theJ/ψ production cross section, andN(Υ) and N(J/ψ) are the numbers of observed Υ andJ/ψdecays, respectively. The branching ratio J/ψ→l+l− is taken as the average of the most recent values forJ/ψ→e+e− and J/ψ→µ+µ− [20], ε(J/ψ)/ε(Υ) is the ratio of J/ψ and Υ trigger and re- construction efficiencies determined from Monte Carlo simulations, and ∆yeff is the coefficient relating the full and differential Υ cross section at mid-rapidity y= 0:σ(Υ) = ∆yeff dσ(Υ)/dy|y=0 (see Sect. 4.4). In this way the result is in- dependent of the luminosity determination, and systematic uncertainties due to absolute trigger efficiencies cancel out to a large extent, since only relative efficiencies between Υ andJ/ψand relative acceptances enter the final result.
Forσ(J/ψ) at √
s= 41.6 GeV we use the value
σpN(J/ψ) = 502±44 nb
nucleon (3)
obtained from a global fit [21] of J/ψ production data3, after adjusting the data using a common nuclear suppression parameterα = 0.96±0.01 [19] and the latest value of branching ratio Br(J/ψ → l+l−) [20]. Eq. (1) assumes the same numerical values of α parameters for Υ and J/ψ production in accor- dance with the experimental data [19,23].
3 The HERA-B detector and the data sample
HERA-B is a fixed-target experiment at the 920-GeV HERA proton storage ring of DESY and consists of a forward magnetic spectrometer featuring a high resolution vertexing and tracking system and offering a good coverage of the central region of collisions (the xF range is about [−0.6,0.15] for Υ production and about [−0.35,0.15] for J/ψ production, corresponding to the rapidity ranges about [−1.2,0.3] and [−1.5,0.5], respectively).
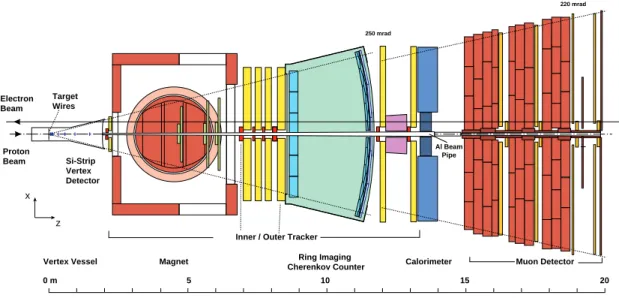
The main components of the detector are sketched in Fig. 1. The target con- sists of wires of various materials which are inserted into the halo of the HERA proton beam. Data are taken with carbon, tungsten and titanium target wires operated at an interaction rate between 5 and 8 MHz. The Vertex Detec- tor System (VDS) consists of silicon micro-strip detectors located within the vacuum vessel of the target. The first station of the main tracker is placed upstream of the 2.13 T·m dipole magnet and the remaining 6 tracking sta- tions are placed downstream. Muon identification is performed by the muon detector (MUON), while the electrons are detected and identified by the elec- tromagnetic calorimeter (ECAL).
The trigger chain includes pretriggers provided by ECAL and MUON for the lepton candidate search, and a first level trigger (FLT) which finds tracks downstream of the magnet starting from the pretrigger seeds. The FLT re- quires that at least two pretrigger candidates be present in an event and that an FLT track be found from at least one of them. The (software) second level trigger (SLT) starts from pretrigger candidate tracks, confirms them in the tracker and VDS using a simplified Kalman filter algorithm, and accepts the event if either two electron or two muon candidates with a common vertex are found. The trigger imposes a cut on the transverse energyET of the electrons, and an implicit cut on the transverse momentum pT of the muons. A more detailed description of the HERA-B detector, trigger and reconstruction chain can be found in Refs. [24,25], and references therein. This analysis is based on
3 The global fit includes our own measurement of theJ/ψ cross section 663±74± 46 nb/nucleon [22]. We prefer to normalize the present measurement to the value given by the global fit since the fit provides a complete summary of all available measurements.
Ring Imaging Cherenkov Counter
250 mrad
220 mrad
Magnet Si-Strip
Vertex Detector
Calorimeter Muon Detector Target
Wires
0 m 5 10 15 20
Proton Beam Electron Beam
Vertex Vessel
Inner / Outer Tracker
Al Beam Pipe
x z
Fig. 1. Plan view of the HERA-B detector.
134·106 events obtained in the 2002–2003 physics run.
4 Data analysis
4.1 Monte Carlo simulation, trigger and reconstruction efficiency
Monte Carlo simulation is performed for J/ψ, Υ and Drell-Yan production.
Heavy quarkonia and Drell-Yan production are simulated with PYTHIA 5.7 [26]. The energy remaining after the quarkonium or Drell-Yan generation is passed to FRITIOF 7.02 [27] to simulate the underlying pA interaction. Fi- nally, additional inelastic pA interactions, generated by FRITIOF, are super- imposed according to the multiple-interaction probabilities of five separate running periods. After tracking the particles through the detector material with GEANT 3.21 [28] and a realistic digitization simulation, the event is reconstructed by the same reconstruction program which is used for the real events. The trigger and the detector parameters are tuned for the individual data taking periods. To have a realistic description of the kinematic distribu- tions for J/ψ and Υ, the PYTHIA generation has been tuned by reweight- ing according to the differential distributions from the high-statistics data of Refs. [10,12,29,30]. The relative trigger and reconstruction efficiencies are de- termined from Monte Carlo simulations. For the muon channel, the ratio of efficiencies isε(J/ψ)/ε(Υ) = 0.76±0.05. The departure from unity is a result of the trigger pT cut which affects muons from J/ψ decay more strongly than muons from Υ decay due to the different mass scale. Because of a harder cut onET at the trigger level, the difference is even larger in the electron channel:
ε(J/ψ)/ε(Υ) = 0.31±0.03.
4.2 Event selection
The event selection includes cuts on the quality of tracks, most notably, that the tracks must have segments in both the VDS and the main tracker and that “clones” (nearby reconstructed tracks originating from the same real physical track) be removed. Further requirements are that either two muon or two electron candidates of opposite charge and with a common vertex are present. Muon candidates are required to penetrate to the muon detector layers behind the absorber material. Electrons are identified by requiring an energy deposit (cluster) in the ECAL. Bremsstrahlung photons emitted by electrons in front of the magnet are recovered for better energy resolution and additional electron identification [25]. The transverse energy ET at ECAL must exceed 0.95 GeV, and the ratio between the energy as measured by the ECAL and the momentum must be close to unity (0.85 < E/p < 1.25 and, in addition, E/p >0.9 when no bremsstrahlung photon is found).
To suppress background from secondaries produced in the beam pipe which reach the muon chambers, we impose cuts on the muon transverse momentum, pT, which are linear functions of the mass with cut ranges:pT ∈ [3,6] GeV/c for the invariant mass m = mΥ, pT ∈ [0.7,4] GeV/c for m = mJ/ψ and cuts on the muon total momentum p: p ∈ [15,190] GeV/c for m = mΥ, p ∈ [4,100] GeV/c for m = mJ/ψ; for intermediate dilepton masses a lin- ear interpolation of the cut limits is used. For electrons which do not suf- fer from a similar background, the cut for the electron total momentum is p ∈ [4,190] GeV/c and for the transverse momentum pT ∈ [0.7,6] GeV/c.
After applying these cuts, the lepton momentum spectra for the mixture of signal and all background sources are similar in the data and Monte Carlo.
4.3 Description of signal and background
4.3.1 Muon channel
The dimuon mass spectrum in the J/ψ mass region (Fig. 2) is fitted with a Gaussian folded with contributions from J/ψ → µ+µ−γ [31] for the signal shape, and an exponential of a second-order polynomial for the background.
For the combined sample of the three target materials (64% C, 33% W, 3% Ti) we obtain a total of 152900±490J/ψdecays and a width of 38.8±0.1 MeV/c2. For the mass regionm >5 GeV/c2(Fig. 3) we use a similar function to describe the Υ peaks to that used for the description of the J/ψ. Due to the lack of
103 104
2.6 2.7 2.8 2.9 3 3.1 3.2 3.3 3.4 3.5
Entriesper10MeV/c
µ+µ−invariant mass, GeV/c
Fig. 2. Fit of the dimuon mass spectrum obtained afterJ/ψ selection cuts.
statistics, the positions of the Υ(2S) and Υ(3S) states are fixed relative to the Υ(1S) state using the PDG mass values [20], and the relative contributions of the three states are fixed according to the E605 results [10]:
N(1S) :N(2S) :N(3S) = (70±3) : (20±2) : (10±1). (4)
The width of the Υ(1S) state is fixed to the width of the J/ψ scaled by the ratio of the expected momentum resolution for muons from Υ andJ/ψdecays resulting in 159 MeV/c2. The widths of the Υ(2S) and Υ(3S) states are scaled proportionally to their masses.
In this mass region, the Drell-Yan process as well as random combinations be- tween leptons contribute to the background. As before, we describe the com- binatorial background by an exponential of a second-order polynomial, whose shape is determined from a fit to the like-sign µ±µ± pair spectrum (Fig. 4), and a normalization factor which is left as a free parameter. The shape of the Drell-Yan spectrum is determined from a fit to the corresponding recon- structed Monte Carlo events.
Thus, the free fit parameters for the spectrum with m > 5 GeV/c2 (Fig. 3) are: the total Υ yield, the Υ(1S) mass, the yield of Drell-Yan dileptons, and the height of the combinatorial background. The total Υ yield in the log likelihood fit isN(Υ) = 30.8±7.4stat. The fit function describes the data well (χ2/ndf = 51/54). Using this value in Eq. (1) we obtainRµµJ/ψ = (7.9±1.9stat)· 10−6, and using the value of the J/ψ cross section Eq. (3), the cross section for Υ production at mid-rapidity as determined from Υ → µ+µ− becomes Br(Υ→µ+µ−)·dσ(Υ)/dy|y=0= 4.0±1.0statpb/nucleon.
Υ Υ´Υ´´
10 -1 1 10 102
5 6 7 8 9 10 11 12
Entriesper100MeV/c
µ+µ− invariant mass, GeV/c
Fig. 3. Fit of the Υ→µ+µ− signal (thick line) with the individual contributions of the Υ(1S), Υ(2S), Υ(3S) states shown in thin solid lines. The background consists of Drell-Yan pairs (dashed line) and combinatorial contribution estimated from the µ±µ± spectrum (dotted line).
10 -1 1 10 102
5 6 7 8 9 10 11 12
Entriesper100MeV/c
µ±µ± invariant mass, GeV/c
Fig. 4. Spectrum of like-sign µ±µ± pairs, together with a fit to an exponential of a second-order polynomial.
The fit (Fig. 3) shows that the combinatorial background dominates below 7 GeV/c2 but becomes negligible at the Υ mass. We have verified that the generated shape of the Drell-Yan background in Monte Carlo simulations agrees with the published data [10,12,32]. Further support for the correctness of the background curves in Fig. 3 comes from studying a number of sensitive kinematic variables (such as the average momentum asymmetry between the
muons). The observed values are compatible with the mixture of signal and background contributions obtained from the fit to the mass spectrum.
The fit also provides a measurement of the Drell-Yan (DY) differential cross sectiond2σ/(dm dy)|y=0 in the region of the Υ mass, or equivalently the ratio RDY [9,10,11] of the Υ production to the Drell-Yan cross sections
RDY = Br(Υ→l+l−)·dσ dy(Υ)
y=0
. d2σ
dm dy(DY)y= 0
m=9.46 .
Similarly to Eq. (1) we determine for the Drell-Yan cross section:
d2σ
dm dy(DY)|m=9.46y= 0 = 2.0 ± 0.5 pb/(nucleon·GeV/c2) and RµµDY = 2.0 ± 0.8 GeV/c2where statistical and systematic uncertainties have been combined.
To compare these results with the published data of the Fermilab fixed-target experiments [10,11,12,32] at √
s = 38.8 GeV, we scale the Drell-Yan pro- duction cross section with the variable τ = m2/s leading to a factor of 1.28± 0.034, and the Υ cross section by a factor 1.32 (obtained from the fit to the Υ data, see Sect. 5). The results, scaled to√
s = 38.8 GeV, then be- come: dm dyd2σ (DY)
√s=38.8 y= 0
m=9.46 = 1.5±0.4 pb/(nucleon·GeV/c2) and RDYµµ|√s=38.8 = 2.0±0.8 GeV/c2, which agrees within the uncertainties with the fits of the data from the Fermilab experiments:RDY between 1.3 and 1.6 GeV/c2 [10,11]
and dm dyd2σ (DY)|m=9.46y= 0 = 1.4±0.3 pb/(nucleon·GeV/c2) [10,12,32].
4.3.2 Electron channel
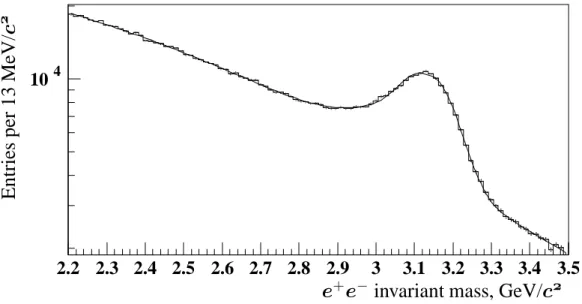
The analysis of dielectron events generally follows the path described for dimuon events. Before fitting, the momentum vectors of the leptons are cor- rected by adding in the energy of bremsstrahlung photons emitted in the material before the magnet and reconstructed in the calorimeter. The fit function takes into account resolution effects as well as a tail due to non- recovered bremsstrahlung and final state radiation [25,31]. The fit yields N(J/ψ) = 109710±930 and a width of 59.9±0.8 MeV/c2 for the combined sample of the three target materials (62% C, 32% W, and 6% Ti).
The log likelihood fit of the mass region m > 5 GeV/c2 (Fig. 6), for which the free parameters are the position of the Υ(1S) peak, the contributions of the Υ signal, of Drell-Yan, and of the combinatorial background, results in 75±14stat Υ events with χ2/ndf = 19/27. This leads to a cross section ratio ReeJ/ψ = (11.0±2.1stat)·10−6, and a mid-rapidity cross section for Υ production of Br(Υ→e+e−)·dσ(Υ)/dy|y=0 = 5.5±1.0stat pb/nucleon.
4 This number agrees well with the theoretical prediction [33] of about 1.275 for the mass region 8< m <11 GeV/c2 .
104
2.2 2.3 2.4 2.5 2.6 2.7 2.8 2.9 3 3.1 3.2 3.3 3.4 3.5
Entriesper13MeV/c
e+e−invariant mass, GeV/c
Fig. 5. Fit of the dielectron mass spectrum obtained after J/ψ selection cuts.
10 -1 1 10 102 103
5 6 7 8 9 10 11 12 13 14
Entriesper200MeV/c
e+e− invariant mass, GeV/c
Fig. 6. Fit of the Υ→e+e− signal (thick line) with the individual contributions of the Υ(1S), Υ(2S), Υ(3S) states shown in thin solid lines. The background consists of Drell-Yan (dashed line) and combinatorial contributions (dotted line).
As for the muon channel, the various energy-dependent kinematic distribu- tions of the electron pairs behave as expected from the relative contributions of the different processes. The imposition of an ET requirement for electrons in the trigger severely suppresses triggers from like-sign leptons, because of the additional pT-bias of the magnet. The resulting like-sign electron mass spec- trum therefore does not describe the combinatorial background and is not used in this analysis. Instead, the combinatorial background is evaluated by mix- ing tracks from different events. For masses greater than about 6 GeV/c2, the
combinatorial background is less than the Drell-Yan contribution and becomes negligible for masses above 9 GeV/c2.
The Drell-Yan contribution at m = 9.46 GeV/c2 is dm dyd2σ (DY)
y= 0 m=9.46 = 3.7± 1.0 pb/(nucleon·GeV/c2) leading to ReeDY = 1.5 ± 0.7 GeV/c2. Scal- ing these results to √
s = 38.8 GeV we obtain dm dyd2σ (DY)y= 0
m=9.46 = 2.9 ± 0.8 pb/(nucleon·GeV/c2), and ReeDY|√s=38.8 = 1.4± 0.6 GeV/c2. The Drell- Yan cross section measurements for the electron and muon cases differ by a factor of 1.9, corresponding to 1.6 standard deviations; the ratio ReeDY agrees with the muon case and with Fermilab measurements.
4.4 Systematic uncertainties
The systematic uncertainties are dominated by the uncertainties in the de- scription of the background which contribute 14% for muons and 17% (in- cluding uncertainties in the bremsstrahlung tail) for electrons, respectively.
The uncertainties of the relative J/ψ and Υ efficiencies are estimated to be 7% for muons and 9% for electrons. The systematic uncertainty of the J/ψ reference cross section Eq. (1) is 9%. The parameter ∆yeff(√
s) = 1.14±0.12syst
(precision of 11%) at √
s = 41.6 GeV is determined from the fits of existing measurements for xF and pT distributions for Υ mesons [10,12].
Other systematic uncertainties are small compared with those already men- tioned. Among them are the use of a Gaussian function with a fixed width for fitting of the Υ peaks (<4%), uncertainties of the fractions of the various Υ states in Eq.(4) (< 0.1%), the polarization effects in J/ψ and Υ produc- tion (< 1.8%), and the branching ratio J/ψ → l+l− (< 1.7%). When, in the electron channel, the particle identification requirements are strengthened by requiring either that one of the two lepton candidates have an associated bremsstrahlung cluster in the calorimeter, or that both have associated clus- ters, the results change by less than 4%. The results are stable within the statistical uncertainty for a wide variation of the cuts for muon or electron identification. All contributions, added in quadrature, result in a systematic uncertainty of 21% in the case of muons, and 25% in the case of electrons.
5 Combined results
Table 2 summarizes all results obtained in the previous sections. One can see that the results in the muon and electron channels are compatible. Combining
Table 2
Summary of the input values and the resulting cross sections for both muon and electron channels.
Parameter µ+µ− channel e+e− channel
N(Υ) 30.8±7.4 75±14
N(J/ψ) 152900±490 109710±930
ε(J/ψ)/ε(Υ) 0.76±0.05 0.31±0.03
σpN(J/ψ) 502±44
(nb/nucleon)
Br(J/ψ →l+l−) (5.90±0.10)%
∆yeff 1.14±0.12syst
RJ/ψ (units of 10−6) 7.9±1.9stat±1.5syst 11.0±2.1stat±2.5syst
Br(Υ→l+l−)·dσ
dy(Υ)|y=0 4.0±1.0stat±0.8syst 5.5±1.0stat±1.4syst
(pb/nucleon) d2σ(DY)
dm dy
2.0±0.5 3.7±1.0
(pb/nucleon·GeV/c2)
RDY 2.0±0.8 1.5±0.7
the muon and electron channels, we have
RJ/ψ = (9.0±2.1)·10−6
and, using the J/ψ reference cross section Eq. (3), we obtain (Fig. 7) Br(Υ→l+l−)· dσ
dy(Υ)
y=0 = 4.5±1.1 pb
nucleon (5)
where the error includes both statistical and systematic contributions. The systematic uncertainties in the muon and electron channel have a common part of 14% compared to the full values of 21% and 25%, respectively, the dominant contributions being due to the uncertainties of ∆yeff and the J/ψ reference cross section Eq. (3). After taking this into account, the χ2 of the combined result is χ2 = 0.6.
If, instead of normalizing to the J/ψ cross section, we use the yield and efficiency ratio between Υ and Drell-Yan production together with the DY cross section at √
s = 38.8 GeV of dy dmd2σ (DY)|y=0 = (1.35 ± 0.27) pb/(nucleon·GeV/c2) [10], scaled by the factor 1.28 ± 0.03 to
[5]
[6]
[6]
[7]
[8]
[9]
[10]
[11]
[12]
[13]
[14]
[15]
[14]
[16]
[15]
HERA-B
10 -2 10 -1 1 10
20 25 30 35 40 45 50 55 60 65
Br·dσ/dy,pb/nucleon
√s, GeV
Fig. 7. This result (HERA-B) compared to the fit (solid curve) of the data of pre- vious experiments [5]–[16] up to √
s = 63 GeV. The NLO theoretical curves (see description in the text), shown as a dashed line, differ by less than the width of the line.
√s = 41.6 GeV, we obtain for the Υ production cross section:
Br(Υ→l+l−)· dσdy(Υ)
y=0 = 2.9±1.1 nucleonpb with a χ2 of 0.3. However, the published data on the DY process are less abundant than those for the J/ψ cross section and are less precise due to limited statistics and difficulties in separating the Υ signal from the DY continuum.
We therefore take the value obtained by normalization to the DY cross section as a confirmation of our main result Eq. (5), which is obtained by normalization to theJ/ψ cross section. Scaling this result by a factor of 1.32 (obtained from the fit described below) to compare it to the published data at√
s= 38.8 GeV, we obtain: Br(Υ → l+l−)· dσdy(Υ)|√y=0s=38.8 = 3.4±0.8 pb/nucleon. Our result lies half-way between the results of E605 [10,11] and E772 [12] and does not favour one of these results over the other. In Fig. 7 we compare the result Eq. (5) with the measurements of previous experiments. In most cases, the uncertainties are large with the exception of four measurements obtained at Fermilab at cms energy√
s = 38.8 GeV, which are also those closest in energy to HERA-B (√
s = 41.6 GeV). However, these values are in poor agreement with each other, as summarized in Table 1.
The fit of all experiments in Fig. 7 (solid line) uses the Craigie parameterization [34] f(√
s) = σ0exp (−m0/√
s), yielding σ0 = 182 ±21 pb/nucleon, m0 = 167±4 GeV,χ2/ndf = 37/14. The dotted line in Fig. 7 shows fits to predictions of next-to-leading order (NLO) calculations from Ref. [35] in the framework of the colour evaporation model (CEM) using the MRST HO parton distribution
functions [36]. The thickness of the line corresponds to the variations of results in the three sets of input parameters of the model which describe the open beauty production data [35]: mb = µ = 4.75 GeV/c2; mb = 4.5 GeV/c2, µ= 2mb; andmb = 5 GeV/c2, µ=mb/2, wheremb is the b-quark mass andµ is the renormalization scale (assumed to be equal to the factorization scale).
The NLO predictions are normalized according to a fit of the experimental data using the mentioned values of the parameters mb and µ [35].
6 Conclusion
The Υ production yield at mid-rapidity inpA collisions at a proton momentum p = 920 GeV/c has been measured in both channels Υ → µ+µ− and Υ → e+e−. The J/ψcross section (3) has been used for normalization, and the ratio of Υ andJ/ψ cross sections Eq. (2) is determined to be
RJ/ψ = (9.0±2.1)·10−6.
The resulting Υ production cross section (both lepton channels combined) is Br(Υ→l+l−)· dσ
dy(Υ)
y=0 = 4.5±1.1 pb nucleon . Our result, scaled for √
s dependence, lies half-way between those of E605 [10,11] and E772 [12]. Normalization with respect to the Drell-Yan process confirms this result. The result agrees within 1.4 standard deviations with current CEM NLO predictions [35] (see Fig. 7).
Acknowledgments:
We express our gratitude to the DESY laboratory and to the DESY accel- erator group for their strong support since the conception of the HERA-B experiment. The HERA-B experiment would not have been possible without the enormous effort and commitment of our technical and administrative staff.
It is a pleasure to thank all of them. We would like to thank R. Vogt for many stimulating discussions and suggestions.
References
[1] R. Vogt, Phys. Rept. 310 (1999) 197.
[2] N. Brambilla et al., CERN Yellow Report CERN-2005-005, hep-ph/0412158.
[3] J.F. Gunion and R. Vogt, Nucl. Phys. B492 (1997) 301.
[4] F. Karsch, M.T. Mehr and H. Satz, Z. Phys. C37 (1988) 617.
[5] NA3 collab., J. Badier et al., Phys. Lett. B86 (1979) 98.
[6] J.K. Yoh et al., Phys. Rev. Lett. 41 (1978) 684; Erratum ibid. 41 (1978) 1083.
[7] W.R. Innes et al., Phys. Rev. Lett. 39 (1977) 1240; Erratum ibid. 39 (1977) 1640.
[8] K. Ueno et al., Phys. Rev. Lett. 42 (1979) 486.
[9] S. Childress et al., Phys. Rev. Lett. 55 (1985) 1962.
[10] E605 collab., G. Moreno et al., Phys. Rev. D43 (1991) 2815.
[11] E605 collab., T. Yoshida et al., Phys. Rev. D39 (1989) 3516.
[12] E772 collab., P.L. McGaughey et al., Phys. Rev. D50 (1994) 3038; Erratum ibid. D60 (1999) 119903.
[13] E771 collab., T. Alexopoulos et al., Phys. Lett. B374 (1996) 271.
[14] R-108 (CCOR collab.), L. Camilleri, in: T.B.W. Kirk, H.D.I. Abarbanel (Eds.), Proc. 1979 Int. Symp. on Lepton and Photon Interactions at High Energies, Fermilab (1979), p.282.
[15] C. Kourkoumelis et al., Phys. Lett. B91 (1980) 481.
[16] CCOR collab., A.L.S. Angelis et al., Phys. Lett. B87 (1979) 398.
[17] UA1 collab., C. Albajar et al., Phys. Lett. B186 (1987) 237.
[18] CDF collab., F. Abe et al., Phys. Rev. Lett. 75 (1995) 4358.
[19] E866/NuSea collab., M.J. Leitch et al., Phys. Rev. Lett. 84 (2000) 3256.
[20] S. Eidelman et al., Phys. Lett. B592 (2004) 1.
[21] F. Maltoni et al., hep-ph/0601203 (2003), submitted to Phys. Lett. B.
[22] HERA-B collab., I. Abt et al., Preprint DESY 05-232, Hamburg (2005), hep-ex/0512029, submitted to Phys. Lett. B.
[23] E772 collab., D.M. Alde et al., Phys. Rev. Lett. 64 (1990) 2479.
[24] HERA-B collab., E. Hartouni et al., HERA-B Design Report, DESY-PRC 95-01 (1995); HERA-B collab., HERA-B Status Report, DESY-PRC 00-04 (2000).
[25] HERA-B collab., I. Abt et al., Preprint DESY 05-233, Hamburg (2005), hep-ex/0512030, Phys. Rev. D (in press).
[26] T. Sj¨ostrand, Comp. Phys. Comm. 82 (1994) 74.
[27] H. Pi, Comp. Phys. Comm. 71 (1992) 173.
[28] R. Brun et al., GEANT3, CERN-DD-EE-84-1 (1987).


![Fig. 7. This result (HERA-B) compared to the fit (solid curve) of the data of pre- pre-vious experiments [5]–[16] up to √](https://thumb-eu.123doks.com/thumbv2/1library_info/4004533.1540759/15.918.147.724.110.412/fig-result-hera-compared-solid-curve-vious-experiments.webp)
