ATLAS-CONF-2014-020 20May2014
ATLAS NOTE
ATLAS-CONF-2014-020
May 17, 2014
Z Boson Production in p + Pb Collisions at √
s
NN= 5.02 TeV with the ATLAS Detector at the LHC
ATLAS Collaboration
Abstract
The ATLAS experiment has measured the production of
Zbosons in
p+Pb collisionsat
√sNN=
5.02 TeV from the 2013 LHC run. The
Zbosons are reconstructed via the di- electron and di-muon decay channels. Results from the two channels are consistent and combined to obtain a total cross-section of 144.1
±4.9 (stat.)
±8.3 (syst.)
±4.9 (lumi.) nb within the fiducial acceptance region. The rapidity and momentum differential cross- sections are also presented. A significant excess in the direction of the Pb beam is observed in the rapidity distribution relative to a pQCD calculation which does not include nuclear modifications to the parton distribution functions. In addition the centrality dependence of the
Zboson production is measured and considered within the frameworks of a standard Glauber model as well as extensions of the model which allow for fluctuations in the in- clusive nucleon-nucleon cross-section. The centrality dependence of the
Zboson yield per event is compared to the yield of inclusive charged particle production, and found to be similar.
c
Copyright 2014 CERN for the benefit of the ATLAS Collaboration.
Reproduction of this article or parts of it is allowed as specified in the CC-BY-3.0 license.
1 Introduction
The study of electroweak bosons in heavy ion (HI) collisions at the Large Hadron Collider (LHC) at CERN has demonstrated that the production of non-strongly interacting particles scales with the number of nucleon-nucleon collisions, (N
coll). This has been observed for photons [1, 2],
Wbosons [3, 4], and
Zbosons [5, 6]. The momentum and rapidity distributions of
Zbosons, measured using the di-electron and di-muon decay channels, are consistent with Pythia simulations of
ppcollisions scaled to the NNLO cross section and multiplied by the average nuclear thickness function,
hTAAi(which is proportional to hNcolli) [6]. Zboson production in Pb
+Pb collisions was found to be consistent with a simple model in which nuclear modifications are neglected in the treatment of parton distribution functions (PDF).
To differentiate between initial and final state effects in HI collisions, the study of
p+Pb collisionsis utilized at the LHC. This follows from the assumption that the hot and dense QCD medium cannot be formed in such collisions and all measured e
ffects on the particles should originate from the initial state of the nucleus. This assumption was challenged by the very first results from
√ p+Pb collisions at sNN=5.02 TeV produced by the LHC in 2012. Results on the multi-particle correlations, published by three LHC experiments [7–12], revealed collective behaviour in
p+Pb collisions similar to that pre- viously measured in HI collision systems. Recent results from the high statistics
p+Pb LHC run in 2013obtained by the ATLAS and CMS experiments suggest that the yields of charged particles [13, 14] and fully reconstructed jets [15, 16] do not simply scale as the number of
hNcolliand display a strong rapidity dependence.
The measurement of
Zboson production in
p+Pb collisions is a way to compare the initial state e
ffects between the
p+Pb and Pb
+Pb collisions systems at the LHC. The yields of
Zbosons measured as function of their transverse momentum (p
ZT) and rapidity (y
Z) are sensitive to initial state nuclear e
ffects. This note presents the results of the measurement of the
Zboson production in
p+Pb collisions at
√sNN=
5.02 TeV using the ATLAS detector. The
Zbosons are reconstructed using the
Z→µ
+µ
−decay channel in the rapidity range
−2.5 < y
Z< 2.5 in the laboratory coordinate frame
1. In the
Z →e+e−decay channel the
Zboson is reconstructed in the rapidity range
−3.5< y
Z< 4.0. Results measured in the di- muon and di-electron decay channels are combined accounting for uncertainty correlations, and the
Zboson production rates are presented as a function of event centrality,
pZTand y
Z. The measured cross- sections are compared to NNLO pQCD calculations, and the centrality dependence of the
Zboson yield per event is compared to the centrality dependence of the total charged multiplicity.
2 ATLAS detector
The ATLAS detector [17] covers nearly the entire solid angle around the collision point. It consists of an inner tracking detector system surrounded by a thin superconducting solenoid, electromagnetic and hadronic calorimeters, and a muon spectrometer incorporating three superconducting toroid magnet systems.
The inner-detector system (ID) is immersed in a 2 T axial magnetic field and provides charged par- ticle tracking in the range
|η|< 2.5. The high-granularity silicon pixel detector covers the vertex region and is surrounded by the silicon microstrip tracker and the transition radiation tracker.
The calorimeters cover the range
|η|< 4.9. Within the region
|η|< 3.2, electromagnetic calorimetry is provided by barrel and end-cap high-granularity lead liquid-argon calorimeters, with an additional
1ATLAS uses a right-handed coordinate system with its origin at the nominal interaction point (IP) in the centre of the detector and thez-axis along the beam pipe. Thex-axis points from the IP to the centre of the LHC ring, and theyaxis points upward. Cylindrical coordinates (r, φ) are used in the transverse plane,φbeing the azimuthal angle around the beam pipe.
The rapidity is given byy= 12lnEE−p+pz
z and pseudorapidity is defined asη=−ln(tan(θ/2)). Positive rapidity corresponds to the
thin liquid-argon presampler covering
|η|< 1.8. The electromagnetic calorimeter is complemented by a hadronic calorimeter. Forward calorimeters (FCal) are located in the range 3.1 <
|η|< 4.9.
The muon spectrometer (MS) comprises separate trigger and high-precision tracking chambers that measure the deflection of muons in the magnetic field. The precision chambers cover the region
|η|< 2.7 with three layers of monitored drift tubes (MDT), complemented by cathode strip chambers (CSC) in the innermost layer of the forward region. The muon trigger system covers the range
|η|< 2.4 with resistive plate chambers in the barrel, and thin gap chambers in the end-cap regions.
3 Analysis
3.1 Event Selection
This analysis uses the 2013 LHC
p+Pb collision data at √sNN=
5.02 TeV. Midway through the
p+Pbrunning the directions of the proton and lead beams were reversed. The results obtained in the two data periods were found to be consistent with each other. In this note all data from both periods are presented with the convention that the proton beam travels
forwardin the positive rapidity direction. In this convention the asymmetric beams resulted in a centre of mass shifted to rapidity y
C M=0.465 in the laboratory frame. The data sample for this study was collected using a three-level trigger system [18], which selected events with electron or muon candidates. Following stringent data quality requirements, the
Z→e+e−and
Z →µ
+µ
−analyses draw on samples corresponding to integrated luminosity values of 29.1
±1.0 nb
−1and 27.8
±0.9 nb
−1, respectively.
The luminosity measurement for the 2013
p+Pb data is calibrated based on dedicated beam-separationscans, also known as van der Meer scans. Similar systematic uncertainties as those studied in Ref. [19]
were considered. The combination of these systematic uncertainties results in a total preliminary uncer- tainty on the ATLAS luminosity scale during proton-lead collisions at
√sNN=
5.02 TeV of 3.4%.
In order to characterize the
p+Pb collision geometry each event is assigned a centrality classificationbased on the total transverse energy measured in the FCal on the Pb-going side (−4.9 < η <
−3.2),ΣEPbT[20]. A standard Glauber model [21] approach is used to calculate the mean number of participating nucleons in the collision,
hNparti(in the
p+Pb system we take the mean number of inelastic nucleon-nucleon collisions,
hNcolli, to behNparti-1). In addition, a Glauber-Gribov model [22, 23], an extension to the Glauber model which allows event-by-event fluctuations of the nucleon-nucleon cross-section, σ(N
+N→X), is also implemented. In this model the magnitude of the fluctuations is characterized bythe parameter
Ω. Following Ref. [20] two values of
Ω, 0.55 and 1.01 based on the calculations in Ref.
[22, 23], are implemented and considered for this analysis.
To maintain the integrity of the centrality classification and the related calculation of
hNparti, in thecentrality binned part of this analysis only events within 0-90% centrality are studied. Pile-up events containing multiple
p+Pb interactions from the same bunch-crossing, are removed when more than onevertex is reconstructed. In addition, diffractive events are identified by a rapidity gap (defined by the absence of calorimeter energy clusters) of greater than two units on the Pb-going side of the detector, and removed. The fraction of
p+Pb collision candidate events removed due to pile-up and diffractiverejection is approximately 10%. The total number of sampled events in a given centrality bin,
Nevents, is used to define the
Zboson yield per event in centrality di
fferential measurements. The total number of events in 0-90% centrality following the selection criteria is 5.1
·10
10for the
Z →e+e−analysis and 4.9·10
10for the
Z →µ
+µ
−analysis.
The presence of a
Zboson may a
ffect
ΣETPband thereby bias the centrality classification as a measure
of collision geometry. The centrality of
Z→e+e−events in which there is a forward electron in the Pb-
going side FCal, is biased by the energy of the electron, and this is corrected by subtracting the transverse
energy of the electron from
ΣEPbT. The e
ffectiveness of the subtraction procedure is checked by examining
ΣEPbT
in data events before and after the overlay with simulated
Z→e+e−events containing a forward electron.
In addition to the case where there is a daughter electron in the calorimeter,
ΣETPbis more subtly biased in all
Zboson events. The presence of a
Zboson (or indeed, any hard process) is correlated with a larger transverse energy of the underlying event and consequently more energy in the forward calorimeter that is
notrepresentative of the
p+Pb collision geometry. This is studied by comparingthe transverse energy deposited in the FCal between events selected by a minimum bias trigger and
Z →`
+`
−(`
= e, µ) events fromppcollisions (in which there is no centrality to consider). This e
ffect is studied in
ppcollisions at
√s =
2.76 TeV and
√s =
7 TeV. At both energies a significant shift in the mean transverse energy deposited in the FCal is observed, and a single value is interpolated for
√sNN=
5.02 TeV. The interpolation is performed using both logarithmic and linear expressions, and the difference between them contributes to the systematic uncertainty. Because of the shifted centre of mass in the
p+Pb system the FCal has a different effective acceptance inη compared to
pp, and aftercorrecting for this a mean bias value of 2.0
±0.5 GeV is obtained. Although the correlation between aZboson and the underlying event may not be trivial, this value is taken to be a constant increase in
ΣEPbTfor
Zboson events compared to events selected by a minimum bias trigger. In each
Z →`
+`
−event this value is subtracted from
ΣEPbTand the resulting value used to determine the centrality of the event.
3.2 Lepton Reconstruction
Electron candidates are first identified at the level one trigger (L1) as a cluster of cells in the electro- magnetic calorimeter, formed into (∆ φ
×∆η)
=0.1
×0.1 trigger towers, within the range
|η|< 2.5 with the cluster transverse energy exceeding 5 GeV. The high-level trigger (HLT) then incorporated tracking information from the ID and imposed electron identification requirements on the putative electrons. Two triggers were chosen:
ET> 9 GeV with more stringent electron identification requirements at the HLT, and
ET> 15 GeVwith looser identification requirements. Both of these HLT triggers were un-prescaled and were used in an OR combination to maximize the data statistics.
In the offline analysis, electron candidates within
|η|< 2.47 are formed using the standard ATLAS re- construction algorithm [24], requiring the matching of a track to an energy cluster in the electromagnetic calorimeter. Following the reconstruction requirements, further electron identification cuts are made to reject background. The standard electron identification cuts [24] are used to assign a reconstruction qual- ity assessment to each electron. The triggering electron is required to have
ET> 20 GeV, to be outside the rapidity interval 1.37 <
|η|< 1.52, and must satisfy tight reconstruction quality requirements. The other electron must have
ET> 10 GeV may be anywhere in
|η|< 2.47, and must satisfy looser qual- ity requirements. Additionally, electrons were reconstructed between 2.5 <
|η|< 4.9 based on energy deposited in the forward calorimeters [24]. These electrons are required to have
ET> 20 GeV.
Muon candidates are first identified at the L1 trigger based on signals from the fast-response resistive plate chambers in the region
|η|< 1.05 and the thin gap chambers in the region 1.05 <
|η|< 2.4. The L1 detector position information is then used by the HLT to reconstruct muon tracks in the region of interest around the muon found by the L1 trigger. In the HLT, the track parameters of each muon were recalculated by including the precision data from the MDT or CSC. Muons with
pTgreater than 8 GeV were accepted by the HLT without prescaling.
For the
Z →µ
+µ
−analysis, muons are formed from candidates reconstructed in both the MS and ID with consistent angular measurements [25]. Muons are reconstructed separately in the MS and ID and a χ
2minimization procedure is used to obtain combined muon kinematic information. The triggering muon is required to have
pT> 20 GeV and be within
|η|< 2.4. The second muon may be within
|η|
< 2.47 and have
pT> 10 GeV.
3.3 Monte Carlo Corrections
The trigger, reconstruction, and identification e
fficiencies of both electrons and muons are evaluated by a Monte Carlo simulation (MC) complemented by data-driven estimates of the same quantities. Using the P
owheggenerator [26] (utilizing the CT10 PDF [27]) with showering from P
ythia8 [28], 10 million
Z →e+e−and 4 million
Z →µ
+µ
−events were simulated. The
Zbosons were generated from both
ppand
pncollisions, and are added together with weights 82/208 and 126/208, respectively, correspond- ing to the numbers of protons and neutrons in the Pb ion. The response of the ATLAS detector to the generated particles is modeled using GEANT4 [29, 30] . Due to the sensitivity of electron reconstruc- tion, especially in the more forward region, to detector occupancy the simulated
Z→e+e−events were overlaid with data events selected with a minimum bias trigger, and then reconstructed.
To cross-check the e
fficiencies calculated in the MC, a ‘tag-and-probe’ technique is employed. In this technique, a ‘tag’ is defined as a fully reconstructed high quality lepton, whereas the ‘probe’ is a lepton candidate unbiased by triggering, reconstruction, or quality requirements. Using tag-and-probe pairs with invariant mass consistent with a selection of
Zbosons, the e
fficiency of the probe is calculated. The tightness of the mass window used depends on the background present in the probe sample, and ranges from 80 <
m``< 100 GeV to 87 <
m``< 95 GeV. For example, the electron trigger efficiency is measured from high quality reconstructed electron probes selected without an
a prioritrigger requirement, and the MS reconstruction e
fficiency is measured from charged particle tracks in the ID without an
a prioriMS signal requirement. Where there is a discrepancy between an efficiency calculated from the MC and the tag-and-probe calculation the MC is scaled to match the data driven result.
The trigger e
fficiencies of electrons and muons vary with η, and have average values of approximately 95% and 83%, respectively. The reconstruction and identification efficiency of the more stringently selected electrons is approximately 75%, whereas the looser quality electron reconstruction e
fficiency is approximately 88% and the forward electron e
fficiency is about 65%. These values vary with η and
pT. The muon reconstruction efficiency is approximately 95%, varying with η.
From the MC, a correction factor of the yields of
Z →e+e−and
Z→µ
+µ
−candidates is calculated as a function of
pZT, y
Z, and
p+Pb centrality. This correction takes into account the cumulative losses due to trigger, reconstruction, and identification efficiency as well as the kinematic acceptance limits of the daughter leptons. The correction is defined relative to all generated
Zbosons within the mass window 66 <
m``< 116 GeV. Following the subtraction of background and application of the correction factor, a corrected yield of
Zbosons is obtained in each bin of
pZTand y
Z. The uncertainty on the correction factor stems from the uncertainty of the data driven tag-and-probe checks of the MC, chiefly due to the relatively low statistics available in the data and the presence of background in the probe samples.
The uncertainty associated with the lepton identification efficiency is the dominant uncertainty for both the
Z→e+e−and
Z→µ
+µ
−analyses. This uncertainty is approximately 10% for
Z→e+e−(rising as high as 20% for pairs including a forward electron), and 4% for
Z →µ
+µ
−. The other sub-dominant uncertainties are each less than 2%.
3.4 Yield Extraction
To form
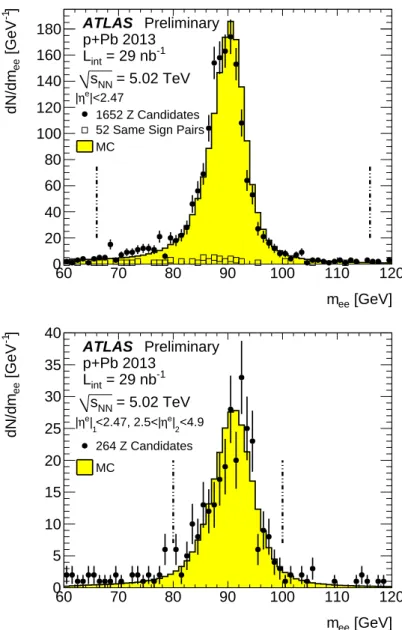
Z →e+e−candidates, all electrons found in triggered events are paired with each other. When both electrons are at mid-rapidity (|η| < 2.47), the opposite-sign charged pairs with an invariant mass satisfying 66 <
mee< 116 GeV are accepted as signal
Zboson candidates. The same-sign pairs in this window are taken as an estimate of the combinatorial background. In total, 1652 opposite-sign pairs and 52 same-sign pairs are reconstructed. Pairs made with one mid-rapidity electron and one forward electron with an invariant mass between 80 <
mee< 100 GeV were also selected as
Zboson candidates.
There were 264 such candidates, of which an estimated 5% are background based on a fit of the invariant
mass distribution. The fit is performed using a signal shape from the MC, and several background
parameterizations. The mass distributions of
Z→e+e−candidates are shown in Figure 1, along with the reconstructed MC simulation of the same quantity.
Z→
µ
+µ
−candidates are similarly formed by selecting pairs with invariant mass 66 <
mµµ< 116 GeV.
This selection yields 2095 opposite-sign charged candidates and 37 same-sign pairs, the mass distribu- tion of which is shown in Figure 2. The MC describes the data well in both lepton channels. The slight shift of the mass centroid visible between data and MC is incorporated into the systematic uncertainty.
The uncertainty from background is approximately 1% in the
Z→e+e−and
Z →µ
+µ
−channels, with the exception of the most forward
Z →e+e−pairs (y
Z> 3.5) where it is as high as 20%.
4 Results
The cross-section is defined for the mass window 66 <
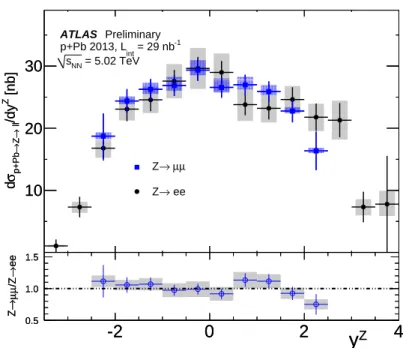
mZ< 116 GeV, and the full decay lepton kinematic phase-space The phase-space corrections are based on the MC as described in section 3.3 above. Table 1 lists the integrated cross-section measurements from the different lepton channels, which are in good agreement. The two di-lepton channels also agree well in their rapidity di
fferential cross- sections as shown in Figure 3.
Given the agreement between the two channels, the measurements are combined using the method described in Ref. [31, 32], which takes into account bin-wise and inter-data set correlations of uncertain- ties. The technique uses a χ
2minimization procedure with a nuisance parameter formalism to combine the data sets. After combination, a
Z→`
+`
−cross-section of 144.1
±4.9 (stat.)
±8.3 (syst.)
±4.9 (lumi.) nb for
−3.5< y
Z< 4.0 and 122.7
±2.4 (stat.)
±5.3 (syst.)
±4.2 (lumi.) nb for
|yZ|< 2.5 is ob- tained. The combined result is slightly higher than either individual channel due to requiring consistent behavior of the best truth value within the correlated uncertainties of the measurements.
This cross-section may be compared to a baseline model based on NNLO pQCD calculations con- structed as σ(
p+Pb→Z→`
+`
−)
=82
×σ(pp
→Z→`
+`
−)
+126
×σ(
pn→Z→`
+`
−). Forming the sum in this way assumes that the
p+Pb cross-section is the incoherent sum of the cross-sections for theproton on the individual nucleons in the Pb nucleus, and neglects possible nuclear binding and motion e
ffects. The nucleon-nucleon cross-sections, σ(
pp→Z →`
+`
−) and σ(pn
→Z →`
+`
−), are obtained by following the calculations in Ref. [33] using the MSTW2008 PDF [34]. Their weighted sum results in a baseline
p+Pb cross-section of 137.0 nb in all space. To consider this baseline cross-section dif-ferentially the high statistics MC generated using the CT10 PDF, described above, is taken at generator level and scaled to the NNLO total cross-section. This model gives cross-sections of 136.8 nb within
−3.5
< y
Z< 4.0 and 114.4 nb for
|yZ|< 2.5.
|yZ|
< 2.5
−3.5< y
Z< 4.0
Z →
µ
+µ
−122.1
±3.4
±6.2
±4.2 N/A
Z→e+e−122
±3
±13
±4 144
±5
±17
±5
Z→`
+`
−122.7
±2.4
±5.3
±4.2 144.1
±4.9
±8.3
±4.9
Model 114.4 136.8
Table 1: The measured and model integrated cross-section in the smaller and larger fiducial volume, for
Z →µ
+µ
−,
Z →e+e−, and the combined
Z →`
+`
−. All values are in units of nb. The first uncertainty listed is statistical, the second systematic from the
Z →`
+`
−analysis, and the third from the luminosity measurement.
The combined rapidity differential cross-section is shown in Figure 4 alongside the baseline model
in which
Zboson production is modeled through the incoherent superposition of many nucleon-nucleon
collisions. Unlike the baseline model, the data are not symmetric about the centre of mass, but display a relative excess at backward rapidity in the Pb-going beam direction.
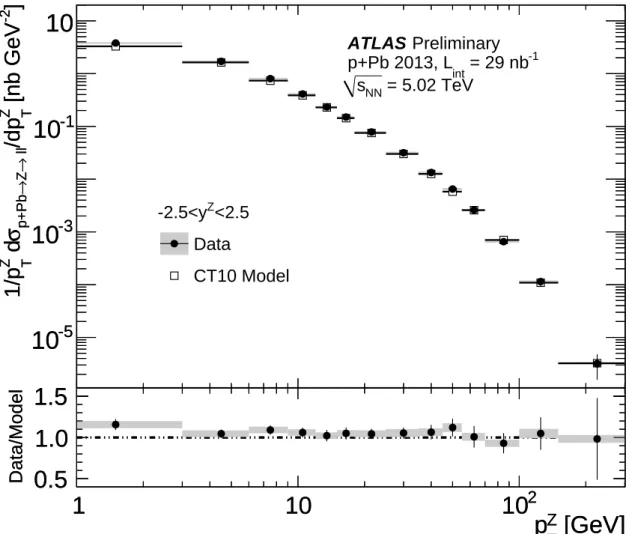
Figure 5 shows the
pZTdifferential cross-section, within
|yZ|< 2.5, similarly compared to the baseline model. The figure shows good shape agreement between the data and baseline. The
pZTdistribution is investigated further in bins of y
Zas shown in Figures 6. The y
Zbins are chosen such that they correspond to
−2 <y
Z*<
−1,
−1 <y
Z*< 0, 0 <y
Z*< 1, 1 <y
Z*< 2 where y
Z* is the rapidity relative to the centre of mass of the asymmetric collision system,
i.e.y
Z*
=y
Z-0.465. No significant variation of the
pZTdistribution is observed in the di
fferent y
Z* bins.
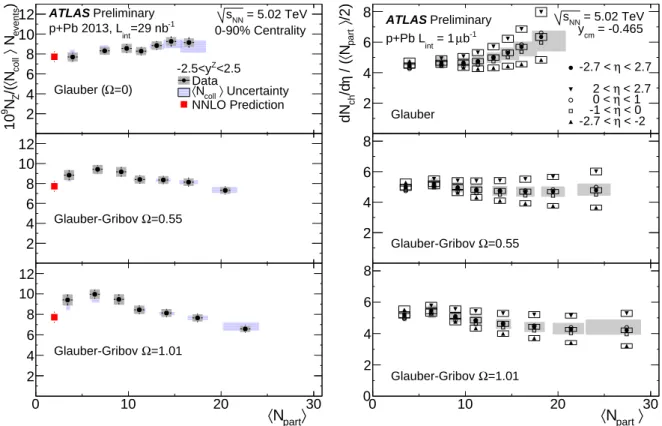
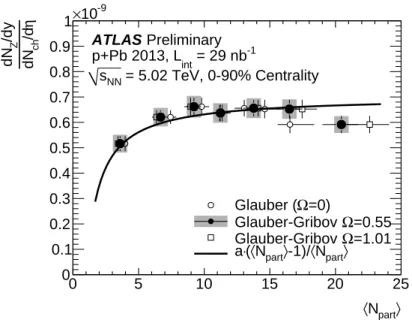
Results are also presented for the centrality differential
Zboson yields. If the rate of
Zboson pro- duction were consistent with geometric expectations, then the
Zboson yield divided by
hNcollishould be constant across centrality classes. To investigate this the yield of
Zbosons per sampled event scaled by
hNcolli, within
|yZ|< 2.5, is plotted as a function of
hNpartiin Figure 7. The yield per event divided by
hNcolligrows slightly with increasing centrality as defined in the standard Glauber model. Allowing Gribov fluctuations reduces the
hNcollidivided yield per event in more central events and increases it in more peripheral events. Charged particle production as a function of
hNpartiin
p+Pb collisions [20]
displays a similar trend as observed in the
Zboson yield and is plotted alongside the
Zboson yield in Figure 7. To quantify the similarity between the
Zboson, within y
Z< 2.5, and inclusive charged particle yields, the ratio
dNdNZ/dych/dη
is plotted vs
hNpartiin Figure 8. The charged particle yield is expected to scale with
hNpartiand the
Zboson yield with
hNcolli=hNparti-1, and so the ratio is fit to a function of the forma·(hN
parti-1)/hNpartiwhich describes the data well. The agreement in the geometric scaling trends betweenthese two very di
fferent observables, suggests that both are reflecting the consequences of the initial state conditions of the nucleus.
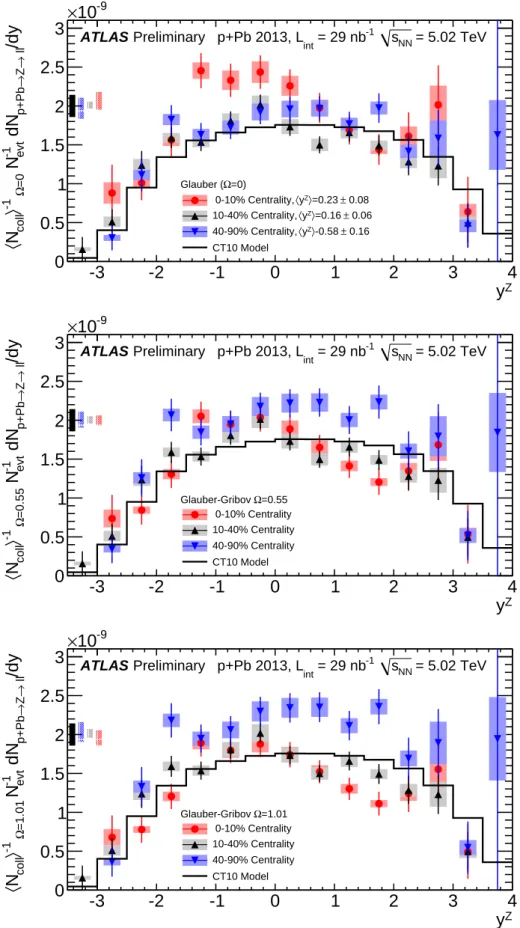
To further understand the rapidity shape seen in Figure 4, the yields of
Zboson per event as a function of the
Zrapidity are plotted separately for di
fferent centrality categories in Figure 9. Each distribution is scaled by the appropriate
hNcolliand the figure is made for the three different Glauber implementations shown individually in each panel. The rapidity asymmetry is found to be strongly present in central collisions, and much less so in peripheral collisions. In the standard Glauber model the asymmetry appears as a relative excess at backward (Pb-going side) rapidity in central collisions compared to peripheral collisions, whereas in the Glauber-Gribov implementations it manifests as a suppression of the forward (p-going side)
Zboson production.
5 Conclusion
ATLAS has measured the total integrated and di
fferential cross-sections of
Zboson production in 29.1
±
1.0 nb
−1of
p+Pb collisions at √sNN =
5.02 TeV using both the di-electron and di-muon channels.
The total measured cross-section is compared to a baseline pQCD model in which nuclear binding and motion e
ffects are neglected. The transverse momentum di
fferential cross-section shows no shape mod- ification relative to the simple model, however the rapidity differential cross-section shows a significant asymmetry compared to the simple model. A relative excess in the
Zboson differential cross-section is seen in the backward (Pb-going) part of the rapidity distribution. This asymmetry is more pronounced in central events and is apparently absent in peripheral events which are roughly symmetric about the centre of mass. Whether the relative asymmetry in central events compared to peripheral events is interpreted as an excess at backward rapidity or a deficit at forward rapidity depends on the choice of Glauber model centrality implementation. This centrality ordering is similar to that observed by ATLAS in high-p
Tforward jets in
p+Pb.[GeV]
mee
60 70 80 90 100 110 120
]-1 [GeVeedN/dm
0 20 40 60 80 100 120 140 160 180
|<2.47 ηe
|
1652 Z Candidates 52 Same Sign Pairs MC
ATLAS Preliminary p+Pb 2013
= 29 nb-1
Lint
= 5.02 TeV sNN
[GeV]
mee
60 70 80 90 100 110 120
]-1 [GeVeedN/dm
0 5 10 15 20 25 30 35 40
<4.9
|2
ηe
<2.47, 2.5<|
|1
ηe
|
264 Z Candidates MC
ATLAS Preliminary p+Pb 2013
= 29 nb-1
Lint
= 5.02 TeV sNN
Figure 1: The di-electron invariant mass distributions in data and MC. The top plot is for
Zboson
candidates with both electrons at mid-rapidity (|η| < 2.47), and the bottom plot is for those candidates in
which the non-triggering electron is a forward electron (2.5 <
|η|< 4.9). The mid-rapidity plot is overlaid
with the mass distribution of same charge sign pairs. The vertical lines indicate the mass window from
which candidates are accepted, and the MC is normalized to the data within this signal region.
[GeV]
µ
mµ
60 70 80 90 100 110 120
]-1 [GeVµµdN/dm
0 50 100 150 200 250 300
2095 Z Candidates 37 Same Sign Pairs MC
ATLAS Preliminary p+Pb 2013
= 28 nb-1
Lint
= 5.02 TeV sNN
Figure 2: The di-muon invariant mass distributions in data and MC. The vertical lines indicate the mass window from which candidates are accepted, and the MC is normalized to the data within this signal region.
-2 0 2 4
[nb]Z /dy ll→Z→p+Pbσd 10 20 30
µ µ
→ Z
→ ee Z ATLAS Preliminary
= 29 nb-1
p+Pb 2013, Lint
= 5.02 TeV sNN
-2 0 2 4
[nb]Z /dy ll→Z→p+Pbσd 10 20 30
y
Z-2 0 2 4
ee→/Zµµ→Z
0.5 1.0 1.5
y
Z-2 0 2 4
ee→/Zµµ→Z
0.5 1.0 1.5
Figure 3: The
dσ/dydistributions from
Z→e+e−and
Z →µ
+µ
−are shown overlaid in the upper panel.
The lower panel is their ratio. The bars indicate statistical uncertainty and the shaded boxes systematic
uncertainty.
-2 0 2 4
[nb]
Z/dy
ll→Z→p+Pbσ d 10
20 30
Data
CT10 Model ATLAS Preliminary
= 29 nb
-1p+Pb 2013, L
int= 5.02 TeV s
NN-2 0 2 4
[nb]
Z/dy
ll→Z→p+Pbσ d 10
20 30
y Z
-2 0 2 4
Data/Model
1
2
y Z
-2 0 2 4
Data/Model
1
2
Figure 4: The
dσ/dydistributions for
Z →`
+`
−in the data compared with CT10 (scaled to have the
total cross-section predicted by MSTW2008 at NNLO). The lower panel is their ratio. The bars indi-
cate statistical uncertainty and the shaded boxes systematic uncertainty. The systematic uncertainties
are correlated bin-by-bin. There is an overall scale uncertainty of 3.4% stemming from the luminosity
measurement that is not shown.
1 10 10
2]
-2[nb GeV
TZ
/dp
ll→Z→p+Pbσ d
Z T1/p
10
-510
-310
-110
<2.5 -2.5<y
ZData
CT10 Model
ATLAS Preliminary = 29 nb
-1p+Pb 2013, L
int= 5.02 TeV s
NN1 10 10
2]
-2[nb GeV
TZ
/dp
ll→Z→p+Pbσ d
Z T1/p
10
-510
-310
-110
[GeV]
Z
p
T1 10 10
2Data/Model 0.5
1.0 1.5
[GeV]
Z
p
T1 10 10
2Data/Model 0.5
1.0 1.5
Figure 5: The
dσ/d pTdistributions for
Z →`
+`
−, within
|yZ|< 2.5, in the data compared with the model (CT10 PDF,scaled to have the
totalcross-section predicted by MSTW2008 at NNLO) baseline.
The lower panel is data
/model ratio. The bars indicate statistical uncertainty and the shaded boxes sys-
tematic uncertainty. The systematic uncertainties are correlated bin-by-bin. There is an overall scale
uncertainty of 3.4% stemming from the luminosity measurement that is not shown. Note that the left-
most bin represents the range 0-3 GeV, but due to the log scale x-axis its left edge is truncated at 1
GeV.
1 10 102 ]-2 [nb GeV T
Z/dp ll→Z→p+Pbσ dZ T1/p
10-5
10-3
10-1
10
*<-1.0 -2.0<yZ
Data CT10 Model
ATLAS Preliminary = 29 nb-1
p+Pb 2013, Lint
= 5.02 TeV sNN
1 10 102
]-2 [nb GeV T
Z/dp ll→Z→p+Pbσ dZ T1/p
10-5
10-3
10-1
10
[GeV]
Z
pT
1 10 102
Data/Model 0.5
1.0 1.5
[GeV]
Z
pT
1 10 102
Data/Model 0.5
1.0
1.5 1 10 102
]-2 [nb GeV T
Z/dp ll→Z→p+Pbσ dZ T1/p
10-5
10-3
10-1
10
*<0.0 -1.0<yZ
Data CT10 Model
ATLAS Preliminary = 29 nb-1
p+Pb 2013, Lint
= 5.02 TeV sNN
1 10 102
]-2 [nb GeV T
Z/dp ll→Z→p+Pbσ dZ T1/p
10-5
10-3
10-1
10
[GeV]
Z
pT
1 10 102
Data/Model 0.5
1.0 1.5
[GeV]
Z
pT
1 10 102
Data/Model 0.5
1.0 1.5
1 10 102
]-2 [nb GeV T
Z/dp ll→Z→p+Pbσ dZ T1/p
10-5
10-3
10-1
10
*<1.0 0.0<yZ
Data CT10 Model
ATLAS Preliminary = 29 nb-1
p+Pb 2013, Lint
= 5.02 TeV sNN
1 10 102
]-2 [nb GeV T
Z/dp ll→Z→p+Pbσ dZ T1/p
10-5
10-3
10-1
10
[GeV]
Z
pT
1 10 102
Data/Model 0.5
1.0 1.5
[GeV]
Z
pT
1 10 102
Data/Model 0.5
1.0
1.5 1 10 102
]-2 [nb GeV T
Z/dp ll→Z→p+Pbσ dZ T1/p
10-5
10-3
10-1
10
*<2.0 1.0<yZ
Data CT10 Model
ATLAS Preliminary = 29 nb-1
p+Pb 2013, Lint
= 5.02 TeV sNN
1 10 102
]-2 [nb GeV T
Z/dp ll→Z→p+Pbσ dZ T1/p
10-5
10-3
10-1
10
[GeV]
Z
pT
1 10 102
Data/Model 0.5
1.0 1.5
[GeV]
Z
pT
1 10 102
Data/Model 0.5
1.0 1.5
Figure 6: The
dσ/d pTdistributions for
Z →`
+`
−in the ranges
−2< y
Z∗<
−1 (top left),−1< y
Z∗< 0
(top right), 0 < y
Z∗< 1 (bottom left), and 1 < y
Z∗< 2 (top right) compared with CT10 (scaled to have
the
totalcross-section predicted by MSTW2008 at NNLO) baseline. The lower panels are the data/model
ratios. The lower panel is data
/model ratio. The bars indicate statistical uncertainty and the shaded boxes
systematic uncertainty. The systematic uncertainties are correlated bin-by-bin. There is an overall scale
uncertainty of 3.4% stemming from the luminosity measurement that is not shown. Note that the leftmost
bin represents the range 0-3 GeV, but due to the log scale x-axis its left edge is truncated at 1 GeV.
0 10 20 30
)events N〉collN〈/(ZN9 10 2
4 6 8 10 12
10-9
×
Preliminary ATLAS
=29 nb-1
p+Pb 2013, Lint
= 5.02 TeV sNN
0-90% Centrality
<2.5 -2.5<yZ
DataNcoll〉 Uncertainty
〈
NNLO Prediction Ω=0)
Glauber (
0 10 20 30
2 4 6 8 10 12
10-9
×
=0.55 Ω Glauber-Gribov
〉 Npart
0 10 20 〈 30
2 4 6 8 10 12
10-9
×
=1.01 Ω Glauber-Gribov
0 10 20 30
/2)〉partN〈 / (η/dchdN
2 4 6
8 ATLASPreliminary b-1
µ = 1 p+Pb Lint
= 5.02 TeV sNN
= -0.465 ycm
< 2.7 η -2.7 <
< 2.7 η 2 <
< 1 η 0 <
< 0 η -1 <
< -2 η -2.7 <
Glauber
0 10 20 30
2 4 6 8
=0.55 Ω Glauber-Gribov
〉 Npart
0 10 20 〈 30
2 4 6 8
0
=1.01 Ω Glauber-Gribov
Figure 7: Left: The yield of
Zbosons per event scaled by
hNcollias a function of
hNparti. Each paneluses a di
fferent Glauber model configuration in calculating
hNparti(and
hNcolli); displayed from top tobottom are: the standard Glauber model with no Gribov fluctuations, Glauber-Gribov with
Ω=0.55, andGlauber-Gribov with
Ω=1.01. The bars indicate statistical uncertainty and the shaded boxes systematicuncertainty. The systematic uncertainties are correlated bin-by-bin. The
hNcolliuncertainty plotted does not include the bin-by-bin fully correlated uncertainty stemming from the uncertainty on σ
N+N→X. The σ
N+N→Xuncertainty is plotted on the NNLO prediction point. Right: The similar quantity for inclusive charged particle multiplicity from Ref. [20].
12
part〉
〈N
0 5 10 15 20 25
η/dchdN /dy ZdN
0 0.1 0.2 0.3 0.4 0.5 0.6 0.7 0.8 0.9 1
10-9
×
ATLAS Preliminary = 29 nb-1
p+Pb 2013, Lint
= 5.02 TeV, 0-90% Centrality sNN
Ω=0) Glauber (
=0.55 Ω Glauber-Gribov
=1.01 Ω Glauber-Gribov
part〉
〈N
〉-1)/
Npart
〈
⋅( a
Figure 8: The ratio
dNdNZ/dych/dη
(for
kyZ|< 2.5) as a function of
hNparti. The values of the ratio themslevesare wholly independent of the definition of
hNparti, but each point is plotted three times on the x-axiscorresponding to the three di
fferent Glauber implementations. A fit of the form a(hN
parti-1)/hNparti, isshown to be in good agreement with the data. Statistical uncertainties are plotted as bars. For readability,
systematic uncertainties (shaded boxes) are plotted only on the
Ω=0.55 set of points and the fit is to thesepoints.
y
Z-3 -2 -1 0 1 2 3 4
/dy
ll→Z→p+PbdN
-1 evtN
=0Ω-1〉
collN 〈
0 0.5 1 1.5
2 2.5 3
10
-9×
Ω=0) Glauber (
0.08
±
=0.23
〉 yZ
〈 0-10% Centrality,
0.06
±
=0.16
〉 yZ
〈 10-40% Centrality,
0.16
± -0.58
〉 yZ
〈 40-90% Centrality, CT10 Model
ATLAS = 29 nb-1 sNN = 5.02 TeV Preliminary p+Pb 2013, Lint
y
Z-3 -2 -1 0 1 2 3 4
/dy
ll→Z→p+PbdN
-1 evtN
=0.55Ω-1〉
collN 〈 0
0.5 1 1.5
2 2.5 3
10
-9×
=0.55 Ω Glauber-Gribov
0-10% Centrality 10-40% Centrality 40-90% Centrality CT10 Model
ATLAS = 29 nb-1 sNN = 5.02 TeV Preliminary p+Pb 2013, Lint
y
Z-3 -2 -1 0 1 2 3 4
/dy
ll→Z→p+PbdN
-1 evtN
=1.01Ω-1〉
collN 〈 0
0.5 1 1.5
2 2.5 3
10
-9×
=1.01 Ω Glauber-Gribov
0-10% Centrality 10-40% Centrality 40-90% Centrality CT10 Model
ATLAS = 29 nb-1 sNN = 5.02 TeV Preliminary p+Pb 2013, Lint