ATLAS-CONF-2013-025 11March2013
ATLAS NOTE
ATLAS-CONF-2013-025
March 8, 2013
Search for direct top squark pair production in events with a Z boson, b-jets and missing transverse momentum in 21 fb
−1of proton-proton
collisions at √
s = 8 TeV with the ATLAS detector
The ATLAS Collaboration
Abstract
A search is presented for direct top squark pair production using events with aZ bo- son,b-jets and large missing transverse momentum in final states with two or three leptons forming a same-flavour opposite-sign lepton pair with invariant mass consistent with the Z boson mass. The analysis is performed with 21 fb−1 of proton-proton collision data at
√s=8 TeV with the ATLAS detector. No excess beyond the Standard Model expectation is
observed. Interpretations of this result are provided for natural gauge-mediated supersym- metry breaking scenarios where the neutralino ( ˜χ01) is the next-to-lightest supersymmetric particle producing a Z boson and a gravitino ( ˜G) in the ˜χ01 → ZG˜ decay, and in models based on the direct production of heavy stop states (˜t2) that decay to light stop states (˜t1) via t˜2→Zt˜1.
c
Copyright 2013 CERN for the benefit of the ATLAS Collaboration.
Reproduction of this article or parts of it is allowed as specified in the CC-BY-3.0 license.
1 Introduction
Supersymmetry (SUSY) [1–7] is a theory beyond the Standard Model (SM) which predicts new bosonic partners for the existing fermions and fermionic partners for the known bosons. In the framework of a generic R-parity conserving minimal supersymmetric extension of the SM (MSSM) [8–12], SUSY particles are produced in pairs and the lightest supersymmetric particle (LSP) is stable, providing a possible candidate for the dark matter.
The supersymmetric partner of the top quark (top squark or stop) has two mass eigenstates with ˜t1 being the light and ˜t2the heavy state. Light top squarks are suggested by naturalness arguments [13, 14].
Searches for direct stop production have been performed by the ATLAS collaboration in the 0-lepton [15, 16], 1-lepton [17,18] and 2-lepton opposite-sign [19,20] channels and by the CMS collaboration [21–24].
The results from those analysis were interpreted considering two different stop decay modes: ˜t1 →tχ˜01 and ˜t1 →bχ˜±1 with ˜χ±1 →W(∗)χ˜01. In the latter case, several hypotheses on the ˜t1, ˜χ±1, ˜χ01mass hierarchy were assumed.
A challenging region of the stop parameter space is that where the lightest stop is only slightly heavier than the sum of the masses of the top quark and the lightest neutralino. This region of parameter space is difficult to cover with the current experimental searches due to the similarities of the kinematics with those of the SM top pair production background. A decay chain involving the heavy stop, such as
˜
t2→Zt˜1, provides a handle to discriminate stop signals from thet¯tbackground, if the ˜t2is not too heavy.
This way, a powerful discrimination between signal andt¯tcan be obtained by requiring a same-flavour opposite-sign lepton pair originating from theZ boson decay plus an additional lepton originating from the top quark produced in the ˜t1→tχ˜01decay.
A similar signature can also occur in gauge-mediated SUSY breaking (GMSB) models. In these models the gravitino ( ˜G) is typically the LSP and is very light (mG˜ < 1 keV). Assuming a SUSY mass scale of the messengers responsible for the electroweak symmetry breaking of around 10 TeV and low fine tuning, the lightest stop is expected to have a mass of less than 400 GeV [25]. Naturalness arguments suggest that ˜χ01(that is the next-to-lightest supersymmetric particle, NLSP) has a large higgsino compo- nent. The ˜χ01 is a mixture of gauginos ( ˜B, ˜W0) and higgsinos ( ˜Hu0, ˜Hd0), and therefore if the gravitino is the LSP, it decays to either a γ, Z, or Higgs boson. If the ˜χ01 is higgsino-like, it dominantly decays either via ˜χ01 →hG˜ or via ˜χ01→ZG. In this configuration the˜ Zboson can appear at the end of the stop decay chain. A previous ATLAS analysis, carried out using 7 TeV data with an integrated luminosity of 2.05 fb−1[26] has already excluded stop masses up to 310 GeV for 115 GeV<mχ˜0
1 <230 GeV.
In this paper we explore the stop pair production in final states characterised by the presence of aZ boson in events with two or three leptons forming a same-flavour opposite-sign lepton pair with invariant mass consistent with theZboson mass,b-jets and significant missing transverse momentum. Results are interpreted in the framework of natural GMSB and in a simplified model featuring ˜t2production.
2 The ATLAS detector
The ATLAS detector [27] consists of an inner tracking system (inner detector) surrounded by a thin superconducting solenoid providing a 2 T magnetic field, electromagnetic (EM) and hadronic calorime- ters, and a muon spectrometer. The inner detector consists of pixel and silicon microstrip detectors, surrounded by a straw tube transition radiation tracker. The electromagnetic calorimeter is a liquid ar- gon and lead detector, split into barrel1 (|η| < 1.475) and endcap (1.375 < |η| < 3.2) regions. Hadron
1ATLAS uses a right-handed coordinate system with its origin at the nominalppinteraction point (IP) in the center of the detector and thez-axis along the beam pipe. Thex-axis points from the IP to the center of the LHC ring, and they-axis points upward. Cylindrical coordinates (r, φ) are used in the transverse plane,φbeing the azimuthal angle around the beam pipe.
The pseudorapidity is defined in terms of the polar angleθasη=−ln tan(θ/2). The separation between final state particles is defined as∆R= p
(∆η)2+(∆φ)2. The transverse momentum is denoted aspT.
calorimetry is based on two different detector technologies. The barrel (|η| < 0.8) and extended barrel (0.8<|η|<1.7) calorimeters are composed of scintillator and steel, while the hadronic endcap calorime- ters (1.5 <|η|< 3.2) utilise liquid-argon and copper. The forward calorimeters (3.1< |η| < 4.9) are in- strumented with liquid-argon/copper and liquid-argon/tungsten, providing electromagnetic and hadronic energy measurements, respectively. The muon spectrometer is based on three large superconducting toroids arranged with an eight-fold azimuthal coil symmetry around the calorimeters, and a system of multiple stations of chambers for triggering and for precise track measurements.
3 Signal and Background Simulation
Simulated Monte Carlo (MC) event samples are used to aid in the description of the background and to model the SUSY signal. All SM MC samples utilised in the analysis are produced using the ATLAS Underlying Event Tune 2B [28] based detector simulation. The top quark pair background is simulated with P[29] interfaced to P6 [30] for the fragmentation and the hadronization processes. The top-quark mass is fixed at 172.5 GeV, and the next-to-leading order (NLO) parton distribution function (PDF) set CT10 [31] is used. A [32] samples are used for generator systematics, while H-
[33] and AMC [34] are used for hadronization and showering uncertainties respectively. Single top production is simulated with MC@NLO interfaced to H+Jfor thes-channel andWtpro- cesses and with AMC interfaced to P6 and using PDF set CTEQ6L1 [31] for thet-channel process. The nominal t¯t+boson samples are generated using the LO generator MG [35] inter- faced to P6 for the fragmentation and the hadronization processes. The total cross sections of these processes are normalised to NLO [36]. Asamples interfaced with Hfor the fragmentation and the hadronization processes, including J[37] for the underlying event description are used to estimate corresponding generator and hadronization systematics. Samples ofZ/γ∗production in associ- ation with up to five light/heavy jets are produced with S. In this case, heavy jets refers tobandc quarks. MC samples of dibosons (ZZ,WZandWW) decaying to final states with 2, 3 and 4 leptons are generated using S. In these samples, up to extra 3 partons are generated. The triboson processes
pp→ WWW → `ν`ν`ν, pp → ZWW → ```ν`ν andpp → ZZZ → ````ννare generated with M-
Gto LO in QCD withk-factors for NLO normalisation from Ref. [38]. These samples are interfaced to P6. The QCD multijet andγ+jet processes are simulated with P8 [39].
The SUSY signal models are generated using H++[40] and the CTEQ6L1 PDF set. Signal cross sections are calculated to next-to-leading order in the strong coupling constant, adding the re- summation of soft gluon emission at next-to-leading-logarithmic accuracy (NLO+NLL) [41–43]. The nominal cross section and the uncertainty are taken from an envelope of cross section predictions using different PDF sets and factorisation and renormalisation scales, as described in Ref. [44].
Signal from direct ˜t2t˜∗2production are studied using simplified models, where all SUSY particles are decoupled except for the two stops and the LSP. The only decays included in this model are ˜t2→Zt˜1and t˜1 →tχ˜01. The mass difference between the light stop and the neutralino is set tomt˜1 = mχ˜0
1 +180 GeV, a region not excluded by previous searches [17, 18], and signal points are generated varying the masses of the ˜t2and ˜χ01. Simulated samples corresponding to signals from direct ˜t1t˜∗1production for values of mt˜1 =mχ˜0
1 +180 GeV are also used in the analysis.
For the natural GMSB model, we consider a very similar model to that of Ref. [26], although the Higgs boson mass is fixed to 126 GeV, in agreement with the observation of a Higgs-like boson at the LHC, and tanβ=5. Maximal mixing is assumed for ˜t1and ˜χ01, ˜χ02, ˜χ±1 are assumed to be predominantly higgsino states. Branching fractions of ˜t1and higgsinos are predicted by the model. Ifmt˜1 < mt +mχ˜0
1, t˜1decays via ˜t1→bχ˜±1 exclusively, while ifmt˜1 >mt+mχ˜0
1, ˜t1may also decay with the same probability via ˜t1→t˜χ01(ortχ˜02). Signal points are generated varying the ˜t1and ˜χ01masses.
MC samples are processed through a detector simulation [45] based on Geant4 [46] and reconstructed
in the same manner as the data. The simulation includes the effect of multiple pp collisions and is weighted to reproduce the observed distribution of the average number of collisions per bunch crossing.
4 Physics Objects Reconstruction
Jets are reconstructed from three-dimensional calorimeter energy clusters by using the anti-kt algo- rithm [47] with a radius parameter of 0.4. Jet energies are corrected [48] for detector inhomogeneities, the non-compensating nature of the calorimeter, and the impact of multiple overlappingppinteractions, using factors derived from test beam, cosmic ray,ppcollision data and from a detailed Geant4 detector simulation. Baseline jets are required to have pT > 20 GeV and |η| < 2.8. For the signal selection, jets are furthermore required to have pT > 30 GeV and a minimum jet vertex fraction of 0.25 for jets with pT < 50 GeV. The jet vertex fraction is defined as the fraction of the sum of the pT of the tracks associated with the jet and matched to the selected primary vertex, over the sum of the pT of tracks associated with the jet. In the following, jets passing these requirements will be identified as signal jets.
Heavy-flavour tagging (b-tagging) of jets is performed using a dedicated algorithm which is based on a neural network using the output weights of theb-tagging algorithms as input [49]. An operating point is chosen corresponding to a 60% average efficiency and rejection factors of 577, 8 and 23 for light quark jets,c-quark jets andτleptons, respectively, obtained using simulatedt¯tevents. Signal jets which pass thisb-tagging operation point and|η|<2.5 are identified asb-jets.
Baseline electron candidates must satisfy the “medium” selection criteria as defined in Ref. [50] and are required to fulfill pT >10 GeV and|η| <2.47. Signal electrons must pass the previous requirements and also need to be isolated, i.e. the scalar sum of pTof charged tracks,ΣpT, within a cone in theη−φ plane of radius ∆R = 0.3 around the candidate excluding its own track must be less than 16% of the electronpT. They must have a longitudinal impact parameter|z0sinθ|<0.4 mm.
Baseline muon candidates are required to havepT >10 GeV,|η|<2.4 and are identified by matching an extrapolated inner detector track and one or more track segments in the muon spectrometer [51, 52].
Signal muons are then required to be isolated, i.e. the scalar sum of pTof charged tracks,ΣpT, within a cone in theη−φplane of radius∆R= 0.3 around the muon candidate excluding its own track must be less than 12% of the muonpT. In addition, muons must have a longitudinal impact parameter|z0sinθ|<
0.4 mm.
To resolve overlaps between the reconstructed jets and leptons, baseline jet candidates within a dis- tance of∆R=0.2 of a baseline electron candidate are rejected. Furthermore, any lepton baseline candi- date within a distance of∆R=0.4 of the remaining baseline jet candidates is also rejected. To suppress baseline electrons where two distinct tracks are associated mistakenly with one calorimeter cluster, if two baseline electrons are found within a distance∆R=0.1, the softest is rejected. Finally, if a baseline electron and a baseline muon are within∆R = 0.1, both are rejected to suppress bremsstrahlung effects where the momentum of the particle is incorrectly measured.
The calculation of EmissT [53] is based on the vectorial sum of the pT of reconstructed jets with pT >20 GeV , baseline leptons withpT >10 GeV before the application of the overlap removal as well as calorimeter energy clusters not belonging to reconstructed objects.
5 Event Pre-Selection
After the application of beam, detector and data quality requirements, the total luminosity considered corresponds to 20.7 fb−1 with the preliminary uncertainty of±3.6% based on the calibration procedure described in Ref. [54]. Events are selected if they either pass any of the two single electron triggers, where the one with the lowest threshold reaches constant efficiency at 25 GeV, or any of the single muon
triggers reaching constant efficiency above 25 GeV. For both cases, the lowest threshold triggers have isolation criteria which are less strict than those used for the signal leptons in the analyses.
The presence of at least one primary vertex, with at least five tracks withpT > 0.4 GeV associated to it, is required. A set of cuts having a high rejection against “fake” jets while preserving the effi- ciency close to 100% for signal jets has been used. The selection criteria are based on the timing of the calorimeter signal with respect to that of the bunch crossing, on the quality of the fit on the calorimeter pulse shape, on the fraction of jet energy belonging to specific calorimeter samples and on the fraction of the transverse momentum of the jet carried by charged tracks. Events are rejected if any jet is thus identified as fake.
6 Signal Region Definitions
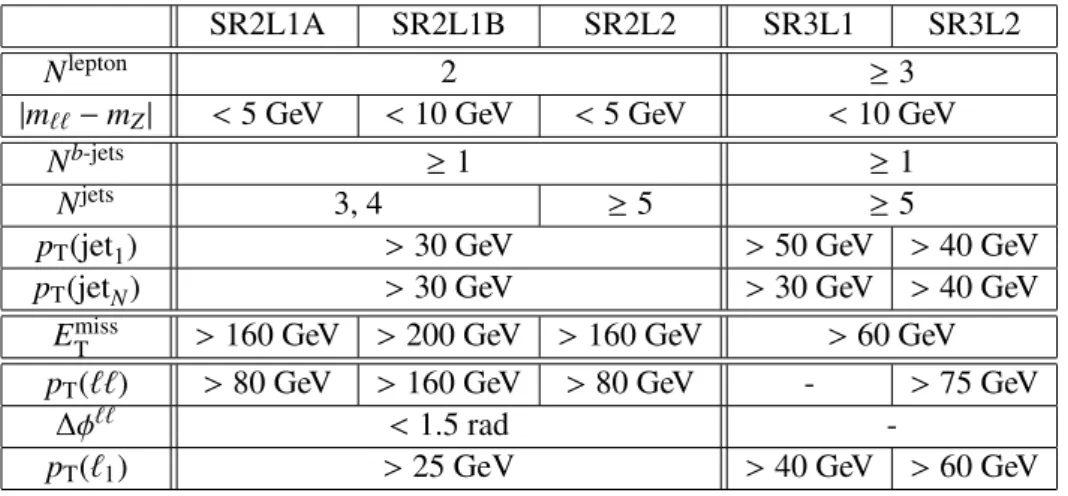
Five signal regions are used in the analysis, as summarised in Table 1, which can be divided into those requiring exactly two or at least three leptons.
For the two-lepton signal regions, exactly two same-flavour opposite-sign (SFOS) baseline leptons are selected. If there are more baseline leptons, the event is rejected to avoid overlaps with the three- lepton signal regions. The leading lepton pT is required to be larger than 25 GeV to be compatible with the constant trigger efficiency regime. At least oneb-jet is required and the SFOS pair is required to have invariant mass (m``) compatible with theZ-boson mass and azimuthal distance∆φ``below 1.5. In order to optimise the parameter space coverage, three signal regions are defined. SR2L1A and SR2L1B are optimised for the smallmt˜1−mχ˜0
1region of the natural GMSB model where the jet multiplicity is relatively low while SR2L2 is optimised for the large mt˜1 −mχ˜0
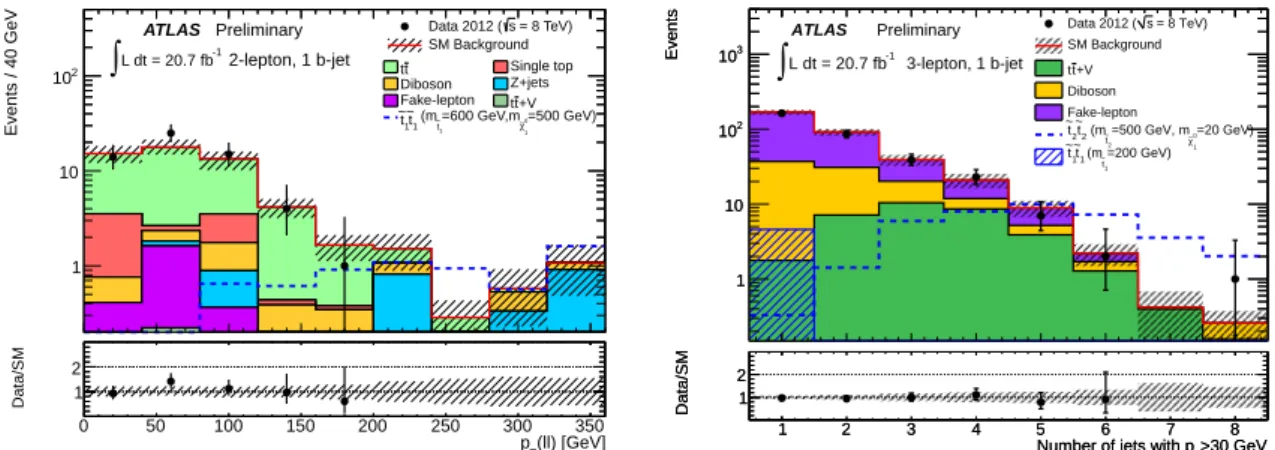
1 region where the jet multiplicity is high. Since theZ boson produced in stop signal events is boosted, the transverse momentum of the dilepton system, pT(``), tends to be large, as shown in the left-hand plot of Figure 1. Requirements of pT(``) > 80 GeV or 160 GeV are therefore applied in the signal regions.
Table 1: Summary of the event selection in the signal regions used in the analysis.
SR2L1A SR2L1B SR2L2 SR3L1 SR3L2
Nlepton 2 ≥3
|m``−mZ| <5 GeV <10 GeV <5 GeV <10 GeV
Nb-jets ≥1 ≥1
Njets 3, 4 ≥5 ≥5
pT(jet1) >30 GeV >50 GeV >40 GeV
pT(jetN) >30 GeV >30 GeV >40 GeV
EmissT >160 GeV >200 GeV >160 GeV >60 GeV pT(``) >80 GeV >160 GeV >80 GeV - >75 GeV
∆φ`` <1.5 rad -
pT(`1) >25 GeV >40 GeV >60 GeV
In the three-lepton signal regions, at least three signal leptons with two of them forming an SFOS pair with invariant mass compatible with theZ-boson mass are required. At least oneb-jet and a high-pT
leading lepton, with at least 40 GeV and 60 GeV respectively for each signal region, are required to suppress the diboson background. The signal is expected to have higher jet multiplicity than the SM background, as shown in the right-hand plot of Figure 1. Therefore at least five signal jets are required to improve the signal purity.
(ll) [GeV]
pT
Events / 40 GeV
1 10 102
2-lepton, 1 b-jet L dt = 20.7 fb-1
∫
= 8 TeV) s Data 2012 ( SM Background t
t Single top
Diboson Z+jets Fake-lepton tt+V
=500 GeV)
0 χ∼1
=600 GeV,m
t1
(m~
t1
~ t1
~ ATLAS Preliminary
(ll) [GeV]
pT
0 50 100 150 200 250 300 350
Data/SM 1
2 Number of jets with pT>30 GeV
1 2 3 4 5 6 7 8
Events
1 10 102
103
= 8 TeV) s Data 2012 ( SM Background
+V t t Diboson Fake-lepton
=20 GeV)
0 χ∼1
=500 GeV, m t2
(m~ t2
~ t2
~
=200 GeV) t1
(m~ t1
~ t1
~ L dt = 20.7 fb-1
∫ATLAS Preliminary 3-lepton, 1 b-jet
>30 GeV Number of jets with pT
1 2 3 4 5 6 7 8
Events
1 10 102
103
>30 GeV Number of jets with pT
1 2 3 4 5 6 7 8
Data/SM 1
2
>30 GeV Number of jets with pT
1 2 3 4 5 6 7 8
Data/SM 1
2
Figure 1: Left, pT(``) distributions in SR2L1A before the pT(``) > 80 GeV and ∆φ`` < 1.5 cuts.
Right, number of signal jets with pT > 30 GeV in events with 3 signal leptons after the m`` and b- jets cuts in SR3L1 for an integrated luminosity of 20.7 fb−1. The background component denoted as
“Fake-lepton” corresponds to events with fake leptons and is estimated from data as explained in Section 7. Shaded bands denote the statistical and systematic uncertainty on the background. For illustration, distributions for selected signal points are also shown. In the left plot, the stop natural GMSB model with mt˜1 =600 GeV,mχ˜0
1 = 500 GeV is overlaid. In the right plot, the simplified model withmt˜2 = 500 GeV andmχ˜0
1 =20 GeV is overlaid.
For regions of themt˜2−mχ˜0
1 signal parameter space where the ˜t2−t˜1mass splitting is significant, the Z-boson is boosted. For this type of scenario a cut is applied on the transverse momentum of the dilepton system with invariant mass compatible with theZ-boson mass. The SR3L1 is aimed at signal models producing non-boostedZbosons while SR3L2 is optimised for high-mass splittings between the stops.
7 Background estimation
Two-lepton signal regions
There are three main sources of background in the dilepton signal regions: events with two real leptons coming from either top pair production orZ-boson production associated with jets and a typically small contribution from events with misidentified (“fake”) leptons.
The term fake lepton denotes leptons coming the decay of aborcquark, photon conversions or a wrongly identified hadron. The contribution from events containing fake leptons is estimated from data using the so-called matrix method as described in Ref. [55]. Classes of “tight” and “loose” leptons are defined, where “loose” stands for baseline leptons and “tight” for signal leptons. The method counts the number of observed events containing loose-loose, loose-tight, tight-loose and tight-tight lepton pairs.
Using four linear equations, the number of events in the signal region with fake-fake, fake-real, real-fake and real-real lepton pairs can be determined. The parameters of the equations contain two types of prob- abilities for electrons and muons separately: the probability for a loose fake lepton and the probability for a loose real lepton to pass the tight selection criteria.
The probability for fake leptons to pass the tight selection, also referred to as the “fake rate”, is determined separately for heavy flavour and photon conversion. MC studies show that the contribution of fake leptons originating from light flavour jets is negligible in the signal regions. The heavy-flavour fake rate is determined with a “tag-and-probe” method in a control region dominated by cc¯ and bb¯ production by selecting events with exactly oneb-jet with a muon within ∆R < 0.4, and an additional lepton for which the fake rate is measured. Contributions from other processes such asW+jets ort¯tare
reduced by requiringEmissT <60 GeV andmT <50 GeV. A heavy-flavour purity of approximately 95%
is obtained in this control region and the remaining contamination from other processes is subtracted using MC. The photon conversion fake rate is measured in a sample of photons radiated from a muon inZ →µµevents selected by requiring three leptons with an opposite-sign muon pair and an additional electron with|mµµe−mZ| <10 GeV. In the matrix method the electron fake rate is averaged according to the fraction of heavy-flavour and photon conversion fakes obtained in MC for the different signal regions.
The real lepton efficiency is determined with a tag-and-probe method in control regions with enhanced contributions fromZ → ``processes, defined requiring exactly two same-flavour opposite-sign leptons with|m``−mZ| <10 GeV. The tag lepton is required to be a signal lepton and the loose-to-tight lepton efficiency is measured using the second lepton as a probe.
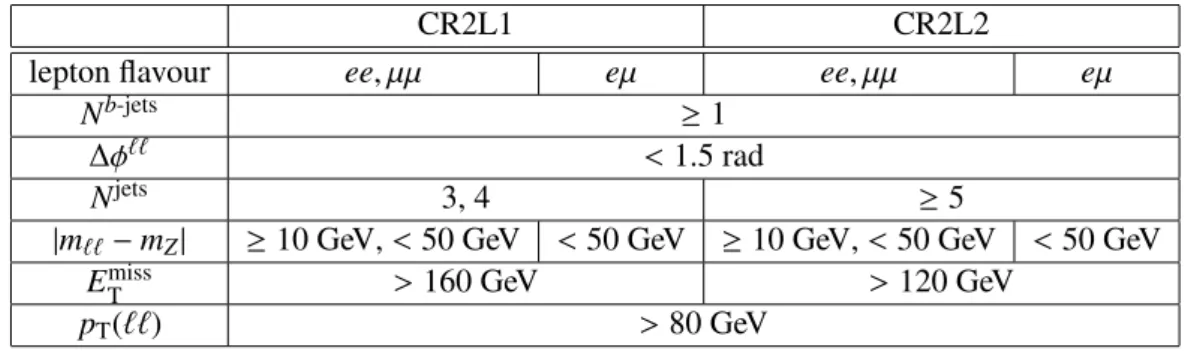
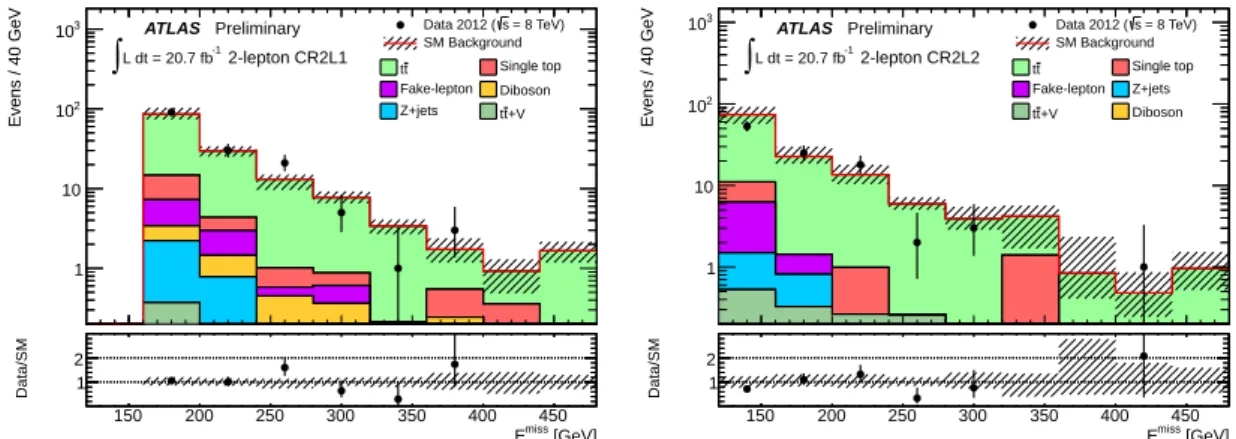
Events with two real leptons originating from top pair production can be estimated via control regions consisting of events that pass similar selection requirements as those of the signal regions except that they must lie in the Z mass sideband or contain an opposite-flavour lepton pair where the t¯t process is dominant. Signal contamination to these control regions is negligible or has a small impact in the background estimates compared to the signal contribution in the signal regions. A transfer factor from this control region to the signal region is determined using MC. The t¯tyield is normalised to data in the control region subtracting non-t¯tevents and then extrapolated to the signal region using the transfer factor. The control region corresponding to SR2L1A and SR2L1B (denoted as CR2L1) is obtained by taking a sideband in the dilepton invariant mass of 10 GeV < |m`` −mZ| < 50 GeV for same-flavour leptons and |m``−mZ| < 50 GeV for different flavour. For SR2L2 (denoted as CR2L2) a looserEmissT selection is employed to increase the statistics in the control region. A summary of the control region definitions is given in Table 2. TheEmissT distributions for data and MC simulation before normalization in the control region are shown in Figure 2. Expected and observed number of events in this control region is shown in Table 3.
Table 2: Summary of the event selection for thet¯tbackground control regions in the 2-lepton channel.
CR2L1 CR2L2
lepton flavour ee, µµ eµ ee, µµ eµ
Nb-jets ≥1
∆φ`` <1.5 rad
Njets 3, 4 ≥5
|m``−mZ| ≥10 GeV,<50 GeV <50 GeV ≥10 GeV,<50 GeV <50 GeV
ETmiss >160 GeV >120 GeV
pT(``) >80 GeV
Background events fromZ-boson production associated with jets typically contain fakeEmissT from resolution effects of the jet momentum measurement. A “jet smearing method” [56] is used to estimate that contribution in the highETmisstail using seed events obtained from data events with lowETmiss. The response function (preco jetT /ptruth jetT ) used to smear the jet momenta is taken from multijet MC samples generated with P8. This response function is corrected with dataγ+jet events where the photon and the jet are balanced. Since the energy resolution of photons is much smaller than that of jets, thepTof the balanced photon can be used as reference for that of the jet. The pseudo-data is generated by smearing jet momenta in seed events. Generated pseudo-data is normalised to data in the ETmiss < 80 GeV region subtracting other SM background events.
Table 3: Expected and observed number of events in the t¯tcontrol regions for the 2-lepton channel at 20.7 fb−1. The error shown is the sum of the MC statistical uncertainty and the experimental uncertain- ties.
CR2L1 CR2L2
Data 142 89
Total SM (before fit) 135±16 124±17 t¯t(before fit) 116±14 111±16 t¯t(after fit) 122±15 77±11
Other SM 19±4 12±4
[GeV]
miss
ET
Evens / 40 GeV
1 10 102
103
2-lepton CR2L1 L dt = 20.7 fb-1
∫
= 8 TeV) s Data 2012 ( SM Background t
t Single top
Fake-lepton Diboson Z+jets tt+V ATLAS Preliminary
[GeV]
miss
ET
150 200 250 300 350 400 450
Data/SM 1
2 EmissT [GeV]
Evens / 40 GeV
1 10 102
103
2-lepton CR2L2 L dt = 20.7 fb-1
∫
= 8 TeV) s Data 2012 ( SM Background t
t Single top
Fake-lepton Z+jets +V
t
t Diboson
ATLAS Preliminary
[GeV]
miss
ET
150 200 250 300 350 400 450
Data/SM 1
2
Figure 2: TheEmissT distributions in thet¯tcontrol regions for 2-lepton channel at 20.7 fb−1 before nor- malising the t¯tprocess to data. Shaded bands denote the statistical and systematic uncertainty on the background.
Three-lepton signal regions
The main sources of background in the three-lepton signal regions stem from processes that contain three prompt leptons (t¯t+Z and di- and tri-boson events), as well as events with fake leptons (mainlyt¯t andZ+jets).
Thet¯t+Z and the diboson backgrounds are estimated using MC samples described in Section 3. A validation region which enhances the contribution oft¯t+Zis defined to verify the MC prediction in data.
The abundance of events with fake leptons is determined from data using the matrix method where the fake rate and lepton efficiency are determined as in the two-lepton case. For the three-lepton signal regions, the leading lepton is considered to be real, which is a valid assumption in 99% of the cases according to simulations, and the matrix method is applied for the second and third leading leptons.
The majority of fake muons, in simulation, comes from heavy-flavour quark decays while for electrons, although most come from heavy-flavour, some originate from photon conversions.
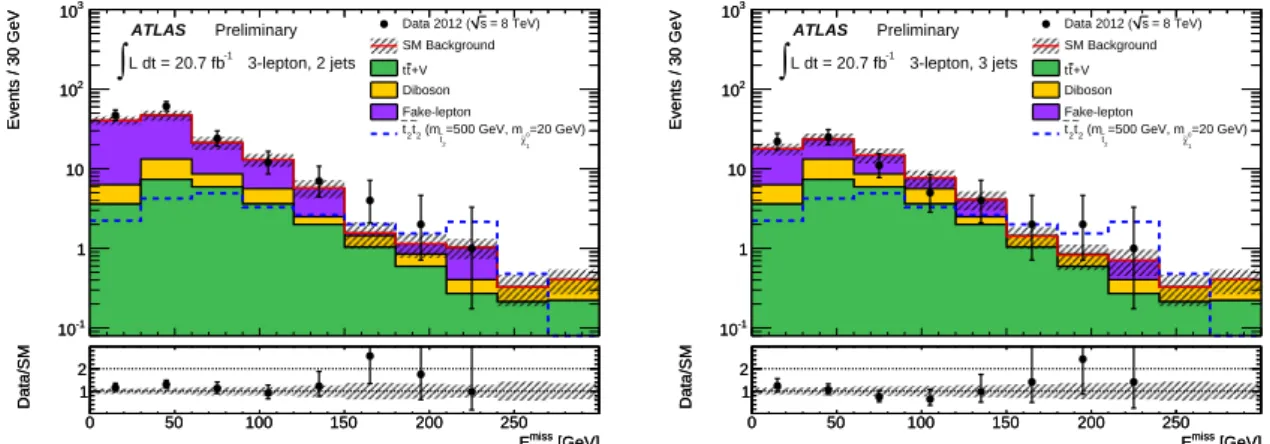
Validation regions with loosened jet multiplicity (2-3 signal jets) and similar background composition are used to test the method. TheETmissdistributions for the 2-jet and 3-jet validation regions are shown in Figure 3 after requiringm`` to be inside the Z-boson mass window and at least oneb-jet.
[GeV]
miss
ET
0 50 100 150 200 250 300
Events / 30 GeV
10-1
1 10 102
103
= 8 TeV) s Data 2012 ( SM Background
+V t t Diboson Fake-lepton
=20 GeV)
0 χ∼1
=500 GeV, m t2
(m~ t2
~ t2
~ L dt = 20.7 fb-1
∫ATLAS Preliminary 3-lepton, 2 jets
[GeV]
miss
ET
0 50 100 150 200 250 300
Events / 30 GeV
10-1
1 10 102
103
[GeV]
miss
ET
0 50 100 150 200 250
Data/SM 1
2
[GeV]
miss
ET
0 50 100 150 200 250
Data/SM 1
2 EmissT [GeV]
0 50 100 150 200 250 300
Events / 30 GeV
10-1
1 10 102
103
= 8 TeV) s Data 2012 ( SM Background
+V t t Diboson Fake-lepton
=20 GeV)
0 χ∼1
=500 GeV, m t2
(m~ t2
~ t2
~ L dt = 20.7 fb-1
∫ATLAS Preliminary 3-lepton, 3 jets
[GeV]
miss
ET
0 50 100 150 200 250 300
Events / 30 GeV
10-1
1 10 102
103
[GeV]
miss
ET
0 50 100 150 200 250
Data/SM 1
2
[GeV]
miss
ET
0 50 100 150 200 250
Data/SM 1
2
Figure 3: Missing transverse momentum after the m`` and b-jets cut for an integrated luminosity of 20.7 fb−1. A cut requiring at least two signal jets (left) or three signal jets (right) with pT > 30 GeV is also included. Shaded bands denote the statistical and systematic uncertainty on the background.
For illustration, distributions for a signal point in the ˜t2t˜∗2 simplified model with mt˜
2 = 500 GeV and mχ˜0
1 =20 GeV are also shown.
8 Systematic uncertainties
The dominant detector-related systematic effects are due to the jet energy scale (JES) and resolution (JER) uncertainties, and the uncertainties in theb-tagging efficiency and mistag rates.
The JES uncertainty is derived from a combination of simulation, test-beam data and in-site mea- surements [57–59]. Additional terms accounting for flavour composition, flavour response, close-by jets, pileup andb-jet uncertainties are taken into account. JER uncertainties are determined with an in- situ measurement of the jet response asymmetry in dijet events [48, 60]. These uncertainties on jets are propagated to theEmissT measurement, and additional uncertainties onETmissarising from energy deposits not associated with any reconstructed objects are also included. Theb-tagging uncertainty is evaluated by taking the variation of theη,pTdependent scale-factors applied to each signal jet in simulation within a range that reflects the systematic uncertainty on the measured tagging efficiency and mistag rates. The lepton identification and energy scale uncertainties are also taken into account. Typically the lepton en-
ergy scale and resolution is known with an uncertainty of the order of a few percent. An uncertainty of 3.6% on the integrated luminosity is considered.
Systematic uncertainties on the lepton fake rate are computed by performing variations on the control regions used to derive them. Additional uncertainties are included to account for possible pT and η dependencies, and composition of the fake-lepton background in case of electrons (heavy flavour and conversions).
The uncertainties on the modelling of background processes are determined by testing different gen- erators as well as parton shower and hadronization packages. The systematic uncertainties on the mod- elling of t¯t+jets, used only to determine the transfer factors between control and signal regions in the two-lepton case, are evaluated by comparing results obtained with the Pand Agenerators.
The hadronization uncertainty is addressed by comparing, at truth level, Pinterfaced to P6 with P interfaced to H+J. The parton shower uncertainty is estimated by taking the variation between a reference AMC sample with others with different parton shower model. The uncertainties on the modelling oft¯t+vector bosons are evaluated by comparing MGinterfaced to P6 with Ainterfaced with H+J. A 30% cross section uncertainty is assumed [36]
for these processes. For diboson production processes, the uncertainties on the modelling of the produc- tion process are evaluated by comparing the results obtained with the Sand the Pgenerators.
The uncertainty in MC cross sections are 5% for ZZ [61] and 7% forWZ [62]. For tribosons produc- tion processes a conservative 100% uncertainty is assumed. The statistical uncertainty in the number of Monte Carlo events is taken into account in the overall systematic uncertainty.
9 Results and Interpretation
The number of data events observed in each signal region for the dilepton and three-lepton analyses is reported in Table 4 together with the expected SM background contribution. Figures 4 and 5 show the EmissT distributions for data and background expectations for each signal region.
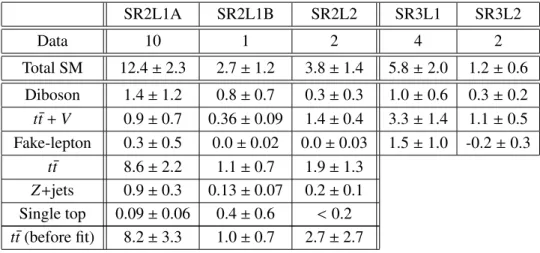
Table 4: Observed events and predicted numbers of events for each SM background process in the signal regions used in the analysis for an integrated luminosity of 20.7 fb−1. The “Fake-lepton” category includest¯t, single top andZ+jets processes for the three-lepton signal regions SR3L1 and SR3L2.
SR2L1A SR2L1B SR2L2 SR3L1 SR3L2
Data 10 1 2 4 2
Total SM 12.4±2.3 2.7±1.2 3.8±1.4 5.8±2.0 1.2±0.6 Diboson 1.4±1.2 0.8±0.7 0.3±0.3 1.0±0.6 0.3±0.2 t¯t+V 0.9±0.7 0.36±0.09 1.4±0.4 3.3±1.4 1.1±0.5 Fake-lepton 0.3±0.5 0.0±0.02 0.0±0.03 1.5±1.0 -0.2±0.3
t¯t 8.6±2.2 1.1±0.7 1.9±1.3 Z+jets 0.9±0.3 0.13±0.07 0.2±0.1 Single top 0.09±0.06 0.4±0.6 <0.2 t¯t(before fit) 8.2±3.3 1.0±0.7 2.7±2.7
No excess is found in any of the signal regions. These results are used to derive model-independent limits and also interpreted in the framework of the models described in Section 1. All limits are deter- mined with a fit based on the profile likelihood method using asymptotic formulae [63] and correspond
[GeV]
miss ET
Events / 40 GeV
1 10 102 103 104
2-lepton SR2L1A L dt = 20.7 fb-1
∫
= 8 TeV) s Data 2012 ( SM Background Z+jets tt Diboson Single top
+V t
t Fake-lepton
=500 GeV)
0 χ∼1
=600 GeV,m t1
(m~ t1
~ t1
~ ATLAS Preliminary
[GeV]
miss ET
0 50 100 150 200 250 300 350 400
Data/SM 1
2 EmissT [GeV]
Events / 40 GeV
1 10 102 103 104
2-lepton SR2L1B L dt = 20.7 fb-1
∫
= 8 TeV) s Data 2012 ( SM Background Z+jets Diboson
t
t tt+V
Single top Fake-lepton
=500 GeV)
0 χ∼1
=600 GeV,m t1
(m~ t1
~ t1
~ ATLAS Preliminary
[GeV]
miss ET
0 50 100 150 200 250 300 350 400
Data/SM 1
2
[GeV]
miss ET
Events / 40 GeV
1 10 102
103 ∫L dt = 20.7 fb-12-lepton SR2L2
= 8 TeV) s Data 2012 ( SM Background Z+jets tt Diboson tt+V Single top Fake-lepton
=500 GeV)
0 χ∼1
=600 GeV,m t1
(m~ t1
~ t1
~ ATLAS Preliminary
[GeV]
miss ET
0 50 100 150 200 250 300 350 400
Data/SM 1
2
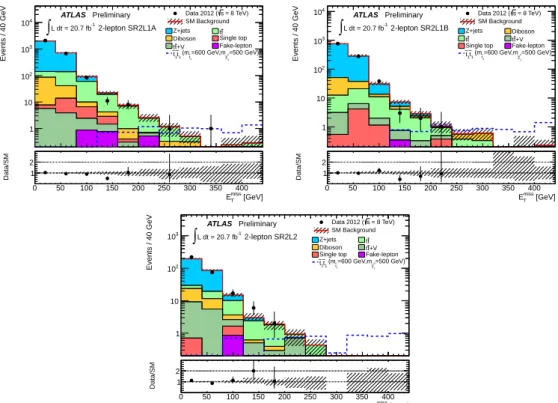
Figure 4: Missing transverse momentum distribution for the 2-lepton signal regions SR2L1A (upper left plot), SR2L1B (upper right plot) and SR2L2 (lower plot) before the final EmissT . Z+jets distributions are obtained using the jet smearing method. Other SM backgrounds are obtained from MC simulation (though the t¯tprocess is normalised in the control region) shown with the sum of JES uncertainty, b- tagging uncertainty and MC statistical uncertainty. Shaded bands denote the statistical and systematic uncertainty on the background. For illustration, distributions for a GMSB signal scenario with mt˜1 = 600 GeV,mχ˜0
1 =500 GeV are shown.
[GeV]
miss
ET
0 50 100 150 200 250 300
Events / 30 GeV
10-1
1 10
= 8 TeV) s Data 2012 ( SM Background
+V t t Diboson Fake-lepton
=20 GeV)
0 χ∼1
=500 GeV, m t2
(m~ t2
~ t2
~ L dt = 20.7 fb-1
∫ATLAS Preliminary 3-lepton SR3L1
[GeV]
miss
ET
0 50 100 150 200 250 300
Events / 30 GeV
10-1
1 10
[GeV]
miss
ET
0 50 100 150 200 250
Data/SM 1
2
[GeV]
miss
ET
0 50 100 150 200 250
Data/SM 1
2 EmissT [GeV]
0 50 100 150 200 250 300
Events / 60 GeV
10-1
1 10
= 8 TeV) s Data 2012 ( SM Background
+V t t Diboson Fake-lepton
=20 GeV)
0 χ∼1
=500 GeV, m t2
(m~ t2
~ t2
~ L dt = 20.7 fb-1
∫ATLAS Preliminary 3-lepton SR3L2
[GeV]
miss
ET
0 50 100 150 200 250 300
Events / 60 GeV
10-1
1 10
[GeV]
miss
ET
0 50 100 150 200 250
Data/SM 1
2
[GeV]
miss
ET
0 50 100 150 200 250
Data/SM 1
2
Figure 5: Missing transverse momentum for the 3-lepton signal regions SR3L1 (left) and SR3L2 (right) before the finalETmisscut for an integrated luminosity of 20.7 fb−1. Shaded bands denote the statistical and systematic uncertainty on the background. For illustration, distributions for a signal point in the ˜t2t˜∗2 simplified model withmt˜2 =500 GeV andmχ˜0
1 =20 GeV are also shown.
to 95% CL limits using the CLs[64] calculation. For the model-independent limits, results are calculated using pseudo-experiments and are in good agreement with those found using the asymptotic formulae.
Limits on model-independent beyond-SM contributions are derived with the same statistical treat- ment but without signal model-dependent inputs (i.e. without signal contamination in the control regions, and without experimental and theoretical signal systematic uncertainties). The resulting limits are shown in Table 5.
Table 5: Signal model independent upper limits on the number of beyond-SM events (Nnon-SM) and the visible signal cross section (σvis =σprod×A×) in the five signal regions. The numbers (in brackets) give the observed (expected) 95% CL upper limits. Calculations are performed with pseudo-experiments.
Obs. (exp.) upper limits SR2L1A SR2L1B SR2L2 SR3L1 SR3L2
Nnon-SM 7.5 (9.0) 3.5 (4.1) 4.2 (5.2) 5.5 (6.4) 4.9 (3.9)
σvis[fb] 0.36 (0.43) 0.17 (0.20) 0.20 (0.25) 0.27 (0.31) 0.24 (0.19)
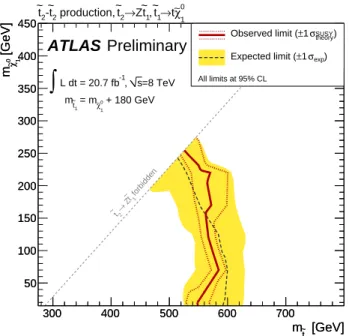
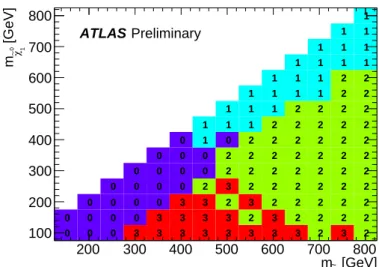
Figure 6 shows the limit obtained in the ˜t2t˜∗2 simplified model using the signal region with the best expected sensitivity. The results excludemt˜
2 < 530 GeV formχ˜0
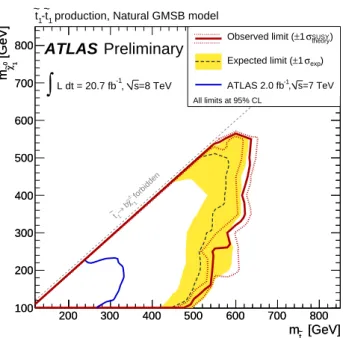
1 < 245 GeV. In Figure 7 the expected and observed limits are shown for the GMSB scenarios on the ˜t1, ˜χ01mass plane. The expected limit is determined by taking the most sensitive region, based on the expected CLs, out of the two and three- lepton signal regions.
[GeV]
t2
m~
300 400 500 600 700
[GeV] 1 0χ∼m
50 100 150 200 250 300 350 400 450
[GeV]
t2
m~
300 400 500 600 700
[GeV] 1 0χ∼m
50 100 150 200 250 300 350 400 450
ATLAS Preliminary
=8 TeV s
-1, L dt = 20.7 fb
∫
+ 180 GeV1 χ∼0
= m
t1
m~
)
SUSYtheory
σ
±1 Observed limit (
exp) σ
±1 Expected limit ( 1
χ∼0
→t t1
, ~ t1
Z~
2→
~t production, t2
-~ t2
~
All limits at 95% CL
forbidden1
~t
→ Z t2
~
Figure 6: Expected and observed exclusion limit in the mt˜
2-mχ˜0
1 plane for the 3-lepton analysis. All uncertainties except the theoretical signal cross section uncertainties are included. The contours of the yellow band around the expected limit are the ±1σresults. The dotted red lines around the observed limit illustrate the change in the observed limit as the nominal signal cross section is scaled up and down by the theoretical uncertainty. All limits are computed at 95% CL.
10 Summary and Conclusions
This note presents dedicated searches for direct stop pair production in decays with an experimental signature compatible with the production of aZ-boson,b-jets and missing transverse momentum. The
[GeV]
t1
m~
200 300 400 500 600 700 800
[GeV] 1 0χ∼m
100 200 300 400 500 600 700 800
[GeV]
t1
m~
200 300 400 500 600 700 800
[GeV] 1 0χ∼m
100 200 300 400 500 600 700
800 ATLAS Preliminary
=8 TeV s
-1, L dt = 20.7 fb
∫
)
SUSYtheory
σ
±1 Observed limit (
exp) σ
±1 Expected limit (
=7 TeV s
-1, ATLAS 2.0 fb production, Natural GMSB model
t1
-~ t1
~
All limits at 95% CL
forbidden
±
χ∼1
→1 b
~t
Figure 7: Expected and observed exclusion limits at 95% CL for stop natural GMSB model. All un- certainties except the theoretical signal cross section uncertainties are included. The contours of the yellow band around the expected limit are the ±1σresults. The dotted red lines around the observed limit illustrate the change in the observed limit as the nominal signal cross section is scaled up and down by the theoretical uncertainty. For comparison, the observed exclusion limit with 2.05 fb−1 of data at
√s=7 TeV at ATLAS for a similar model [26] is shown.
results are interpreted in the framework of simplified models with production of ˜t2 as well as in the natural GMSB model.
In a simplified model characterised by the decay chain ˜t2 → t˜1Z, parameter space regions with mt˜2 <530 GeV andmχ˜0
1 <245 GeV are excluded with 95% confidence level.
In the GMSB scenario, where the ˜t1might decay viabχ˜±1,tχ˜01( ˜χ02) and ˜χ01decay inZ(h) ˜G, parameter space regions with ˜t1 masses below 450 GeV are excluded with 95% confidence for any value of the χ˜01 mass. Better sensitivity is achieved in the parameter space region near the kinematic boundary of the ˜t1 → bχ˜±1 decay where the exclusion reaches ˜t1 masses of around 600 GeV for ˜χ01masses of about 550 GeV.
References
[1] P. Ramond,Dual Theory for Free Fermions, Phys. Rev.D3(1971) 2415–2418.
[2] Y. Golfand and E. Likhtman,Extension of the Algebra of Poincare Group Generators and Violation of p Invariance, JETP Lett.13(1971) 323–326.
[3] A. Neveu and J. H. Schwarz,Factorizable dual model of pions, Nucl. Phys.B31(1971) 86–112.
[4] A. Neveu and J. H. Schwarz,Quark Model of Dual Pions, Phys. Rev.D4(1971) 1109–1111.
[5] D. Volkov and V. Akulov,Is the Neutrino a Goldstone Particle?, Phys. Lett.B46(1973) 109–110.
[6] J. Wess and B. Zumino,A Lagrangian Model Invariant Under Supergauge Transformations, Phys.
Lett.B49(1974) 52.
[7] J. Wess and B. Zumino,Supergauge Transformations in Four-Dimensions, Nucl. Phys.B70(1974) 39–50.
[8] P. Fayet,Supersymmetry and Weak, Electromagnetic and Strong Interactions, Phys. Lett.B64 (1976) 159.
[9] P. Fayet,Spontaneously Broken Supersymmetric Theories of Weak, Electromagnetic and Strong Interactions, Phys. Lett.B69(1977) 489.
[10] G. R. Farrar and P. Fayet,Phenomenology of the Production, Decay, and Detection of New Hadronic States Associated with Supersymmetry, Phys. Lett.B76(1978) 575–579.
[11] P. Fayet,Relations Between the Masses of the Superpartners of Leptons and Quarks, the Goldstino Couplings and the Neutral Currents, Phys. Lett.B84(1979) 416.
[12] S. Dimopoulos and H. Georgi,Softly Broken Supersymmetry and SU(5), Nucl. Phys.B193(1981) 150.
[13] R. Barbieri and G. Giudice,Upper Bounds on Supersymmetric Particle Masses, Nucl.Phys.B306 (1988) 63.
[14] B. de Carlos and J. Casas,One loop analysis of the electroweak breaking in supersymmetric models and the fine tuning problem, Phys.Lett.B309(1993) 320–328,arXiv:hep-ph/9303291.
[15] ATLAS Collaboration,Search for a Supersymmetric Partner of the Top Quark in Final States with Jets and Missing Transverse Momentum at √
s=7TeV with the ATLAS Detector, Phys. Rev. Lett.
109(2012) 211802.
[16] ATLAS Collaboration,Search for direct stop production in events with missing transverse momentum and two b-jets using 12.8 fb−1of pp collisions at √
s=8TeV with the ATLAS detector, ATLAS-CONF-2013-001 (2013).https://cds.cern.ch/record/1503233.
[17] ATLAS Collaboraton,Search for Direct Top Squark Pair Production in Final States with One Isolated Lepton, Jets, and Missing Transverse Momentum in √
s=7TeV pp Collisions Using 4.7 fb−1of ATLAS Data, Phys. Rev. Lett109(2012) 211803.
[18] ATLAS Collaboration,Search for direct top squark pair production in final states with one isolated lepton, jets, and missing transverse momentum in √
s=8 TeV pp collisions using 13.0−1of ATLAS data, ATLAS-CONF-2012-166 (2012).https://cds.cern.ch/record/1497732.
[19] ATLAS Collaboration,Search for a heavy top-quark partner in final states with two leptons with te ATLAS detector at the LHC, JHEP11(2012) 094.
[20] ATLAS Collaboration,Search for a supersymmetric top-quark partner in final states with two leptons in √
s=8 TeV pp collisions using 13−1of ATLAS data, ATLAS-CONF-2012-167 (2012).
https://cds.cern.ch/record/1497733.
[21] CMS Collaboration,Search for direct top squark pair production in events with a single isolated lepton, jets and missing transverse energy at √
s=8TeV, CMS-PAS-SUS-12-023 (2012).
http://cds.cern.ch/record/1494074.
[22] CMS Collaboration,Inclusive search for supersymmetry using the razor variables in pp collisions at √
s=7TeV, submitted to Phys. Rev. Lett (2012),arXiv:1212.6961 [hep-ex].
[23] CMS Collaboration,Search for supersymmetry in final states with missing transverse energy and 0, 1, 2, or at least 3 b-quark jets in 7 TeV pp collisions using the variable alphaT, JHEP01(2013) 077,arXiv:1210.8115 [hep-ex].
[24] CMS Collaboration,Scalar Top Quark Search with Jets and Missing Momentum in pp Collisions at √
s=7TeV, CMS-PAS-SUS-11-030 (2011).http://cds.cern.ch/record/1494575.
[25] M. Asano, H. D. Kim, R. Kitano, and Y. Shimizu,Natural Supersymmetry at the LHC, JHEP12 (2010) 019,arXiv:1010.0692 [hep-ph].
[26] ATLAS Collaboration,Search for scalar top quark pair production in natural gauge mediated supersymmetry models with the ATLAS detector in pp collisions at √
s=7TeV, Phys. Lett.B715 (2012) 44–60,arXiv:1204.6736 [hep-ex].
[27] ATLAS Collaboration,The ATLAS Experiment at the CERN Large Hadron Collider, JINST3 (2008) S08003.
[28] ATLAS Collaboration,ATLAS tunes of PYTHIA 6 and Pythia 8 for MC11, ATL-PHYS-PUB-2011-009 (2011).https://cds.cern.ch/record/1363300.
[29] P. Nason,A New method for combining NLO QCD with shower Monte Carlo algorithms, JHEP11 (2004) 040,arXiv:hep-ph/0409146 [hep-ph].
[30] T. Sj¨ostrand, S. Mrenna and P. Skands,PYTHIA 6.4 Physics and Manual, JHEP05(2006) 026, arXiv:hep-ph/0603175.
[31] P. M. Nadolsky et al.,Implications of CTEQ global analysis for collider observables, Phys. Rev.
D78(2008) 013004,arXiv:0802.0007 [hep-ph].
[32] M. L. Manganoet al.,ALPGEN, a generator for hard multiparton processes in hadronic collisions, JHEP07(2003) 001,arXiv:hep-ph/0206293.
[33] G. Corcella et al.,HERWIG 6: An event generator for hadron emission reactions with interfering gluons (including supersymmetric processes), JHEP01(2001) 010,arXiv:hep-ph/0011363.
[34] B. P. Kersevan and E. Richter-Was,The Monte Carlo event generator AcerMC version 2.0 with interfaces to PYTHIA 6.2 and HERWIG 6.5,arXiv:hep-ph/0405247 [hep-ph].
[35] J. Alwall, M. Herquest, F. Maltoni, O. Mattelaer and T. Stelzer,MadGraph 5 : Going Beyond, arXiv:1106.0522 [hep-ph].
[36] M. Garzelli, A. Kardos, C. Papadopoulos, and Z. Trocsanyi,tt W¯ +−and tt Z Hadroproduction at¯ NLO accuracy in QCD with Parton Shower and Hadronization effects, JHEP11(2012) 056, arXiv:1208.2665 [hep-ph].
[37] J. M. Butterworth, J. R. Forshaw and M. H. Seymour,Multiparton interactions in photoproduction at HERA, Z. Phys.C72(1996) 637–646,arXiv:hep-ph/9601371.
[38] F. Campanario et al.,QCD corrections to charged triple vector boson production with leptonic decay, Phys. Rev.D78(2008) 094012,arXiv:0809.0790 [hep-ph].
[39] T. Sj¨ostrand, S. Mrenna and P. Skands,A brief introduction to PYTHIA 8.1, Comput. Phys.
Commun.178(2008) 852–867,arXiv:0710.3820 [hep-ph].
[40] M. Bahr et al.,Herwig++Physics and Manual, Eur. Phys. J.C58(2008) 639–707, arXiv:0803.0883 [hep-ph].
[41] W. Beenakker et al.,Stop production at hadron colliders, Nucl. Phys.B515(1998) 3–14, arXiv:hep-ph/9710451.
[42] W. Beenakker et al.,Supersymmetric top and bottom squark production at hadron colliders, JHEP 08(2010) 098,arXiv:1006.4771 [hep-ph].
[43] W. Beenakker et al.,Squark and gluino hadroproduction, Int.J.Mod.Phys.A26(2011) 2637–2664, arXiv:1105.1110 [hep-ph].
[44] M. Kramer et al.,Supersymmetry production cross sections in pp collisions at √
s=7TeV, arXiv:1206.2892 [hep-ph].
[45] ATLAS Collaboration,The ATLAS Simulation Infrastructure, Eur. Phys. J.C70(2010) 823–874, arXiv:1005.4568 [physics.ins-det].
[46] GEANT4 Collaboration, S. Agostinelliet al.,GEANT4: A simulation toolkit, Nucl. Inst. Meth.
A506(2003) 250–303.
[47] M. Cacciari, C. P. Salam and G. Soyez,The anti-kt jet clustering algorithm, JHEP04(2008) 063.
[48] ATLAS Collaboration,Jet energy measurement with the ATLAS detector in proton-proton collisions at √
s=7TeV, submitted to Eur. Phys. J. C (2011),arXiv:1112.6426 [hep-ex].
[49] ATLAS Collaboration,Commisioning of the ATLAS high-performance b-tagging algorithms in the 7 TeV collision data, ATLAS-CONF-2011-102 (2011).
https://cdsweb.cern.ch/record/1369219.
[50] ATLAS Collaboration,Electron performance measurements with the ATLAS detector using the 2010 LHC proton-proton collision data, Eur. Phys. J.C72(2011) 1909,arXiv:1110.3174 [hep-ex].
[51] ATLAS Collaboration,Muon reconstruction efficiency in reprocessed 2010 LHC proton-proton collision data recorded with the ATLAS detector, ATLAS-CONF-2011-063.
https://cdsweb.cern.ch/record/1345743.
[52] ATLAS Collaboration,A measurement of the ATLAS muon reconstruction and trigger efficiency using J/psi decays, ATLAS-CONF-2011-021.https://cdsweb.cern.ch/record/1336750.